COMMERCIAL REAL ESTATE TRENDS & OUTLOOK - February 2020 - National Association of REALTORS Research Group - National Association ...

Page created by Herman Thornton
 
CONTINUE READING
COMMERCIAL REAL ESTATE TRENDS & OUTLOOK - February 2020 - National Association of REALTORS Research Group - National Association ...
COMMERCIAL REAL ESTATE
  TRENDS & OUTLOOK
                February 2020

National Association of REALTORS® Research Group
COMMERCIAL REAL ESTATE TRENDS & OUTLOOK - February 2020 - National Association of REALTORS Research Group - National Association ...
COMMERCIAL REAL ESTATE TRENDS & OUTLOOK
February 2020

NAR RESEARCH GROUP Lead Team

Research and Analysis

LAWRENCE YUN, PhD
Chief Economist & Senior Vice President for Research

GAY CORORATON
Senior Economist & Director of Housing and Commercial Research

Survey Deployment and Editing

MEREDITH DUNN
Research Manager

ANNA SCHNERRE
Research Assistant

©2020 National Association of REALTORS®
All Rights Reserved. May not be reprinted in whole or in part without permission of the National Association of
REALTORS®. For question about this report or reprint information, contact data@realtors.org.

Download report at: https://www.nar.realtor/commercial-real-estate-market-survey
Cover Photo: Dimitry Anikin
COMMERCIAL REAL ESTATE TRENDS & OUTLOOK - February 2020 - National Association of REALTORS Research Group - National Association ...
COMMERCIAL REAL ESTATE TRENDS & OUTLOOK
February 2020 Report

  This latest Commercial Real Estate Trends & Outlook Report discusses trends in the small
  commercial market (transactions that are typically less than $2.5 million) based on a survey of
  commercial REALTORS® about their 2019 Q4 transactions and the latest publicly available data.

  Respondents reported commercial dollar sales volume rose 4% in 2019 Q4 from one year ago,
  new leasing dollar volume rose 3%, and commercial development (in square feet) rose 5%.

  Among respondents, the median commercial sales price growth in 2019 Q4 from one year ago
  was 3%. Apartment, industrial warehouse and flex, and office class A properties had the lowest
  cap rates, with a median of 6.5%. Among respondents, the median cap rate for retail mall
  properties was also 6.5%. The retail trade industry appears to be adapting to the challenge
  coming from robust e-commerce sales. In November 2019, the retail trade industry gained
  15,300 net new jobs from one year ago, in contrast to the job losses in past months.

  Respondents reported that vacancy rates were still trending downwards. Among respondents,
  the average commercial vacancy rate across commercial types (multi-family, industrial, retail,
  and hotel) was 7.3% in 2019 Q4. The lowest rental vacancy rates were in multi-family, at 4%,
  followed by industrial, at 5%. The highest vacancy rates were in office, at 10%, followed by
  retail, at 9%.

  Respondents reported that construction activity (in square feet) was up 5% in 2019 Q4 from one
  year ago. Given the low level of interest rates, majority of respondents reported an
  improvement in conditions related to obtaining debt (60%) and equity financing (57%). However,
  only a small fraction reported an improvement pertaining to zoning regulations (33%), hiring
  and cost of labor (23%), and obtaining and cost of raw materials (21%).

  Majority of respondents reported observing an increase in construction activity outside the
  central business district (73%), repurposing of retail malls (71%), senior housing (68%), transit-
  oriented development (67%), co-working spaces (62%), apartments with smart home
  technologies (58%), and Opportunity Zone Fund investments (53%).

  GDP growth is likely to pick up to 2.4% in 2020 given the de-escalation of trade tensions
  between the United States and China. With a pickup in growth, we expect commercial sales
  transactions to increase 3% in 2020 and commercial prices to increases to 2%. Slightly more
  than half (53%) of respondents expect more commercial business transactions in the next 12
  months. Vacancy rates for apartment and industrial will range between 6% to 7% while vacancy
  rates for office, retail, and hotel hover at 10%.

  Enjoy reading this latest report!
COMMERCIAL REAL ESTATE TRENDS & OUTLOOK - February 2020 - National Association of REALTORS Research Group - National Association ...
COMMERCIAL REAL ESTATE TRENDS & OUTLOOK
February 2020 Report

   CONTENTS

   1 | Economic Conditions.………………………………………………………………………………     5

   2 |Commercial Sales…………………………………………………………………………………..       7

   3 | Commercial Leasing ………………………………………….…………………………………      10

   4 | Commercial Construction………..…………………………………………………………….   12

   5 | Outlook………………………………………………………………………………………………….          13

   6 |Business Trends…..………………………………………………………………………………….      14

   7 | About the Survey……………………….…………………………………………………………..     17
COMMERCIAL REAL ESTATE TRENDS & OUTLOOK - February 2020 - National Association of REALTORS Research Group - National Association ...
GDP Annual Growth (%)
 Economic Growth Slowed in 2019 Q3
                                                        4.0
 As the U.S.-China tariff war escalated in 2019         3.0
 and investors became more concerned about                                                                                                                             2.1
 the economy’s long-term prospects, GDP                 2.0
 growth slowed to 2.1% in 2019 Q3. Private              1.0
 investment spending contracted for the second
                                                        0.0
 straight quarter by 1% as non-residential
 investment spending dropped by 2.3%, although          -1.0
 residential investment spending rose 4.6%,
                                                        -2.0
 buoyed by low mortgage rates. The pullback in
 business spending as somewhat offset by the            -3.0

                                                                 2007
                                                                        2008
                                                                               2009
                                                                                      2010
                                                                                             2011
                                                                                                    2012
                                                                                                           2013
                                                                                                                  2014
                                                                                                                         2015
                                                                                                                                2016
                                                                                                                                       2017
                                                                                                                                              2018
                                                                                                                                                     2019Q1
                                                                                                                                                              2019Q2
                                                                                                                                                                       2019Q3
 expansion in private consumer spending that
 rose 3.2%, amid strong job growth. Net exports
 rose a modest 1% after contracting in the prior                                                                                                     Source: BEA
 quarter, while imports increased 2% after a flat
 growth in the prior quarter. Government                                                     Annual Growth
 spending rose 4.8% due to the strong growth in
                                                                Private Consumption                          Gross Domestic Investment
 federal spending of 8.3%.                               20.0
                                                         15.0
                                                         10.0
 Sustained Job Creation in 2019                                                                                                                                        3.2
                                                          5.0
                                                          0.0
 Job creation remained strong in 2019, with 2.1          -5.0                                                                                                     -1.0
 million net new payroll jobs created as of             -10.0
 December 2019 compared to one year ago.                -15.0
 Payroll jobs rose in all sectors except in utilities   -20.0
 and mining/logging. The retail trade industry,         -25.0

                                                                    2016
                                                                    2005
                                                                    2006
                                                                    2007
                                                                    2008
                                                                    2009
                                                                    2010
                                                                    2011
                                                                    2012
                                                                    2013
                                                                    2014
                                                                    2015

                                                                    2017
                                                                    2018
                                                                  2019Q1
                                                                  2019Q2
                                                                  2019Q3
 which had been losing jobs in past months,
 created net new jobs (15,300). The construction
 industry created 143,000 net new jobs, although                                                                                                     Source: BEA
 this is about half of the 342,000 annual jobs
 created in January 2019.                                      Annual Change in Payroll Employment in
                                                                   December 2019 (in thousands)
 The unemployment rate dipped to 3.5%, at par
 with 50 years ago. The number of 16+ year-old                                Educ./Health                                                                         645
 unemployed workers trended downwards to                               Leisure/Hospitality                                                               401
 5.75 million, near the level in 2000 (5.69 million).                   Prof./Bus. Services                                                              400
                                                                              Government                                                        158
                                                                              Construction                                                      143.0
                                                        Financial and Real Estate Activities                                                    122
                                                             Transportation/Warehousing                                                        71
                                                                          Wholesale Trade                                                      64
                                                                            Manufacturing                                                     50
                                                                               Information                                                    18
                                                                               Retail Trade                                                   15.3
                                                                                   Utilities                                 -2.0
                                                                           Mining/Logging                                  -22.0               Source: BLS

NATIONAL ASSOCIATION of REALTORS® | RESEARCH GROUP | www.nar.realtor/research-and-statistics                                                                                    5
COMMERCIAL REAL ESTATE TRENDS & OUTLOOK - February 2020 - National Association of REALTORS Research Group - National Association ...
Nonfarm payroll jobs increased in all states, except
 Wyoming, Oklahoma, and West Virginia. The states
 with the strongest job growth were Utah (3.0%),
 Texas (2.7%), Nevada (2.7%), Idaho (2.6%),
 Washington (2.5%), Florida (2.5%), Alabama
 (2.4%), Arizona (2.4%), Rhode Island (2.2%), and
 Colorado (2.1%).

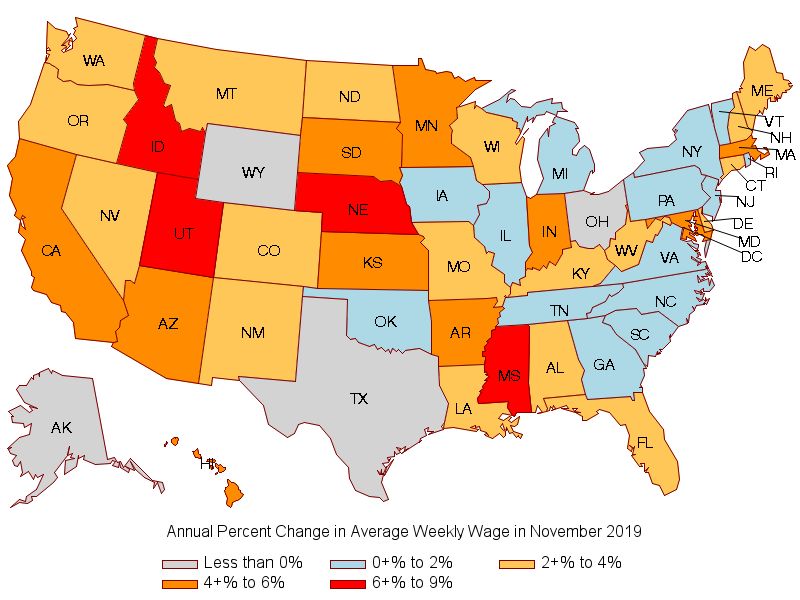
 Wage Growth Tapers as Inflation Picks Up

 Even as the unemployment rate continues to fall,
 average weekly wage growth has tapered. In
 December 2019, average weekly rose 2.3% from
 one year ago, about the same pace as the inflation
 rate. Wages have been rising at slower pace since
 January 2019 while inflation has picked up, resulting
 in no real wage gains for workers. Meanwhile, CPI-
 Shelter, an indicator for the price of housing
 services (e.g., rent) rose 3.2%. Rent growth has
 generally outpaced inflation and wage growth since
 2012, an indication that housing supply remains low
 relative to demand.

 Average weekly wages rose in all states, except in
 Wyoming, Ohio, Alaska, and Texas (this may just be
 a statistical fluke given Texas’ strong job growth.

 Yield Curve Normalized in November 2019

 The Federal Open Market Committee lowered the
 federal funds rate three times in 2019 by a total of
 0.75%, to the current range of 1.5% to 1.75%. The                Inflation Rate
                                                                  Y/Y Pct Change in Average Weekly Wage
 yield curve normalized in November 2019 after it
                                                                  CPI-Shelter
 inverted in January 2019 when the 5-year T-note          6.0
 yield fell below the 1-yr T-bill rate.                   5.0
                                                          4.0
         1-yr T-bill rate       5-yr T-Note yield
                                                          3.0                                                 3.2
         10-yr T-Note yield     30-yr T-bond rate         2.0
4.00                                                                                                         2.27
                                                          1.0
3.00                                                      0.0
2.00                                                     -1.0
                                                         -2.0
1.00
                                                         -3.0
                                                                Jun/2009

                                                                Jun/2012

                                                                Jun/2015

                                                                Jun/2018
                                                                Mar/2010
                                                                Mar/2007
                                                                Dec/2007
                                                                Sep/2008

                                                                Dec/2010
                                                                Sep/2011

                                                                Mar/2013
                                                                Dec/2013
                                                                Sep/2014

                                                                Mar/2016
                                                                Dec/2016
                                                                Sep/2017

                                                                Mar/2019
                                                                Dec/2019

0.00
         Jul/2017
       May/2017

         Jul/2018

         Jul/2019
       Mar/2017

       Sep/2017

       May/2018
       Mar/2018

       Sep/2018

       May/2019
       Mar/2019

       Sep/2019
       Nov/2017

       Nov/2018

       Nov/2019
        Jan/2017

        Jan/2018

        Jan/2019

                                                                                                      Source: BLS
                                         Source: FRB

 NATIONAL ASSOCIATION of REALTORS® | RESEARCH GROUP | www.nar.realtor/research-and-statistics                       6
Sustained Growth in Small Market
Commercial Sales Transactions in 2019 Q4
                                                                                               Quarterly Sales Volume
                                                                                                    (YoY % Chg)
                                                                        40%
In the small commercial real estate market
(below $2.5 million average sales volume),                              30%
sales volume rose 4% in 2019 Q4 from one                                20%
year ago, according to commercial members of
                                                                        10%
the National Association of REALTORS® who                                                                                                                        4%
responded to NAR’s 2019 Q4 Commercial                                    0%
Real Estate Quarterly Market Survey.                                   -10%

Notwithstanding the slowdown in growth in                              -20%
2019, respondents reported no change in the                            -30%

                                                                                 2012

                                                                                        2013

                                                                                                2014

                                                                                                       2015

                                                                                                              2016

                                                                                                                     2017

                                                                                                                            2018

                                                                                                                                                                  2019.Q4
                                                                                                                                   2019.Q1

                                                                                                                                             2019.Q2

                                                                                                                                                       2019.Q3
pace of sales during 2019. The majority of
respondents also reported an improvement in
local economic conditions in 2019 Q4 from one
year ago (78% ) and national economic                                           REALTOR® CRE Markets                         $2.5+M Market
conditions (75%). Majority also reported they
saw an improvement in obtaining debt (60%)                                              Sources: National Association of REALTORS®, Real Capital Analytics

and equity financing (57%), given the low level
of interest rates.

Based on the diffusion index* for each asset                              Diffusion Index of the Y/Y Change in Sales
class, sales transactions for apartment and                                        Volume (>50: Increased)
industrial properties had the strongest gains
compared to other asset classes (above 50).                                    67 66 66 63
Transactions in the office market were almost                                              62 60 59
                                                                                                                      55 54 53 52
stable (hovering around 50) while sales                                                                                           50
transactions for retail properties were weaker                                                                                                         38 37
compared to one year ago (below 50).

In the large CRE market (at least $2.5M), the
dollar sales volume was down by 27% year-
over-year in October‒November 2019, as the
dollar volume of transactions fell to $73.3 billion
from $100.4 billion during the same period one
year ago, according to Real Capital Analytics.
Investors in the large commercial real estate
market ($2.5 million or more) were more likely
impacted by the heightened economic and
global tensions in 2019 than small investors.

* A diffusion index above 50 means more respondents reported an increase in sales activity in the reference quarter compared to one year
ago than the number of respondents who reported a decrease, indicating that the market is broadly “stronger” compared to one year ago. A
value of 50 means a “stable” market, while an index below 50 means a ‘”weaker” market.

 NATIONAL ASSOCIATION of REALTORS® | RESEARCH GROUP | www.nar.realtor/research-and-statistics                                                                               7
Strong Price Growth in the West Region and                                    REALTORS® CRE Market
in Industrial Property Transactions                                          Price Change (YoY % Chg)
                                                     10%
In the small commercial real estate market
(sales transactions of less than $2.5 million),       5%                                                                                                        3%
commercial property prices were up 3% in 2019
Q4 from one year ago.                                 0%

                                                     -5%
Commercial price indices compiled by other
institutions also show that commercial prices are    -10%
still on the uptrend. The Green Street               -15%
Commercial Price Index, which tracks REIT
investments, rose 2.5% in 2019 Q4.                   -20%

                                                     -25%
The National Council of Real Estate Investment

                                                            2009
                                                                   2010
                                                                          2011
                                                                                 2012
                                                                                        2013
                                                                                               2014
                                                                                                      2015
                                                                                                             2016
                                                                                                                    2017
                                                                                                                           2018
                                                                                                                                  2019.Q1
                                                                                                                                            2019.Q2
                                                                                                                                                      2019.Q3
                                                                                                                                                                2019.Q4
Fiduciaries reported a 6% y/y increase in the
transactions-based price index in 2019 Q3 from
one year ago, with the strongest price gain in the                                             Source: National Association of Realtors®
industrial market (10.3%), followed by office
(5.5%), apartment (3.3%), and lastly retail
(0.7%).

Based on the NCREIF Index, the West region
had the strongest commercial price appreciation                      Y/Y % Chg in NCREIF Transactions-Based
in 2019 Q3 from one year ago (8.1%), followed                                Commercial Price Index
by the South (6.7%), the North (4.1%), and
lastly, the Midwest (3.5%).

     NCREIF Transactions-Based Price Index
       by Region, YoY % Chg in 2019 Q3                                                    Office: 5.5%
     8.1

                  6.7
                                                                                        Industrial: 10.3%

                              4.1
                                          3.5
                                                                                          Apartment: 3.3%

                                                                                          Retail: 0.7%
     West       South        East      Midwest

  NATIONAL ASSOCIATION of REALTORS® | RESEARCH GROUP | www.nar.realtor/research-and-statistics                                                                  8
Cap Rates Still Trending Down
                                                                Cap Rates in REALTORS® Market and
 Cap rates for transactions in the small commercial                    $2.5+M Transactions
 real estate market (below $2.5 million)
 compressed to 6.6% in 2019 Q4 from 6.9% in
                                                        10.0%
 2019 Q2. On the other hand, cap rates in the
 large commercial market ($2.5 million or more           9.0%
 transactions) reported by Real Capital Analytics        8.0%
 trended up in the second half of 2019, to 6.9% in
 2019 Q4 from 6.1% in 2019 Q2. Large                     7.0%                                                     6.9%
 commercial real estate investors appeared to            6.0%                                                     6.6%
 have factored in to a greater degree the risks from
 a potential economic downturn as economic               5.0%
 growth slowed during the year, the yield curve          4.0%

                                                                     2018
                                                                     2010
                                                                     2011
                                                                     2012
                                                                     2013
                                                                     2014
                                                                     2015
                                                                     2016
                                                                     2017

                                                                  2019.Q1
                                                                  2019.Q2
                                                                  2019.Q3
                                                                  2019.Q4
 inverted, and investment spending contracted.

 In the small commercial real estate market, multi-
 family, industrial warehouse and flex, and office                REALTOR® CRE Markets         $2.5+M Market
 class A properties had the lowest cap rate, at                                     Sources: NAR, Real Capital Analytics
 6.5%. The median cap rate among respondents
 for retail mall properties was also 6.5%. The retail
 trade industry appears to be adapting to the
 challenge coming from robust e-commerce sales.                 REALTORS® Commercial Capitalization
 In November 2019, the retail trade industry gained                          Rates
 15,300 net new jobs from one year ago, in
 contrast to the job losses in past months.               11.0%
                                                          10.0%
                                                           9.0%
  Cap Rates in 2019 Q4                                     8.0%
  All Commercial                                6.7        7.0%
  Office: Class A                               6.5        6.0%
                                                           5.0%
  Office: Class B/C                             7.0
                                                                       2010
                                                                       2011
                                                                       2012
                                                                       2013
                                                                       2014
                                                                       2015
                                                                       2016
                                                                       2017
                                                                       2018
                                                                    2019.Q1
                                                                    2019.Q2
                                                                    2019.Q3
  Industrial: Warehouse                         6.5                 2019.Q4

  Industrial: Flex                              6.5
                                                                        Office             Industrial
  Retail: Strip Center                          6.8
                                                                        Retail             Multifamily
  Retail: Mall                                  6.5
                                                                        Hotel              All commercial
  Apartment                                     6.5
  Hotel/Hospitality                             7.3
  Source: 2019 Q4 NAR CRE Market Survey
  For $2.5 million or less properties

NATIONAL ASSOCIATION of REALTORS® | RESEARCH GROUP | www.nar.realtor/research-and-statistics                           9
REALTORS® Commercial Leasing Volume
 Strong Leasing Activity in Apartment and
 Industrial Market
                                                                                                                                     (YoY % Chg)
                                                                                                                  20%
 REALTORS® and commercial affiliate                                                                               15%
 members reported a 3.1% increase in new                                                                          10%
                                                                                                                                                                                                                       3.1%
 leasing dollar volume in 2019 Q4 compared to                                                                      5%
                                                                                                                   0%
 one year ago. This is a slower pace of increase
                                                                                                                  -5%
 compared to the 5% growth in 2018.                                                                              -10%
                                                                                                                 -15%
 Based on the diffusion index by property type,                                                                  -20%
 leasing activity increased most strongly for                                                                    -25%
 apartment and industrial warehouse and flex                                                                     -30%

                                                                                                                          2009
                                                                                                                                 2010
                                                                                                                                        2011
                                                                                                                                               2012
                                                                                                                                                      2013
                                                                                                                                                             2014
                                                                                                                                                                    2015
                                                                                                                                                                           2016
                                                                                                                                                                                  2017
                                                                                                                                                                                         2018
                                                                                                                                                                                                2019.Q1
                                                                                                                                                                                                          2019.Q2
                                                                                                                                                                                                                    2019.Q3
                                                                                                                                                                                                                              2019.Q4
 properties. Office leasing activity was also
 broadly strong, as well as leasing in retail strip
 centers (above 50). Respondents reported that                                                                                    Sources: National Association of REALTORS®, Real Capital Analytics
 their new leasing volume in retail malls
 contracted in 2019 Q4 compared to one year                                                                      Diffusion Index of the Y/Y Change in Leasing
 ago.                                                                                                                      Volume (>50: Increased)

 Vacancy rates in the small commercial real                                                                             70 68 68
                                                                                                                                 66 65 64 63
 estate market generally trended down in 2019,                                                                                               62 60
                                                                                                                                                   57
 to 7.3% in 2019 Q4, from 11% in 2019 Q1. The                                                                                                                                                                       45 44
 lowest median vacancy rates were in apartment
 (4%) and industrial properties (5%), with the
 highest vacancy rates in retail and office (9%).

        REALTORS® Commercial Vacancy Rates
30.0%
25.0%
20.0%
15.0%
10.0%
 5.0%
                                                                                                                        Median Vacancy Rates in 2019 Q4
 0.0%
                                                                                                                        All commercial              7.3%
          2010
                 2011
                        2012
                               2013
                                      2014
                                             2015
                                                    2016
                                                           2017
                                                                  2018
                                                                         2019.Q1
                                                                                   2019.Q2
                                                                                             2019.Q3
                                                                                                       2019.Q4

                                                                                                                        Multifamily                 4.0%
          Office                         Industrial                       Retail
                                                                                                                        Industrial                  5.0%
          Multifamily                    Hotel                            Average                                       Retail                      8.8%
                                                                                                                        Office                      9.0%
                                                                                                                        Source: 2019 Q4 NAR CRE Market Survey
                                                                                                                        For $2.5 million or less properties
NATIONAL ASSOCIATION of REALTORS® | RESEARCH GROUP | www.nar.realtor/research-and-statistics                                                                                                                                   10
The U.S. rental vacancy rate has mainly been                    U.S. Rental Vacancy Rate        Y/Y Rent Growth (%)
  trending downwards since 2012, to 6.8% in            10.0                                                    3.8%   4.0%
  2019 Q3. As rental rates have tightened, rent                                                                       3.8%
                                                        9.0                                                           3.6%
  growth has mainly trended upwards, to 3.8% in                                                                       3.4%
                                                        8.0
  2019 Q3. Rent growth outpaced inflation of 2%                                                                   6.8 3.2%
  and average weekly wage growth of 2.5%                7.0                                                           3.0%
                                                                                                                      2.8%
  during this quarter.                                  6.0                                                           2.6%
                                                        5.0                                                           2.4%
  Rental vacancy rates have remained low as                                                                           2.2%
                                                        4.0                                                           2.0%
  housing starts have not kept pace with net

                                                               Q1/2012
                                                               Q3/2012
                                                               Q1/2013
                                                               Q3/2013
                                                               Q1/2014
                                                               Q3/2014
                                                               Q1/2015
                                                               Q3/2015
                                                               Q1/2016
                                                               Q3/2016
                                                               Q1/2017
                                                               Q3/2017
                                                               Q1/2018
                                                               Q3/2018
                                                               Q1/2019
                                                               Q3/2019
  household formation. As of 2019 Q3, housing
  starts fall short of household formation by about
                                                                                    Sources: U.S. Census Bureau, Bureau
  200,000 units.

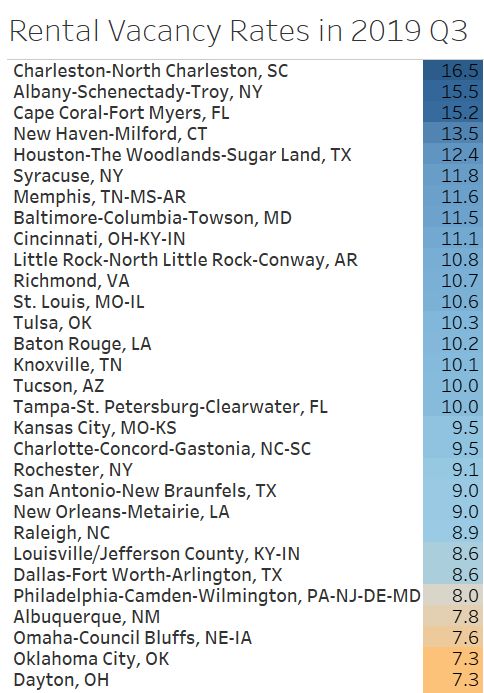
  Among the largest 75 metro areas for which the
  U.S. Census Bureau produces data on rental                  On the other hand, rental vacancy rates
  vacancy rates, the lowest vacancy rates were                were over 11% in the metropolitan areas
  in Worcester, MA-CT (1.1%); Minneapolis, MN                 of Charleston, SC; Albany, NY; Cape
  (2%); Buffalo, NY (2.8%); Grand Rapids, MI                  Coral, FL; New Haven, CT; Houston, TX;
  (2.8%); San Francisco (3.3%); San Jose                      Syracuse, NY; Memphis, TN; Baltimore,
  (3.7%); and Los Angeles (3.9%).                             MD; and Cincinnati, OH.

                Source: U.S. Census Bureau
NATIONAL ASSOCIATION of REALTORS® | RESEARCH GROUP | www.nar.realtor/research-and-statistics                              11
Seasonalized Annualized Value of
  Slight Uptick in Commercial Construction
                                                                         Construction Put in Place for
  Activity
                                                                         Multifamily, Lodging, Office,
  The construction of commercial space dipped in                         Commercial Properties as of
  2019. The U.S. Census Bureau reported that the                            November 2019 ($Bn)
  seasonalized annual value of construction put in           $300
  place for commercial properties ((buildings for            $250
  wholesale, retail, and selected service
  industries), office, lodging, and multifamily              $200
  structures decreased to $238 billion as of                 $150
  November 2019, from $246 billion in June 2019.
                                                             $100
  However, commercial members of the National                 $50
  Association of REALTORS® who typically
  engage in the small commercial real estate                      $0

                                                                       May/2017
                                                                       Apr/2015

                                                                       Dec/2016

                                                                       Oct/2017
                                                                        Jan/2014
                                                                       Jun/2014
                                                                       Nov/2014

                                                                       Mar/2018

                                                                        Jan/2019
                                                                       Aug/2018

                                                                       Jun/2019
                                                                       Nov/2019
                                                                       Sep/2015
                                                                       Feb/2016
                                                                         Jul/2016
  market (sales of $2.5 million) reported that
  construction activity (in square feet) rose 5% in
  2019 Q4 from one year ago, about the same
  pace during the first three quarters of 2019, but
  slower than the 15% expansion in 2018. The
                                                                   Year-over-Year Change in Construction
  pace of construction activity peaked in 2016 and
                                                                     Volume Among NAR Commercial
  has tapered since then.
                                                                          Members and Affiliates
  By property type, respondents reported the                30%
  strongest annual increase for apartment and               20%
                                                            10%                                                                                                        5%
  industrial properties. Respondents reported a
  decline in construction activity for office class B        0%
                                                           -10%
  and malls.
                                                           -20%
       Diffusion Index of the Y/Y Change in                -30%
      Construction in Sq. Ft. (>50: Increased)             -40%
                                                           -50%
          76 71                                            -60%
                70 66
                      64 62 62 61                          -70%
                                  57 53
                                                                          2010
                                                                   2009

                                                                                 2011
                                                                                        2012
                                                                                               2013
                                                                                                      2014
                                                                                                             2015
                                                                                                                    2016
                                                                                                                           2017
                                                                                                                                  2018
                                                                                                                                         2019.Q1
                                                                                                                                                   2019.Q2
                                                                                                                                                             2019.Q3
                                                                                                                                                                       2019.Q4
                                        49 46
                                                   36 35

                                                                                                      Source: National Association of Realtors®

NATIONAL ASSOCIATION of REALTORS® | RESEARCH GROUP | www.nar.realtor/research-and-statistics                                                                 12
Macroeconomic Outlook
                                                                                      2020 OUTLOOK: as of January 2020
                                                                                                         2018       2019                             2020F
We expect GDP growth to pick up to 2.4% in
                                                        Economy
2020 given the de-escalation of trade tensions
                                                        Real GDP, % Growth                                        2.9%                  2.1%                2.4%
between the United States and China, starting           Inflation Rate                                            2.4%                  2.0%                2.0%
with the signing of the Phase One Trade Deal in         Unemployment Rate                                         3.9%                  3.7%                3.6%
January 2020. We view this development as               30-Yr Fixed Rate                                          4.5%                  4.0%                3.8%

having a positive impact on investor confidence         Housing Starts ( in '0000
and rising business investment. Unemployment            Total                                                   1,250                1,290                 1,368
rate will further ease to 3.6%,                         Single-family                                             876                  888                   953
                                                        Multi-family                                              374                  402                   415

The Federal Open Market Committee to likely             Commercial Market*
maintain the federal funds rate at the current
                                                        Commercial Sales, % change                                2.2%                  0.1%                3.7%
range of 1.5% to 1.75%. Under an
accommodating monetary policy, the 30-year              Commercial Prices, % change                               3.8%                  1.4%                2.4%
fixed contract mortgage rate is expected to stay
                                                        Vacancy Rates*
below 4%, which will support 5.5 million of             Apartment                                                6.9%                 6.9%                  6.8%
existing home sales and 0.75 million of new             Industrial                                               7.3%                 6.4%                  6.3%
                                                        Office                                                  12.5%                11.0%                 10.9%
home sales. Low interest rates will keep debt           Retail                                                  12.5%                10.5%                 10.4%
financing for new home construction low,                Hotel                                                   16.1%                10.6%                 10.5%
encouraging the production of more homes. As
                                                        Source: National Association of REALTORS®
builders continue to see strong demand for both         * Commercial sales and price forecasts are for commercial market transactions of less than $2.5 million.
owner-occupied homes and rentals, we expect              Apartment renta vacancy forecast is based on US Census rental vacancy rates.

builders to increase construction of new housing         Vacancy rates for other properties are based on REALTOR® transactions of less than $2.5 million

to 1.37 million, of which 415,000 (30%) will be
multi-family units.
                                                     Industrial properties will remain in demand given
Commercial Outlook
                                                     the sustained growth in e-commerce and as brick-
                                                     and-mortar retailers continue to attract and retain
With a pickup in growth, we expect commercial
                                                     their customers through online shopping and
sales transactions to increase 3% in 2020 and
                                                     delivery. The retail trade properties appears to be
commercial prices to increases to 2%. Nearly
                                                     coming back to life: 71% of respondents reported
half (53%) of respondents expect their
                                                     that they are retail stores being repurposed for
commercial business to increase in the next 12
                                                     other uses.
months.
                                                     In the multi-family market, 68% of respondents
With higher demand from stronger economic
                                                     reported that they are seeing an increase in
growth, we expect vacancy rates to tighten in
                                                     business for senior housing living and in transit-
2020. Multi-family and industrial will continue to
                                                     oriented development projects.
be strong commercial asset classes. Vacancy
rates for apartment and industrial will range
                                                     With the finalization of the regulations for
between 6% to 7% while vacancy rates for
                                                     Opportunity Zone investments last December 19,
office, retail, and hotel hover at 10%. The
                                                     2019, we expect more investments in OZ areas in
demand for apartment rentals will remain strong
                                                     2020. Nearly half of respondents reported an
in metro areas with low vacancy rates, such as
                                                     increase in investments funded from OZ funds in
in San Francisco, San Jose, and Los Angeles,
                                                     2019 Q3 from one year ago.
Seattle, Salt Lake City, and Washington D.C.
NATIONAL ASSOCIATION of REALTORS® | RESEARCH GROUP | www.nar.realtor/research-and-statistics                                                        13
A 2019 Q4 survey of commercial members of the National
  Association of REALTORS® were asked: “Did you observe an Increase
  in the following developments in your primary market compared to
  one year ago? The fraction of respondents* who reported Yes:

                     Senior housing: 68%

                    Transit-oriented development: 67%

                    Apartment with smart home technology: 58%

                     Group-living: 48%

                     Parking-free apartments: 32%

                     Micro-apartments: 32%

*Respondents answered Yes or No and skipped the question if they did not know. On average, there were
462 respondents who answered each question, +/- 28 respondents.
NATIONAL ASSOCIATION of REALTORS® | RESEARCH GROUP | www.nar.realtor/research-and-statistics     14
A 2019 Q4 survey of commercial members of the National
  Association of REALTORS® were asked: “Did you observe an increase
  in the following developments in your primary market compared to
  one year ago? The fraction of respondents* who reported Yes:

                      Construction outside Central Business District: 73%

                      Repurposing of Retail Malls: 71%

                      Co-working/flex spaces: 62%

                      Opportunity Zone Fund investments: 53%

                      LEED Certification: 43%

                     WELL Certification: 19%

*Respondents answered Yes or No and skipped the question if they did not know. On average, there were
462 respondents who answered each question, +/- 28 respondents.
NATIONAL ASSOCIATION of REALTORS® | RESEARCH GROUP | www.nar.realtor/research-and-statistics     15
A 2019 Q4 survey of commercial members of the National
  Association of REALTORS® were asked: “Did you see an improvement
  in these conditions in your primary market area compared to one
  year ago? The fraction of respondents* who reported Yes:

                    Local economic conditions: 78%

                     National economic conditions: 75%

                      Obtaining debt /equity financing: 60% / 57%

                       Zoning regulations: 33%

                      Hiring and cost of labor : 23%

                      Obtaining and cost of raw materials: 21%

*Respondents answered Yes or No and skipped the question if they did not know. On average, there were
472 respondents who answered each question, +/- 27 respondents.
NATIONAL ASSOCIATION of REALTORS® | RESEARCH GROUP | www.nar.realtor/research-and-statistics     16
NAR’s Quarterly Market Survey gathers information about the commercial transactions of
      REALTORS® and members of affiliate organizations (CCIM, SIOR, RLI, IREM, and the
      Counselors of Real Estate) and the opportunities and challenges facing commercial
      practitioners.

      The 2019 Q4 survey was sent to approximately 69,000 commercial REALTORS® and
      members of affiliate organizations during January 2–19, 2019, of which 844 responded to
      the survey. A smaller number of respondents reported their sales (538), leasing (333), and
      construction (310) activities.

      Among sales agents who had a sale during 2019 Q4, the average sales transaction was
      $598,000.

      Of the 844 respondents who answered the question about designations held by the
      respondent, 24% reported holding designations from an affiliated society, institute, or
      council.

                                       Designations Held Respondents
                 76.4%

                                  16.0%
                                                   4.7%             4.5%             2.7%            1.2%

              No designation CCIM: (The CCIM CPM®: (Institute SIOR: (Society of CRE™: (Counselor ALC: (REALTORS®
             from these NAR      Institute)   of Real Estate   Industrial and of Real Estate™) Land Institute)
            affiliated councils,              Management)          Office
                 institutes,                                    REALTORS®)
                  societies

NATIONAL ASSOCIATION of REALTORS® | RESEARCH GROUP | www.nar.realtor/research-and-statistics                       17
COMMERCIAL REAL ESTATE
                                     TRENDS & OUTLOOK

The National Association of REALTORS® is America’s largest trade association,
representing more than 1.4 million members, including NAR’s institutes, societies and
councils, involved in all aspects of the real estate industry. NAR membership includes
brokers, salespeople, property managers, appraisers, counselors and others engaged
in both residential and commercial real estate. The term REALTOR® is a registered
collective membership mark that identifies a real estate professional who is a member
of the National Association of REALTORS® and subscribes to its strict Code of
Ethics. Working for America's property owners, the National Association provides a
facility for professional development, research and exchange of information among its
members and to the public and government for the purpose of preserving the free
enterprise system and the right to own real property.

NATIONAL ASSOCIATION OF REALTORS®
RESEARCH GROUP

The Mission of the NATIONAL ASSOCIATION OF REALTORS® Research Group is
to produce timely, data-driven market analysis and authoritative business intelligence
to serve members, and inform consumers, policymakers and the media in a
professional and accessible manner.

To find out about other products from NAR’s Research Group, visit
www.nar.realtor/research-and-statistics

500 New Jersey Avenue, NW
Washington, DC 20001
202.383.1000
COMMERCIAL REAL ESTATE TRENDS & OUTLOOK
February 2020
©2020. National Association of REALTORS®. All rights reserved.

This report can be cited and reprinted with the proper citation guidelines provided here:
https://www.nar.realtor/research-and-statistics/citation-guidelines-for-nar-research-statistics.

For questions about this report, please email data@reaaltors.org.
You can also read