PT Nipress Tbk (IDX:NIPS) - Corporate Presentation October 12th, 2018
←
→
Page content transcription
If your browser does not render page correctly, please read the page content below

PT Nipress Tbk (IDX:NIPS)
Corporate Presentation
October 12th, 2018
Nipress – Our Team
Seasoned management with a combined tenure in Nipress of +50 years

                                                                          Jackson Tandiono – President Director
                                                                          Joined Nipress in 2000 after multiple roles in the USA and Singapore;
                                                                          appointed as President Director in 2012
                                                                          BSc in Finance from University of Southern California.

                                                                          Richard Tandiono – Director
Richard Tandiono                                                          Started his career with Nipress in 2006; appointed Director of Nipress
     Director                                                             2012 and President Director of NEO1 in 2016.
                                           Herman Selamat
                                                                          BSc and MSc in Engineering University of Southern California
      Jackson Tandiono                   Independent Director

       President DIrector

                                                                          Herman Slamet – Independent Director
                                                                          Joined Nipress in 1997 after 15 years in senior roles in battery
                                                                          business, currently holds the position of Independent Director.
                                                                          Bachelors in Marketing and Masters in Finance from University of Surabaya

1. NEO = PT Nipress Energi Otomotif, a majority-owned subsidiary of Nipress with operations in automotive batteries; Nipress spun-off its battery business to NEO in Jun-16
                                                                                         1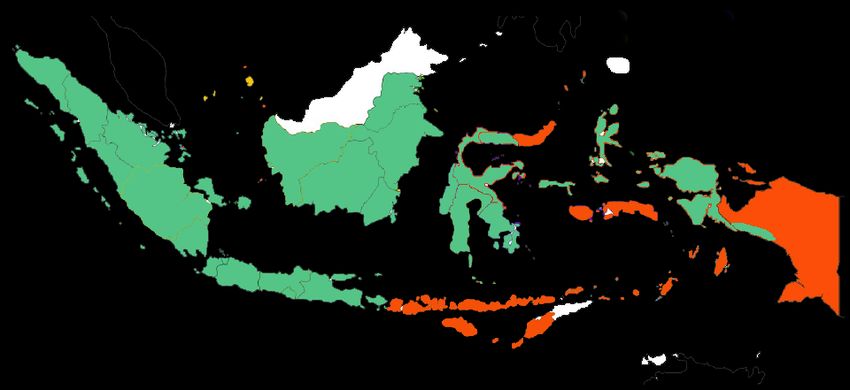
Agenda

Nipress: A leading player in Indonesia’s energy storage solutions

Automotive: Consistent market share gains

Industrial: Sole local producer of industrial lead acid batteries in Indonesia

Historical performance

Welcoming Johnson Controls: The global leader in automobile batteries

Growth plan

                                                          2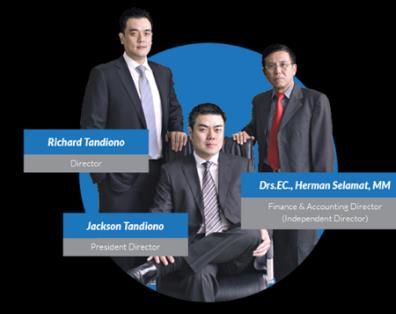
Introduction to PT Nipress Tbk
Established in 1970, Nipress is currently listed in IDX with a market cap of IDR608bn1

      1970                         1972-1991      1992-2006             2007          2010-2014      2015-now

                                                                                     Developed     Launch of NS
                                                                                    maintenance    Maintenance-
Established as                                  Grew product
                              Became a fully    line to serve
                                                                    Entered the      -free (MF)      free line
 JV between                                                          industrial
                               local entity      4W and 2W                            batteries
Nippondechi                                                         segment by                      Spun-off its
                              and listed in       under the
 Kogyo Co                                                            providing      Expanded its   auto business
                                   the Stock    “NS” brand
   with PT                                                          batteries for    OEM and          to NEO
                                  Exchange in    and other
  Pemuda                                          private           solar power     exporting to
                                     1991
  Express                                                              plant        key markets    JCI acquires
                                                  labels
                                                                                     across the    24.5% stake in
                                                                                       globe           NEO

After years of collaboration, Johnson Controls Intl (JCI), the global leader in lead acid batteries,
                              acquired 24.5% stake in NEO in 4Q18
1. Closing price as of 8-Oct-18
                                                                3
Nipress: Key Milestones
  Leading provider of energy storage solutions in Indonesia

                                                        Automotive2                                            Industrial2
                                                     (under NEO, a subsidiary)

                                                  60%                       13%                                    27%
 PT Nipress Tbk                               Of revenues                Of revenues                            Of revenues
 (IDX: NIPS)

 • Market Cap1:
   IDR608bn

 • Public float: 41%
                              •    OEM for notable                   auto brands                  The only local manufacturer of
 • Revenues LTM18:                                                                              industrial lead-acid batteries in Indonesia
   IDR1.08tn

 • ROE LTM18:
   5.2%
                              •     3rd largest player in replacement space
 • Production
   capacity:
                              •    c. 15% share of the domestic market                                                            Others
   4W: 3m batteries                                                                               Renewable
                                                                                                                   Telco        (traction /
                                                                                                    energy
   2W: 5m batteries
                              •    Exporting to 4 continents                                                                     military)
   Indst’l: 544KwH

1. Closing price 8-Oct-18; 2. Based on revenues of the 6 month period ending 30-Jun-18 (1H18)
                                                                                          4
Agenda
Nipress: A leading player in Indonesia’s energy storage solutions
Automotive: Consistent market share gains
Industrial: Sole local producer of industrial lead acid batteries in Indonesia
Historical performance
Welcoming Johnson Controls: The global leader in automobile batteries
Growth plan
5Nipress’ auto business (73% of total revenues)
Consistent market share gains amidst soft growth of Indonesian automotive sector
OEM Replacement Exports
1 2 3
Placed by auto Replacement market; Export to numerous
manufacturers at divided to NS-branded markets across 4
assembly; under NS brand and private labels continents
Contribution to 18% 58% 25%
auto rev’n 1H18 (15% 4W, 3% 2W) (42% 4W, 16% 2W) (24% 4W, 1% 2W)
Total auto
Revenue 1H18
YoY gr.
+106% +17% -40% +0.9%
YoY
Focus shift towards higher softer due to drag
Rapid growth of NS via Rationalizing portfolio
margin NS-branded, riding from rationalizing
Growth trends market share gains, away from non-profitable exports
on the back of OEM
beating soft auto sector markets
growth1
1. Based on internal research, most buyers will opt for the same brand of batteries currently installed in their car upon replacement
6Auto market: Soft growth of new motor vehicle sales over the past 3 years
New car sales in Indonesia1 New motorcycle sales Indonesia1
(‘000 units) (‘000 units)
1.230 1.208 +3.2% CAGR 15-17 7.744 7.867
1.062 1.080 6.480
1.013 5.931 5.886
534 554
3.003
2.701
2013 2014 2015 2016 2017 1H17 1H18 2013 2014 2015 2016 2017 1H17 1H18
Market has potential to recover; motorized vehicle ownership per capita in Indonesia is still low
vs. emerging market peers
1. Gaikindo and AISI data
71 OEM: NS OEM batteries grew strongly amidst soft market growth
Growth of new car sales vs. Nipress 4W OEM Growth of new moto sales vs. Nipress 2W OEM
(‘000 units) (‘000 units)
Indonesian new car sales Nipress 4W OEM Indonesian new motorcycle sales Nipress 2W OEM
82,6% NS OEM 2W still
381%
development phase in
51,4% ‘13
102%
8,4% 3,8% 38%
-3,2% 3,2% -6,6% 11,2%
-4,7%
CAGR '13-17 CAGR '15-17 YoY 1H17-18 CAGR '13-17 CAGR '15-17 YoY 1H17-18
In IDR terms, NS OEM batteries grew +106% YoY 1H17-18, beating the market by a wide margin
1. Gaikindo and AISI data
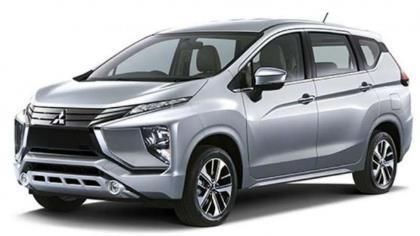
81 OEM 4W: Nipress is a trusted supplier to leading auto brands; with more
brands/models in the pipeline
NEO MARKET NOTABLE SELECTED MODELS
BRAND
SHARE1 (Market share in brackets)
Xpander Pajero Sport Colt diesel
90 % (100%) (100%) (100%)
Datsun GO+ Datsun
Datsun GO
100 % (100%) (100%) GO Cross
(100%)
Luxio GrandMax
10 % (50%) (50%)
Wagon R Futura
50 % (100%) (100%)
Glory 580 Glory 330 Supercab
100 % (100%) (100%) (100%)
10 % Travello
(50%)
Market share of 4W market is ~20%1
1. Most recent data
91 OEM 4W: Xpander became Indonesia’s #1 selling model in 1H18
After multiple years of holding the #1 spot, Toyota Avanza met a strong challenger with its
1H18 sales of 39,455 units being edged out by Mitsubishi Xpander’s 39,948 units
101 OEM 2W: Gaining market share after its launch in 2013; other ASEAN OEMs
also in pipeline
NEO MARKET NOTABLE SELECTED MODELS
BRAND
SHARE1 (Market share in brackets)
Next Address Satria FU
50% (100%) (100%) (100%)
Top 3 brands:
>90% 30%
Vega R
(100%)
Jupiter Z
(100%)
Mio, Fino,
X-ride,
Xeon
of 2W market (30%)
Vario non Beat
13% ISS (50%)
(100%)
Beneli PP
10% (50%)
Market share ~15%; currently in talks with OEMs in Malaysia and The Philippines
1. Most recent data
111 OEM 2W: Accelerated market share gains in 2018
Nipress market share in 2W OEM
(% of volume sold)
>15.0%
>6x
6,5%
2,4% 2,5%
Avg. FY17 Mar-18 Jun-18 Current
121 OEM: Strong gains in 2018 with more brands/models in the pipeline
Success in OEM will help drive growth in replacement
Nipress’ Automotive OEM Segment Sales
(IDR bn) Catalyst for future growth:
4W 2W • Growth of auto market;
vehicle ownership in Indo
• Success of Mitsubishi still low
Key accounts in Mitsubishi,
Xpander and Pajero • Nipress’ proven ability to
Yamaha, Honda completed
boosted 4W sales acquire strong models
testing and ramped-up orders
• Increased penetration in
Honda motorcycles CAGR YoY
85
15-17 1H17-18
2W NS OEM
16 70 Total +26% +106%
launched in ‘14
56 10 2W +98% +58%
53
4 5
34
69
7 59 4W +18% +117%
49 51
27
2015 2016 2017 1H17 1H18
132 Replacement: A bigger market, approx. 4-5x the size of OEMs
Nipress is the 3rd largest player in the space with potential for further gains
6M 36M
Annual battery demand1 Annual battery demand1
car battery motorcycle battery
30M 6M
Replace- Replace-
4.9M 1.1M OEM ment OEM
ment
battery battery battery battery
NS market share in 4W replacement: NS market share in 2W replacement:
~12% ~5%
Growth of NS-branded OEM will help boost future replacement sales as most buyers
opt for the same brand of batteries as those currently installed in their vehicles2
1. Estimate for FY17; 2. Nipress research
142 Replacement: Nipress tackles the replacement market with its NS-branded
and private-labeled batteries
Private-label: Nipress produces high NS-branded: Launched in late ‘15, NS-branded
quality batteries for notable brands batteries have been gaining traction
Distribution points
11 Jan-16 47 today
MALAYSIA JAPAN
GLOBAL BRAND INDIA 2017
2016 Late ’17 launched
2015
NS for
Launched 4W Building NS 2W and 4W
GLOBAL BRAND passenger; 1st to distribution commercial
offer official network
warranty
Growth focus is shifting away from Using its own brand, Nipress can capture a larger
private labels to NS-branded batteries portion of the value chain = higher margins
152 Replacement: Advantages of NS-branded batteries
Manufacturer official warranty
High durability and commitment to service Value for money
Up to
10%
lower price vs. leading brands
Trademarked technology1 First to offer manufacturer-
creates highly durable official warranty up to 18 Prices for NS-branded batteries
batteries that is more months, unmatched in the are up to 10% lower vs.
vibration-resistant with lower market (36 months to be leading brands
discharge rates launched)
1. Developed in partnership with Johnson Controls Intl (JCI)
162 Replacement: Building distribution network in FY16-17; adopted from JCI’s
successful models in other emerging countries
2015 2016 2017 2018
# of
distribution Dec ‘15 Dec ‘16 Dec ‘17 Jun ‘18 Sep ’18 Q4 2018
points 11 34 35 38 47 53
172 Replacement: Higher-margin NS batteries are expected to drive growth
Nipress’ Automotive Replacement Segment Sales
(combined 4W and 2W, IDR bn)
NS Private-label
Catalyst for growth in NS:
Gradual scale-up of • Boost from growth of OEM1
Focus shifting NS’ brand equity and • Strong product supported by ramp-up
towards NS distribution network of distribution network
343 CAGR YoY
314 326
15-17 1H17-18
226 Total +5% +17%
193
266 277
175 Private label -6% +16%
150
60 66 43 51 NS-branded NM +19%
(’15 negligible)
2015 2016 2017 1H17 1H18
1. Based on research, most buyers will opt for the same brand of batteries that is already installed in their car upon replacement
183 Exports: Nipress is an emerging player in the global battery space with
presence across 4 continents
Nipress’ Presence around the Globe
(FY17, volume)
Europe
3%
Other AsIa
9%
Middle east
20% Focus market
ASEAN
36%
Africa
25%
Malaysia = c. 80%
South America of ASEAN sales
7%
193 Exports: Decline in 1H18 due to tariffs on exports to Saudi; potential for
strong recovery going forward
Nipress’ Automotive Export Segment Sales
(IDR bn) Recovery potential from JCI’s
4W 2W network and Nipress’ regional
knowledge:
Won large contract in Saudi Arabia; • ASEAN markets for 4W
“introductory prices” to capture market at • International markets for 2W
the expense of margins
With JCI network, monthly orders
314 from Malaysia has doubled in
6,9 Changes in tariff policy in Saudi
279 276 makes pricing no longer attractive; 3Q18 (~30% contribution 1H18)
8,2 9,9 shift portfolio towards more
profitable markets
CAGR YoY
161 15-17 1H17-18
307 3,4
271 266 Total +6% -40%
96
4,4 2W -9% +26%
157
92 4W +7% -42%
2015 2016 2017 1H17 1H18
1. Tariffs imposed for Korean-sourced products in saudi (a certain % of Nipress’ materials are sourced from Korea)
20Agenda
Nipress: A leading player in Indonesia’s energy storage solutions
Automotive: Consistent market share gains
Industrial: Sole local producer of industrial lead acid batteries in Indonesia
Historical performance
Welcoming Johnson Controls: The global leader in automobile batteries
Growth plan
21Nipress’ industrial business (26% of total revenues)
Drag from gov’t budget cuts to off-grid solar farms; effect has largely bottomed-out
Renewable Energy Telco Others
Power storage for panels for
Standby power for BTS Traction, military and
off-grid solar farms, home
towers for outages other industrial uses
systems, street lights
Contribution to 27%
ind’l rev’n 1H18 (drop from 65% in 2016)
73%
Total indst’l
Revenue 1H18
-25% +15% +0.2%
YoY Gr.
YoY
Continued support of solar softer due to drag
Growth strategy Maintain and grow market share in telco, expand from r.energy
projects; focus on home
& recent trends traction (i.e. forklifts, tractors), maintain military client
systems and street lights
22Contribution from off-grid solar farms dropped from 65% to 27% as drag has
largely bottomed-out; growth upside from other segments
R. Energy Segment Sales Telco+others Segment Sales
(IDR bn) (IDR bn)
245 248 252
134
83 97 93 107
53 40
2015 2016 2017 1H17 1H18 2015 2016 2017 1H17 1H18
• Budget cuts starting FY17; Jan-18 federal gov’t • Telco GDP grew 10% CAGR ’15-17; as sole local
fully halted new off-grid solar farms in favor of producer (vs. imports), Nipress is well
roof panels1 (demand from regional gov’t and positioned to increase market share
replacement still remains)
• Spike in FY17 from large military orders of
• Drag from this segment’s decline has largely
~IDR80b Nov-Dec ’17; without these one-off
bottomed-out big orders the segment still grew by 33% CAGR in
’15-17
1. Supported by statement from Dir. General of Energy (bisnis.tempo.co/read/1047167/pemerintah-hentikan-proyek-energi-bersih-apbn)
23Agenda
Nipress: A leading player in Indonesia’s energy storage solutions
Automotive: Consistent market share gains
Industrial: Sole local producer of industrial lead acid batteries in Indonesia
Historical performance
Welcoming Johnson Controls: The global leader in automobile batteries
Growth plan
24Revenues: Grew 4.4% CAGR ’15-17 and 0.7% YoY 1H17-18
Potential for accelerated growth from NS and new export markets; reduced drag from r. energy
Nipress’ Total Revenues
(IDR bn)
Automotive Industrial
Positioned for mid-long term
4.4% CAGR ’15-17 and +0.7% YoY 1H17-18 mostly caused by: accelerated growth:
• Drag from r. energy – largely bottomed-out • NS brand: Strong growth of OEM;
• Exports rationalized to more profitable markets replacement riding on its tail
• Drag from r. energy bottoming out
Other sectors +21% CAGR ’15-17 and +26% YoY
• Potential of new markets with JCI
1.040 1.077
988
CAGR YoY
335 15-17 1H17-18
341 382
Total +4.4% +0.7%
534 538
Industrial -1.0% +0.2%
146 146 R.energy -42% -25%
742 Telco+others +61% +15%
646 658
388 391 Auto +7.1% +0.9%
OEM +26% +106%
Replacement +5% +17%
Exports +6% -40%
2015 2016 2017 1H17 1H18
25Gross profit: Shift towards more profitable business mix
Historical movement in margins mostly from changes in product portfolio
Nipress’ Gross Profit
Gross profit (IDR bn) Gross profit margin
Exit from Saudi and
1H17 margins were dragged down by low- shift towards higher-
300 24,0%
margin Saudi exports; compression slightly margin segments
offset by high-margin industrial orders in 2H17
250 18,5%
17,2% 17,7% 19,0%
15,5%
200 183 179 13,8%
167 14,0%
150
9,0%
95
100
74
4,0%
50
0 -1,0%
2015 2016 2017 1H17 1H18
26Profit trends: EBITDA margins moves inline with GP margins from ’16
Deleveraging from 1.0x DER in Dec-15 to 0.6x DER in Jun-18
Absolute value (IDRb) Profit margin
EBITDA 14,1% 14,9% 14,7%
12,7% 11,2%
Opex in ’15 high as % of
300 15%
revenues as new factory200 139 155 137
60 79 5%
came online; margin 100
moves in line with GP 0 -5%
starting ‘16 2015 2016 2017 1H17 1H18
PAT (norm. for FX)
Capital structure is 300 15%
deleveraged from 1.0x200 5,2% 5,2% 4,6% 6,1%
3,6%
DER in 2015 to 0.7x in 100 5%
51 54 49 33
2016-17 19
0 -5%
2015 2016 2017 1H17 1H18
PAT 300 15%
Some FX exposure 6,3%
200 3,1% 4,1% 3,8% 4,1%
comes from Nipress’ 5%
100 66 44
USD loans 31 20 22
0 -5%
2015 2016 2017 1H17 1H18
27Volatility in raw material prices and FX can largely be passed through
Lead, a global commodity traded in USD, is a key material comprising 50%-60% of COGS
Automotive Industrial
OEM Replacement Exports
Pass-through Pricing formula with
mechanism lead price + FX
for Lead component
All players exposed Pricing by-project
Pricing formula with to the same market with repricing
lead price + FX dynamics clause for signif.
component Market leader adjusts commodity
pricing inline with lead/FX movements
Pass-through n/a
mechanism Exports are
for USD transacted in USD
28Agenda
Nipress: A leading player in Indonesia’s energy storage solutions
Automotive: Consistent market share gains
Industrial: Sole local producer of industrial lead acid batteries in Indonesia
Historical performance
Welcoming Johnson Controls: The global leader in automobile batteries
Growth plan
29On 4Q18, JCI completed the acquisition of a 24.5% stake in NEO
Transaction with a mix of secondary and NEO’s EV was agreed at a value that is higher
primary shares than Nipress’ current trading EV
Enterprise value (IDRb) EV / EBITDA FY17
18,5x
4.000,000 19
3.500,000 17
24.5% Industrial business; 15
automotive fully carved 3.000,000 13
out to NEO 2.500,000 11
36% primary, 2.000,000 7,2x 9,0
64% secondary 75.5% 7,0
1.500,000 983 1.140
5,0
1.000,000
3,0
500,000 1,0
PT Nipress Energi Otomotif
0,000 -1,
(NEO)
Nipress EV as of NEO's EV
closing 11-Oct-18 from JCI tx
Deal proceeds of USD18m1 are paid in USD and Higher EV despite auto business only
will be used for capex and general corporate contributing ~70% and ~50% Nipress’ revenues
purposes and EBIT, respectively
1. Proceeds paid in USD
30About JCI: Global market leader in automotive batteries with minimum
presence in SEA
HQ in Ireland, listed on NYSE, present in over 150 countries, with >100
years of experience in the automotive batteries
Global leader in batteries by a wide margin, JCI, 1st place: GS-Yuasa, 2nd place
powering 1 of 3 cars in the world USD7.4b USD2.5b
auto battery sales FY17 auto battery sales FY17
~20% Market-leading profitability from proprietary closed-loop
EBITDA margins manufacturing, distribution and recycling system
(vs. Nipress’ 15%)
Relationship with notable OEMs around
the globe
31JCI has a track record of successes in emerging markets through JV and
organic growth
India: JV with Amara Raja Mexico: Inorganic growth China: Building VARTA
JV with Amara Raja in 1997, JV with IMSA in 1998, full Brought the notable
pioneered MF batteries in India; ownership in 2004; now the European brand to China in
consistent market share gains most recognized in Mexico 2006 and has carved a sizeable
vs. Exide, a dominant leader, to and South America market share
become the close 2nd
today
32Amara Raja: JV with JCI has been clawing market share from a dominant
player in India
Amara Raja vs Exide’s Revenue Growth
(% YoY)
Today Amara Raja trading
at 14x TTM EBITDA while
Exide at 8x
By 2003, Amara Consistently growing faster than Exide,
Introduce
Raja holds 6% market share grew to 22% Though Exide also
warrantied MF
batteries with JCI market share while gains market share
Exide’s share from small players,
Exide was a 82%
remains stagnant now a close 2nd with
dominant player
with 85% market 64% 35% market share
share 54% (Exide at 40%)
34% 32% 34%
49% 25% 23%
21% 17%
34% 16% 15% 13%
8% 10% 11%
26%
17% 20% 21% 17%
4% 15% 12% 12% 13% 15%
7%
-1% -1%
2001 FY3 FY4 FY5 FY6 FY7 FY8 FY9 FY10 FY11 FY12 FY13 FY14 FY15 FY16 FY17 FY18
Amara Raja Exide
33Deal rationale: Nipress as platform to break into ASEAN and 2W
1 • Opening new markets
• Despite its scale, JCI has minimum presence in SEA’s 4W and global 2W battery
space
• JCI’s global network + Nipress’ local knowledge = well positioned to enter new
markets
2 • Product and technology sharing
• High-durability batteries in partnership with JCI, enabled Nipress to become the
first to provide official warranty for lead-acid batteries
3 Best business practice (BBP) sharing
• World-class manufacturing, distribution, and warranty management practices
34Agenda
Nipress: A leading player in Indonesia’s energy storage solutions
Automotive: Consistent market share gains
Industrial: Sole local producer of industrial lead acid batteries in Indonesia
Historical performance
Welcoming Johnson Controls: The global leader in automobile batteries
Growth plan
35Expand domestic market share and penetrate new markets with JCI
Domestic market ASEAN 4W market International 2W market
Indonesia is exclusive to Sizeable opportunity in these markets:
Nipress, all JCI operations in • ASEAN car population estimated to be 3x Indonesia
Indo will be though Nipress
• Global motorcycle population at least 6x Indonesia; at
least a quarter of which in ASEAN
Leverage JCI’s best
practice learned from other Nipress to be used as platform to for JCI to join ASEAN tariff-
markets + Nipress local free zone; potential to be a regional manufacturing hub
knowledge
In 2H18, JCI assistance has already opened new clients in
Malaysia, doubling orders from the region
36Auto sales volume expected to reach 2.4x by 2021
Target for 4W Target for 2W
2017 +16% 2021 2017 +30% 2021
CAGR CAGR
1.5mn 2.7mn 1.8mn 5.0mn
batteries batteries batteries batteries
Key growth drivers:
• Recovery of auto market
• Increased market share of NS OEM, which will contribute to NS replacement market
• Additional gains from high durability NS replacements + ramp-up of best practice distribution
• New markets opened in collaboration with JCI
37Appendix
Selected P&L and Balance Sheet Items
                                                            14-17                     17-18
 In IDR bn                      FY15     FY16      FY17             1H17     1H18
                                                            CAGR                       YoY
 Income statement
 Revenue                        987.9   1,039.6   1,077.0   2.9%    533.7    537.5    0.7%
 % YoY                          -2.8%     5.2%      3.6%                     0.7%
 Gross profits                  182.7    178.6     167.4    -2.9%    73.7     94.9    28.7%
 % margin                       18.5%    17.2%     15.5%            13.8%    17.7%
 EBITDA                         138.9    154.5     136.7    -0.5%    59.6     79.0    32.5%
 % margin                       14.1%    14.9%     12.7%            11.2%    14.7%
 EBIT                            83.7    134.1     108.5    9.1%     49.9     54.1    8.3%
 % margin                        8.5%    12.9%     10.1%             9.4%    10.1%
 PAT                             30.7     65.7      44.1    12.9%    20.3     22.2    9.4%
 % margin                        3.1%     6.3%      4.1%             3.8%    4.1%
 Norm. PAT (ex forex)            51.4     53.6      49.2    -1.5%    19.3     32.8    69.6%
 % margin                        5.2%     5.2%     4.6%              3.6%    6.1%
 Balance sheet
 Total asset                    1,548   1,778     1,898      7.0%   1,804    1,882    4.4%
 Debt (interest bearing)         634     595       584      -2.7%    553      541     -2.3%
 Total equity                    609     843       880      13.0%    862      902     4.6%
 Key ratios
 ROE                            5.1%    9.0%      5.1%               4.8%     5.0%
 Debt/ Equity                   104%     71%       66%               64%       60%
 Debt/ EBITDA                    4.6     3.9       4.3                9.3      6.8
 Working capital days           127.9   121.2     116.5              92.6     91.0
   DSO                          119.0   111.2     111.1             113.0     112.2
   DIO                          106.7   103.1     102.3              98.8     102.7
   DPO                          -97.8   -93.0     -96.9             -119.2   -123.9

Note: Full year ending 31-Dec
                                                  39
You can also read