INAUGURATION Welcome and introductions - Busworld Latin America
←
→
Page content transcription
If your browser does not render page correctly, please read the page content below

INAUGURATION
Welcome and introductions
                            ›

                                1
Mr. Jan Deman
Director of the Busworld Academy
                                   ›

                                       2
Worldwide Bus sales 2010 - 2016
2016: A record year for bus sales with 364,000 (+8.1%) units sold.
2017: Policy distortions are likely to negatively impact bus
demand.
000's                                Volume     Growth Rate                          YoY
450                                                                                  20%

400
                                                                                     15%
350

300                                                                                  10%

250
                                                                                     5%
200

150                                                                                  0%

100
                                                                                     -5%
 50

  0                                                                                  -10%
        2008 2009 2010 2011 2012 2013 2014 2015 2016 2017 2018 2019 2020 2021 2022

                                                                                            3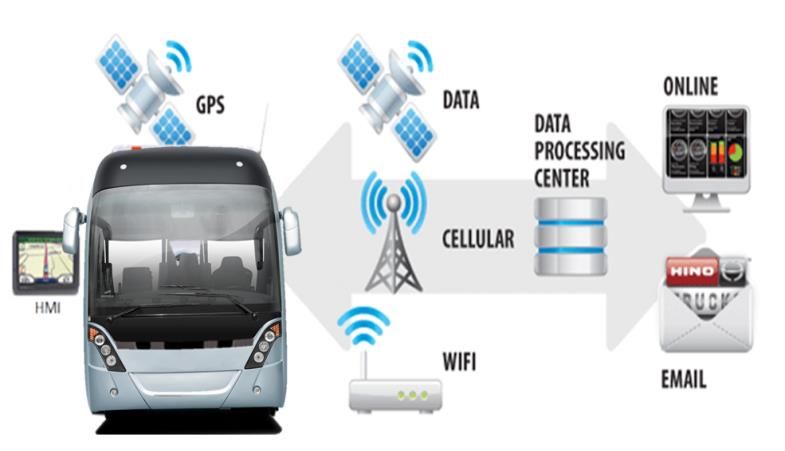
Worldwide Bus sales 2010 - 2016

000's
 32

 24

 16

  8

  0
        China    North    Europe   India   Rest of    South
  -8            America                     Asia     America

 -16

 -24

                                                               4
Worldwide Bus & Coach sales in
2015 - 2016

                                                          World              7.8%

                                                            Asia                         12.5%

 -27.8%                                          South America

                                                 North America                        11.1%

                                         -7.1%            Europe

-30.0%    -25.0%   -20.0%   -15.0%   -10.0%       -5.0%        0.0%   5.0%    10.0%           15.0%

                                                                                                      5
Worldwide Bus-sales in 2020
 000's
 20

 16

 12

  8

  4

  0
         India   China    South    Europe   Rest of    North
                         America             Asia     America

                                                                6
Mr. Cardona Gutiérrez
Minister for transport in Colombia
                                     ›

                                         7
Mrs. Jana Zikmundova
Ambassador of Belgium to Colombia
                                    ›

                                        8
Mr. Didier Ramoudt
President of Busworld International
                                      ›

                                          9
Keynote:
“ The Latin American Market for buses and coaches:
facts and figures
Mr. Hernan Cavarra, Industry Analist, Frost & Sullivan   ›

                                                             10
Brief Insights on the Latin
American Bus Market
Despite Headwinds Transformative Trends Expected to Propel LATAM Bus
Market to Over 48,000 Units
›
11Agenda – Our 15’ minute journey
Top Transformational Shifts and Urban transportation
LATAM Bus Market – Now and 2022, what´s next?
Conclusions, examples and a peek into the future
"A Developed Country is not a place where poor have cars. It's where the rich use Public
Transportation"
Enrique Peñalosa, Mayor of Bogota, Colombia
12Many times we ask what is happening around us…The
Red Queen Effect
13Top Transformational Shifts that will shape the Future of Mobility
Chinese OEMs
Multi-modality Mobility Integration Dedicated Road Lanes
Expansion
Transit Buses, Urban Smartphone-enabled Preference for Shared
Growing Market
Rail, and Taxis Seamless Commuting Mobility Models
Penetration
Source: Frost & Sullivan
Megatrends Influencing
Leveraging Big Data Electric Mobility Battery & Charging Tech the Bus Market
Fleet-readiness and Transit Buses will OEMs are Entering New Organization, Connectivity,
Meeting Peak Hour Pioneer the Zero- Markets and New Business Models,
Demand emission Drive Partnerships New Fuels of the Future
14Impact of Top Mega Trends on the Bus Market
Mega Trend Implications
Urbanization • Development of BRT systems expected to lead to foster
Heavy duty over 12m length city transit buses, leading to
further polarization of bus classes.
• There will be an increment in demand for natural-gas and
hybrid-electric buses by 2023.
• Urban population density growth will influence new bus
designs and usher the proliferation of HD transit city
buses.
Connectivity—Mobile Resource • Telematics will experience rapid proliferation, thereby
Source: Frost & Sullivan
Management elevating passenger transport efficiencies and resulting in
reduced commuting time and operating costs.
• Applications, such as prognostics, will deliver meaningful
total cost of ownership (TCO)-related value, Wi-Fi
connection, smartphones apps, track-and-trace systems,
fuel cost reduction, and security enhancement-focused
applications to deliver value in emerging LATAM markets.
15Impact of Top Mega Trends on the Bus Market
HD Transit Bus Market: BRT System, Global, 2015–2022
North
China/India
America
Source: Frost & Sullivan
Existing BRT with
expansion plans
New BRT systems in
Latin America
planning phase
16Key Influencing Trends
Policy Drivers BRT Status
• LATAM will need at least 2-3 years to recover Current 2022
from the economic crisis. Number of cities 67 108
• Mexico, Chile, and Peru will be the major growth
Number of corridors 209 335
drivers for buses until 2018.
• By 2020, 50,000 old buses are likely to be Length 1,813 km 3,050 km
replaced by new energy buses across LATAM’s
major cities.
Green Tech Incentives Intelligent Mobility Drive
Source: Frost & Sullivan
• Road tax exemption is in place in only a few • Being a BRT hub, LATAM will drive
countries for plug-in and electric buses. Colombia innovation and the mass adoption of IT
has earmarked $40 million for 2013 to 2017. services in transit buses and other mass
transit modes.
• EV buses are being tested in Sao Paulo, and
Mexico City and Argentina have called for an open • Investments will be made in ICT solutions
tender to acquire 400 EV buses for its national and upgrades to 4G/5G networks to reduce
BRT corridors. carbon footprint and augment wireless
CCTV access.
17Impact of Top Mega Trends on the Bus Market
Mega Trend Implication
s
• Natural gas to gain marginal penetration rate among various
New Fuels of the Future powertrain fuels in heavy duty buses, mainly in Mexican and
Peruvian bus markets and possibly Colombia as well although
with low crude oil prices, NG powertrain is not such an
interesting option and H&E gain future penetration.
• Hybrid and electric powertrain technologies to achieve
highest CAGR growth until 2022, and at an accelerated pace
thereafter thanks to BRT systems development.
• Diesel to continue as the most common fuel, representing
86.1% to 91% of all powertrain fuels in new Bus and Coaches
in 2022.
18Unit Shipment Forecast by Powertrain and Country
Total Bus Market: Unit Shipment Forecast by Powertrain, LATAM, 2016 – 2022
Optimistic Scenario
5.9% CAGR
40,0 ~ 48,446
~34,310
All figures are rounded. Source: Frost & Sullivan analysis
H&EV 35,0 2022 Regional Sales 0.5%
0.22% 4.1%
1.0% 30,0
4.8%
Diesel NG Gasoline Hybrid Electric 4.5%
1.2%
25,0
7.0%.
Units (000s)
20,0 8.0%.
.2.8%.
6.0%.. 7.0%.. 4.2% Diesel,
15,0
86.1%
4.0%.. 1.7%. 4.5%
Diesel, 0.5%
97.6% 10,0 4.5%
15.0% 0.5%. 2.0%
85.0% 1.0%
5.5%
5,0 0.5% 8.5%
75.0%
90.0% 91.5%
97.3% 78.0%
0,0
2016 Arg Bra Mex Chi Peru Colombia 2022
19Unit Shipment Forecast by Powertrain - LATAM
Total Bus Market: Percent Unit Shipment Forecast by Powertrain, 2016-2022
Electri
c 100% 10,0%
0.01%
Gasoli 98% 9,0%
ne; 90%
Diesel 93%
1,0%
All figures are rounded. Source: Frost & Sullivan analysis
8,0%
97.6% 86%
80%
Hybrid 7,0%
; 0,2%
Powertrain Share
NG; 70%
6,0%
Powertrain Share
1,2% 5,25%
60% 5,0%
CAGR 5.9%
4,08%
4,04% 4,0%
50% 3,00%
NG; Gasolin 3,0%
4,1% e, 0.5% 40% 2,50%
2,50% 2,0%
Hybrid,
4.5% 30% 1,17%
0,49% 1,0%
Diesel; 0,97%
86,1% 0,21% 0,75%
Electric 20% 0,01% 0,0%
; 4,8% 2016 2019 2022
Year
Diesel NG Gasoline Hybrid Electric
20Unit Shipment Forecast by Powertrain and Country
Total Bus Market: Unit Shipment Forecast by Powertrain, LATAM, 2016 – 2022
Pessimistic Scenario
~ 48,446
5.9% CAGR
0.5%
40,0
~34,310 4.6%
All figures are rounded. Source: Frost & Sullivan analysis
H&EV 35,0 2022 Regional Sales 2.0%
0.22%
1.8%
1.0% 30,0
1.2% Diesel NG Gasoline Hybrid Electric
25,0 3.0%.
Units (000s)
4.0%.
20,0 .0.5%.
3.0%.. 1.5%.. 1.5% Diesel,
15,0
91.2%
2.0%.. 2.0%
Diesel, 1.0%. 0.5%
97.6% 10,0 1.5% 15.0%
93.0% 0.5%. 2.0%
4.0%
2.0%
5,0 0.5% 8.5%
80.0%
96.5% 93.5%
98.0% 86.0%
0,0
2016 Arg Bra Mex Chi Peru Colombia 2022
21Electro-mobility and buses – the need?
HD Transit Bus Market: GHG Emission in Transportation, Global, 2015
160
GHG Emission (gm/passenger km)
140
120 80 gm
100
80
60
40
20
Source: IPCC, Frost & Sullivan analysis
0
Car (Gasoline)
Car (Diesel)
Scooter (Four-
Bus (Hybrid)
Bus (Electric)
Scooter (Two-
Minibus (Diesel)
Bus (Diesel)
Rail Transit
Bus (NG)
Car (Electric)
Stroke)
Stroke)
Public transit systems rank as being the most efficient in terms of GHG emission per
passenger-km. Transit buses adopting green powertrain technologies is a significant step
toward a sustainable public transit system.
22Powertrain Outlook
Total Bus Market: Powertrain Standard Overview, LATAM, 2016–2022
Powertrain
Region
Diesel/Biodiesel NG Gasoline Hybrid Electric
Market in 2015 High demand in 2022 Moderate demand in 2022 Low demand in 2022
H&E= Hybrid and Electric
23Snapshot of LATAM Bus Market in 2022
% denotes the 2022 forecast of regional share in the LATAM bus market.
Total Bus Market: Unit Shipment Forecast, LATAM, 2022
Mexico Colombia
All figures are rounded. Source: Frost & Sullivan analysis
~ 11,000 ~ 6,400
[ 2.3% ] [ 6.5% ]
Peru
~ 3,676
[ 1.6% ]
Brazil
~ 19,070
Chile [ 9.2% ] Electric and Hybrids
powertrains Sub-
Total LATAM Bus ~ 3,300 segment
Market [ 5.0% ]
~55 Unit
~34.3 (000) in Argentina in 2016 [ 0.1% ]
2016
~ 5,000 115%
5.9% [ 7.0% ]
~5.4 (000)
~48.5 (000) CAGR in 2022 [ 9.3% ]
in 2022 %
24Partial Matrix of OEMs and Powertrain
Total Bus Market: OEM Powertrain Standard Overview, LATAM, 2015-2022
• Most of the major OEMs operating in 2016-2019
LATAM sell hybrid and plug-in hybrid
2016-2017
buses in their respective domestic
2016-2022
markets.
All figures are rounded. Source: Frost & Sullivan analysis
• Product launches and mass adoption
will happen post 2020 as limited funding
and incentives are likely in the short
term due to the economic crunch.
Current
Diesel NG/Biodiesel Hybrid Plug-in Fully Electric
Powertrain
25Impact of Top Mega Trends on the Bus Market
Mega Trend Implication
s
• Platform-based production is a key phenomenon associated
with globalization. It provides cost optimization benefits during
New Business Models product development and enables the fulfilment of dynamic
end-user preferences.
• OEMs and suppliers to explore opportunities with dedicated
“value” bus models to penetrate and expand in emerging
markets.
Source: Frost & Sullivan
• Greater European OEM focus on creating value bus brands for
the mid-segment market while Chinese OEMs will focus on low
cost offering and new fuels and powertrains options.
• Soft technologies (e.g., telematics, safety, data analytics) will
emerge as major growth strategy model ingredients for OEMs
and suppliers.
26SWOT Analysis
• Expanding BRT Systems • Economic and political
fueled by national crisis characterized by low
governments GDP and lack of
• New emission regulations governmental investments
being adopted to adapt to in public transport
developed markets • Lack of well-developed
technologies Strengths Weaknesses INFRASTRUCTURE In
• Underdeveloped HD Chile, Peru, and Argentina
market niches in Chile for EV units introduction
and Peru
• Lack of developed urban • Energetic crisis in
and inter city trains and Argentina undermines EV
railways market development
• Expanding mega cities Opportunities Threats • Development of subway
needing well developed lines in main LATAM
transport systems cities
• Low-cost Chinese OEMs • Political and economic
focusing on LATAM market and crisis in Brazil will push
establishing production sites the market down until
• New taxation reforms to fuel 2019
hybrid and EV bus introduction.
27Chinese OEMs Expansion in LATAM Bus Market
Total Bus Market: Market Share by OEM, Total Bus Market: Market Share Forecast by
LATAM, 2016 OEM, LATAM, 2022
Yutong BYD Other
3,0% 1,0% Chinese Others
Other Others 1,5% 1,7%
Yutong Chinese
0,4% 5,9% GM
5,4% HINO
3,5% 5,5%
HINO
3,3% GM
4,5% Hyundai
2,0%
Hyundai
Internation
1,8% MB al
Internatio 42,2% MB
3,5%
Source: Frost & Sullivan
nal Dina 42,5%
4,2% 4,0%
Dina
Agrale
4,0%
4,8%
Agrale
4,2% IVECO MAN/VW
MAN/VW 2,5% 10,5%
IVECO 9,3%
2,5% Scania Volvo
6,9% 5,2% Scania Volvo
6,0% 8,0%
Frost & Sullivan predicts that Chinese OEMs will experience steep growth in the select LATAM bus
market mainly fueled by low cost portfolio offering and Electric powertrain advanced development
28OEM Performance in 2015
Total Bus Market: Unit Shipment by Key OEMs, LATAM, 2016
0 2.000 4.000 6.000 8.000 10.000 12.000 14.000 16.000
All figures are rounded. The base year is 2015. Source: Frost & Sullivan
Mercedes-Benz
MAN / VW
Scania Daimler is expected to increase it portfolio offering
with value bus options to compete with the Chinese
Volvo low-cost offering strategy as well as less than 12
meters buses in Colombia.
Agrale
While Volvo is expected to lead the electric bus drive, other
Yutong European OEMs are expected to catch-up quickly with slew of
product launches and alternative powertrain options such as
Chinese natural gas in Mexico and Peru.
International
DINA The launch of electric and hybrid buses, the increasing
export footprint, and domestic production sites
Hyundai investments in Brazil and Mexico are expected to bolster
Chinese OEMs’ brand strength, being BYD the current
GM flagship and Yutong the biggest.
Brazil Argentina Mexico Chile Peru Colombia
29Bus Attribute Focus of OEMs
Total Bus Market: Technology Outlook by Sub-segment, Trend in Trend in
LATAM, 2016–2022 2016 2022
Electrification and Hybridization
Next Generation Powertrain
Technology
Safety Systems
Comfort and Convenience Features
Source: Frost & Sullivan analysis
Vehicle Connectivity
Vehicle Customization
Price Sensitivity
1 2 3 4 5
Low High
Low Moderate Strong
HD Transit MD Transit MD Inter City HD Inter City Trend Trend Trend
30Case Studies: Colombia - BRT
Before Now
Cities are consolidating organized public
1:1 Market Cooperatives 1
transport systems. Organized masive
man = 1 bus. Disorganized, no
transport systems BRT,
fixed routes, no fixed fares.
«alimentadores», fixed routes and fares.
Challenges fot BRT
• Error in passengers estimates
• No government subsidies
• Illegal transport (moto-taxismo)
• Private operators bankrupcy
• Robust regulation regarding safety,
certifications, accessibility
• Problems with supply chain (tires, OEMs
service and spare parts
31Case Studies: Colombia - BRT
• Strong government measures againts illegal transport
• Regulate a well price structures scrapping program for used
buses
• Create Government subsidies like in Chile, Argentina or Europe
Possible since the system is not self-sustainable with the ticket prices
Solutions?
• Regulate routes so as to avoid cannibalization between BRT and
traditional buses lines and create harmonization between BRT
and «alimentadores» (feeder buses).
• Invest in INFRASTRUCTURE in those cities where its still
defficient or there are lack of covered rooutes (Ex.
Bucaramanga)
32Case Studies: Colombia Market
• In Colombia there are 2 types of markets:
o Traditional (mainly feeders market, Buses of 12 mts and less) that mantains
stable in 2,500 to 2,600 units per year (urban and inter-municipal) that has a
natural renewal every year ans is more stable . Operator can buy up to 10 units
and there are growth perspectives.
o BRT (Sistemas Integrados – Transmilenio, Transcaribe, MIO, etc): Articulated,
Bi-articulated, HD buses mainly. They are undergoing a crisis, with private
operators in bankrupcy or owing large amounts of money to banks, financial
institutions and supply chain. They are in need of fleets renewal and instead of
growth, renewal of units is more probable BUT Changes are needed. Cycles of
renewal are of 5 years in average and is more volume sale for OEMs.
• Market is often impacted by GDP variations and regulations (such as safety) that
determine units sales. Small cities are good market niches for Traditional market
while BRT is only possible in big cities with big avenues and infrastructure due to
turning radius, bus volumes, etc.
33Case Studies: Colombia Market
• Regarding powertrains and fuels future market Diesel will remain dominant in
Colombia although is a regional benchmark in Hybrids and EV buses.
• Colombia demands Euro IV fuels at a national level although Transmilenio demands
Euro V and Medellín is moving towards that goal due to emission issues.
• NG was an option 2 years ago and even GM launched a unit with this powertrain
but due to NG rising costs and crude oil low prices, its not so attractive. Also NG can
only be utilized on fixed routes (due to lower autonomy) and demands big
infrastructure investments for recharging. So…Its NG an actionable option?
• Hybrids and EV are also being studied for the BRT systems replacement but again
infrastructure for recharging stations and also higher units prices and service are big
challenges.
• Long Distance Bus Market is an interesting market niche with good potential due to
peace negotiationn with FARC that permits safer journeys Low Cost flights
competition is only a challenge for less than 500 kms distances. Important:
Entertainment systems and comfort.
34LATAM
• Stable urban MD (less than 12mts) market (2,800 – 3,000 per year) with natural
renewal cycle every 5 to 6 years to mantain low TCO.
• Long distance makret in crisis since they lost subsidies to diesel and disabled
passengers.
• 2013 and 2014 peak sales are almost impossible to obtain again. It was due to
excess of liquidity (FINAME) Soft credits, low taxes and long payment terms
More parc than demand.
• It need to solve first it political and economic crisis. Market will grow by
2018-2019 thanks to fleet renewal needs mainly.
• Between 2019 and 2022 growth will be experienced in Mexican market pushed
by units renewal and introduction of NG, Hybrids and Eletrical powertrains for
BRT lines mainly in main Mexican cities (DF, Monterrey, Guadalajara, etc)
• Worst scenario Only 1 BRT line in Lima*, but there is a big challenge in terms
of informality, lack of regulation in routes and tickets prices.
• Between 2018 and 2019 EURO IV emission standards are going to be
implemented in Peru and fleet renewal will push sales.
• Possible EV buses implementation.
35Key Predictions
The Bus Market will experience will account for about 48,500 units by 2022 reaching a
5.9% CAGR growth for the 2016-2023 period. Although BRT systems development across
the region will be pushing the market, the MD segment will be of great importance and
account for most volume sales due to regional countries cities geographies and
topography.
Although Brazil and Mexico will be leading the market in terms of units sales,
Colombia, Argentina and Chile will experience the highest growth in the overall
market, growth by 2022. Peru will be LATAM’s second-largest MD market while Chile will
be LATAM’s third-largest inter-city market and Argentina the third largest in the transit
segment by 2022.
While European OEMs will continue to dominate the market with Mercedes-Benz
dominating the overall bus market in each of the studied countries, Chinese OEMs
could increase their market penetration (mainly BYD and Yutong), pushed by the
development of H&E (BEV and PHEV) transit buses for the growing BRT systems in the
region and the establishment of overseas production units, either through subsidiaries or
acquisitions. Volvo & GM also could grow thanks to its electric and NG powertrain bus
development but AGAIN INFRASTRUCTURE is the key word.
36The Red Queen effect
37That is that for today, thank you for your attention
Hernán Cavarra
Sr. Industry Analyst
Intelligent Mobility – Automotive & Transportation
Direct: +54 11 4776 8069
Email: hernan.cavarra@frost.com
38Programme
11:30 – 12:30 Reception
14:30 – 17:00 Manufacturers Debate: Future
trends
Zhengzhou Yuton Bus, Volvo Bus, Yellow Window, Voith Turbo
39You can also read