Measurements and Observations of Fracture Height Growth - Norm Warpinski
←
→
Page content transcription
If your browser does not render page correctly, please read the page content below
Measurements and Observations
   of Fracture Height Growth

                      Norm Warpinski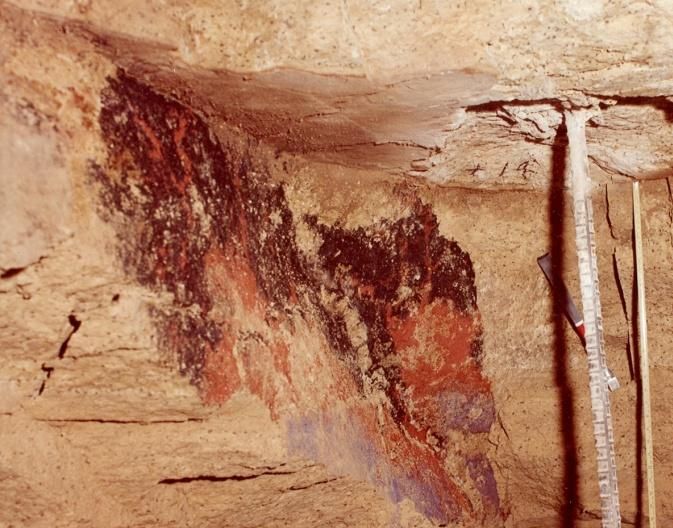
Fracture height growth in sedimentary rocks
Example Mesaverde section:
Clear understanding from sandstones interbedded with
minebacks, cores, lab tests, mudstones and stiltstones
diagnostics, and numerical Mudstone & siltstone layers
studies
Sandstone
Layered sedimentary
sequences restrict vertical
Mudstone & siltstone layers
fracture growth
Reduced width in high stress & Sandstone
high modulus layers
Inefficient fracture growth
vertically across layers and
Mudstone & siltstone layers
interfaces
© 2011 Halliburton. All Rights Reserved. 2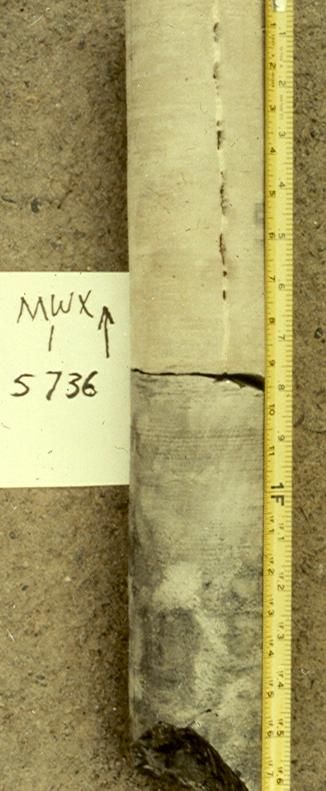
Observations: Minebacks & Core
Fractures offsetting and
splitting at natural fractures
DOE hydraulic fracture
mineback experiments at Termination
at interface
the Nevada Test Site 2 fractures
Government funded
research into hydraulic
fracture behavior
Cored fractures from the Complex
DOE Multiwell experiment & Similar to
mineback
fracture with
DOE/GRI M-Site natural horizontal
fractures component &
Mineback tests in coal in core multiple
strands
Core in MWX test at Weak interface
~7100 ft showing
~30 fracture strands
in a hydraulic
fracture
Weak interface terminating
growth in a mineback test
© 2011 Halliburton. All Rights Reserved. 3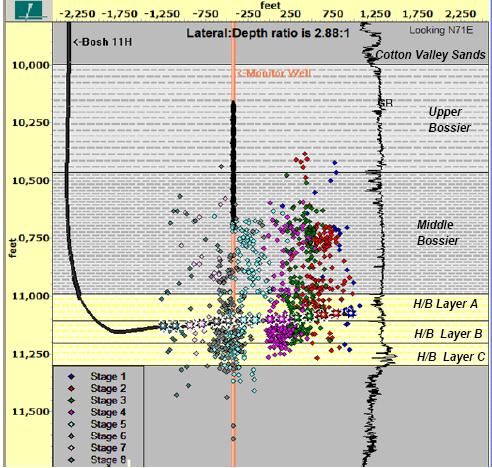
Stress contrasts 4000
GR 2,000 psi
stress
Stress profile measured at DOE
4500
contrast
MWX test 5000
Most comprehensive
anywhere 5500 Lithostatic
(1.07 psi/ft)
Large variations in stress from
6000
Depth (ft)
layer to layer
Correlates well with lithology
6500
Stress contrasts restrict vertical
growth 7000
High stress may terminate 7500
fracture
Low stress zones “trap” 8000
fracture – extensive lateral Reservoir rocks
Non-reservoir rocks
growth 8500
0 2000 4000 6000 8000 10000
Stress (psi)
Source: DOE Multiwell experiment & DOE/GRI M-Site test
© 2011 Halliburton. All Rights Reserved. 4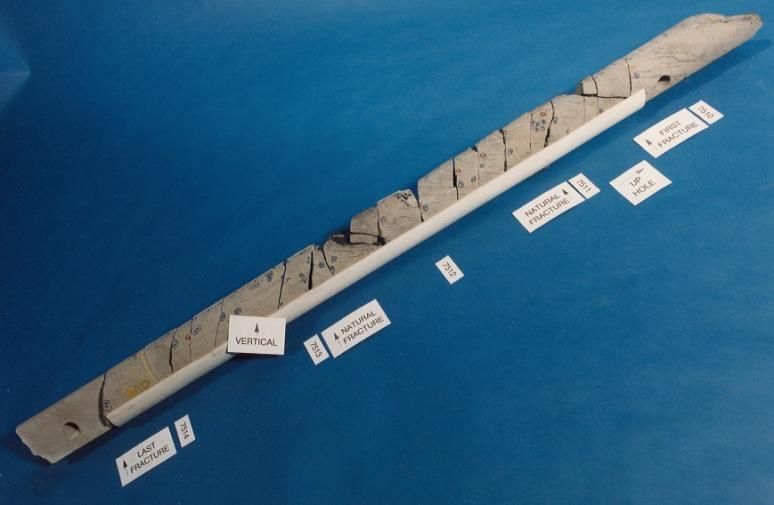
Offset -Well Microseismic Mapping
• Microseismic Monitoring
  Is Applied Earthquake
                                           Treatment Well                        Observation Well
  Seismology                                    Observation Distance
  (Seismology 101)                                                                   Recorded Events
    – Based On
                                                Depends on Seismic Attenuation
      Principles Known
      For Decades
    – Has Been Used                                Typically 12-3C Level @ 15M
      Since Mid-1970’s
      (Hot Dry Rock)
    – Primary Difference
      Is The Use Of A
      Downhole Array

                   Perforated
                     Interval

© 2011 Halliburton. All Rights Reserved.                      5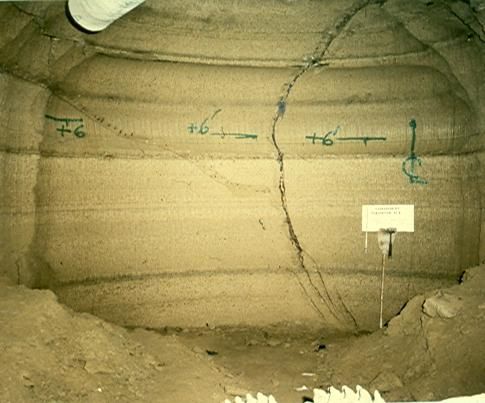
Microseismic validation: DOE/GRI M-Site
M-Site diagnostics laboratory: validation of microseismic data using
tiltmeters and intersection wells
Azimuth 4000
Monitor well:
Wellbores Gamma Ray Tiltmeter heights cemented-in
4200 receivers
Height C sand
Tiltmeters 4400
Intersection
B sand
Length
Depth (ft)
wells
4600
Wellbores Microseismic data
4800 600
A sand Wireline receivers
400
Northing (ft)
200
5000 Monitor well: 0
Cemented-in receivers
wireline -200
Intersection wells
receivers -800 -600 -400 -200 0 200 400 600 800
5200 Easting (ft)
-800 -600 -400 -200 0 200 400 600 800
Lateral distance along fracture azimuth (ft)
Source: DOE/GRI M-Site test
© 2011 Halliburton. All Rights Reserved. 6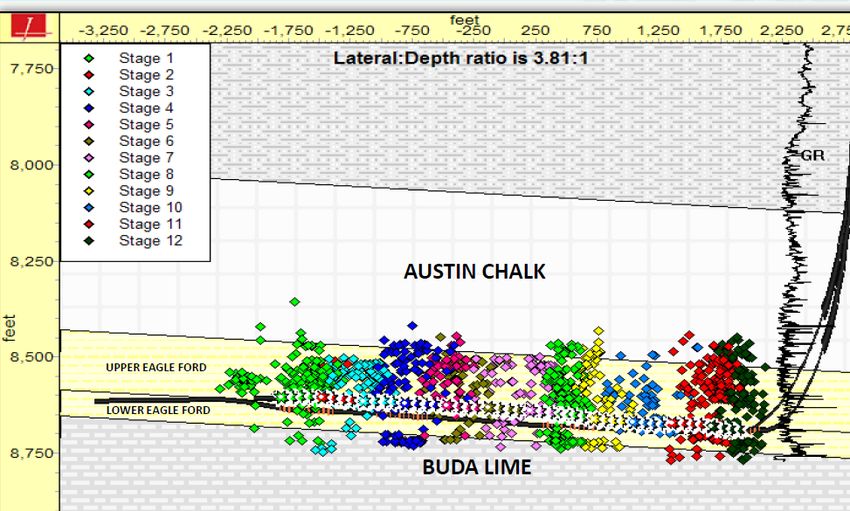
Fracture height growth SPE 125079 GMX Resources
Microseismic examples that show the
extent of height growth in various
formations 600 ft
Haynesville
Marcellus
Eagle Ford
Haynesville Example
Eagle Ford Example Marcellus Example
900 ft
SPE 131783,Curry et al, 2010
DUG Conference, 2010
© 2011 Halliburton. All Rights Reserved. 7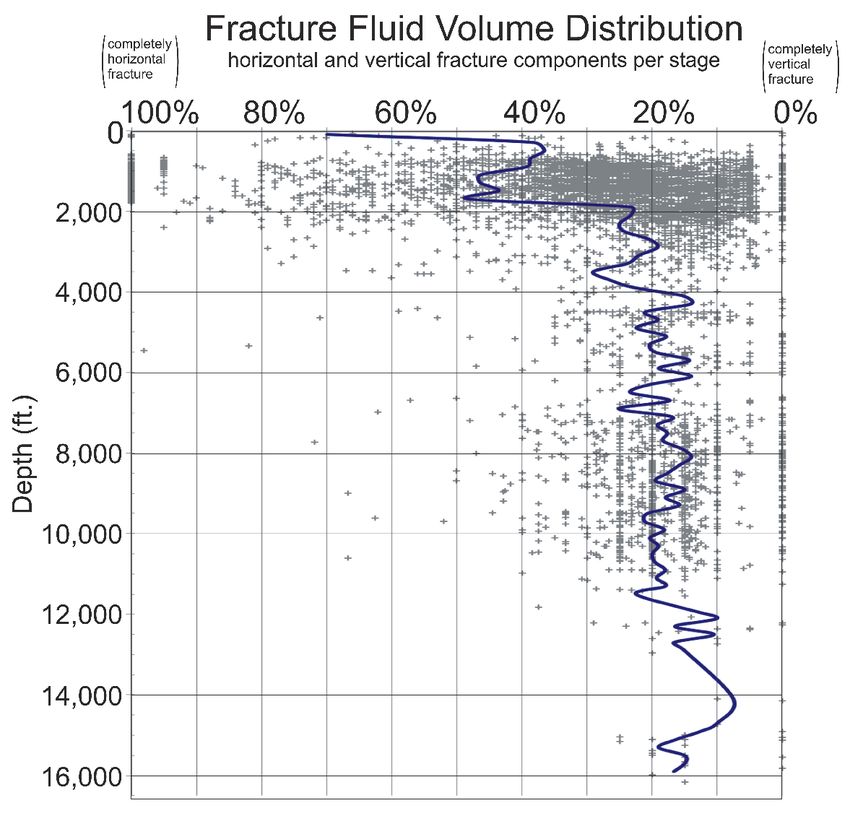
Mapped microseismic height for Barnett shale
Top: shallowest microseism; Bottom: deepest microseism
Aquifers: USGS deepest water wells by county
Fisher: American Oil and Gas Reporter, July 2010
© 2011 Halliburton. All Rights Reserved. 8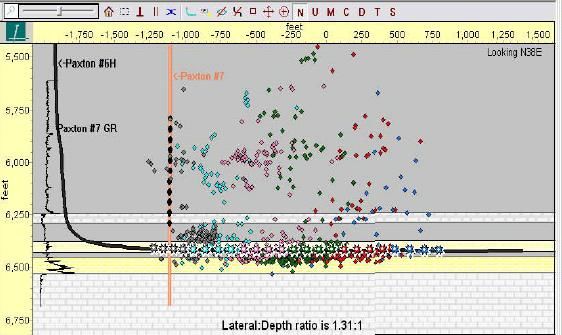
Mapped microseismic height for Woodford shale
Top: shallowest microseism; Bottom: deepest microseism
Aquifers: USGS deepest water wells by county
Source: Kevin Fisher, personal communication
© 2011 Halliburton. All Rights Reserved. 9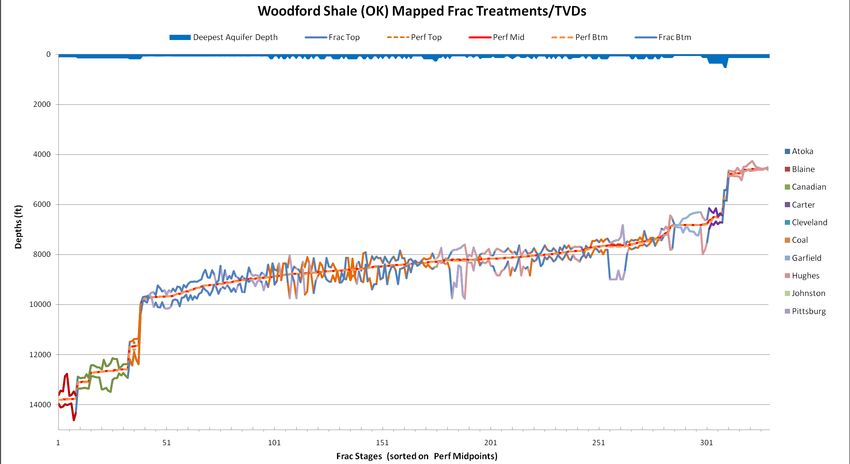
Mapped microseismic height for Marcellus shale
Top: shallowest
microseism
Bottom: deepest
microseism
Aquifers: USGS
deepest water wells by
county
Marcellus
Fractures far from
mapped aquifers
Fisher: American Oil and Gas Reporter, July 2010
© 2011 Halliburton. All Rights Reserved. 10Intersection with faults
-0.5
Faults
-1
Microseismicity is an excellent tool to -1.5
Typical
Moment Magnitude
Barnett Shale
monitor what happens when a fault is Maximum
Amplitude
-2
intersected by a hydraulic fracture Viewing
Limit
-2.5
5800
Horizontal well -3
6000 Shale -3.5
interval Biased Data
Bias Line
Normal size
-4
6200 microseisms
0 200 400 600 800 1000 1200
Depth (ft)
Distance (m)
Out-of_zone
6400 growth
The magnitude-distance
plot shown above is an
Magnitude
important diagnostic tool
6600 Large fault scaled by for assessing data results,
microseisms width of
marker
effects of noise, bias, and
viewability. It is also useful
6800
for determining whether
-300 -100 100 300
fault interactions have
Fracture edge-on view (ft)
occurred.
© 2011 Halliburton. All Rights Reserved. 11Tiltmeter Fracture Component Breakout versus Depth
Tiltmeters readily
identify fracture
components
Horizontal
Vertical
Dipping
Combined
Rapid increase in
horizontal
components at
shallow depths
preclude vertical
growth
Source: Kevin Fisher, personal communication
© 2011 Halliburton. All Rights Reserved. 12Summary
Data from thousands of fractures show:
No extensive growth vertically
Increase in horizontal components at shallower
depth (little vertical growth)
Sedimentary features restrict vertical fracture growth
Very inefficient growth across layers
Alternating properties and stress
Interfacial properties
© 2011 Halliburton. All Rights Reserved. 13Measurements and Observations of Fracture Height Growth
Norman R. Warpinski
Pinnacle – A Halliburton Service
The statements made during the workshop do not represent the views or opinions of EPA. The
claims made by participants have not been verified or endorsed by EPA.
Hydraulic fracturing is a process that is necessary for economic extraction of natural gas and oil
from unconventional resources such as tight gas sands and gas shales. It is a process that is well
understood in its overall behavior and development, but is difficult to quantify in many of the
details because of both geologic and mechanistic uncertainty. For example, fine details of the
layering are impossible to resolve using the borehole tools available today, and features
between wells are difficult, if not impossible, to distinguish unless their scale is extremely large.
The mechanistic uncertainty follows from the poor description of the reservoir and the geologic
features within, but also from the computational difficulties associated with a complex
interaction problem in a heterogeneous material.
Nevertheless, thousands of papers have been written in the petroleum literature to study
hydraulic fracturing, and these have provided a wealth of understanding about the behavior of
fractures in different environments. These papers have provided field evidence, mineback and
coring evidence, laboratory testing, analytical models, numerical models, and a host of other
results that have guided the understanding, development and optimization of the fracturing
process. What we may be missing in the fine details can be accounted for in overall generalized
findings about the fracturing process.
Geology, Geology, Geology
It should be obvious from the literature that we
only have a limited ability to direct fracture Complex
mineback
growth; Mother Nature does not let go easily.
fracture with
The best example is fracture azimuth (the horizontal
direction a fracture propagates), which is component &
dictated by the in situ stress that exists at the multiple
hydraulic fracture location and is very difficult strands
to alter. Fractures will propagate in the same
direction all across a field. A second general
finding is that the layered earth sequence
makes vertical fracture height growth difficult,
thus generally promoting the growth of length
over height. Height growth is inefficient due to
the variable layer properties, the large number
Figure 12. Mineback photograph of complex
of interfaces, the rapidly varying stress that can
fractureoccur vertically, and the potential for a large number of energy-dissipative mechanisms that can
occur in such an environment.
Figure 12, for example, shows a mineback photograph of a hydraulic fracture that has very
complex behavior that is largely due to geologic
factors, such as the stress state at this location and
the interfacial properties. Fractures are not single
planar features that extend long distances; they
are a series of interconnected fracture segments
that have many internal terminations and
interactions with the local geologic conditions
(Warpinski and Teufel 1987).
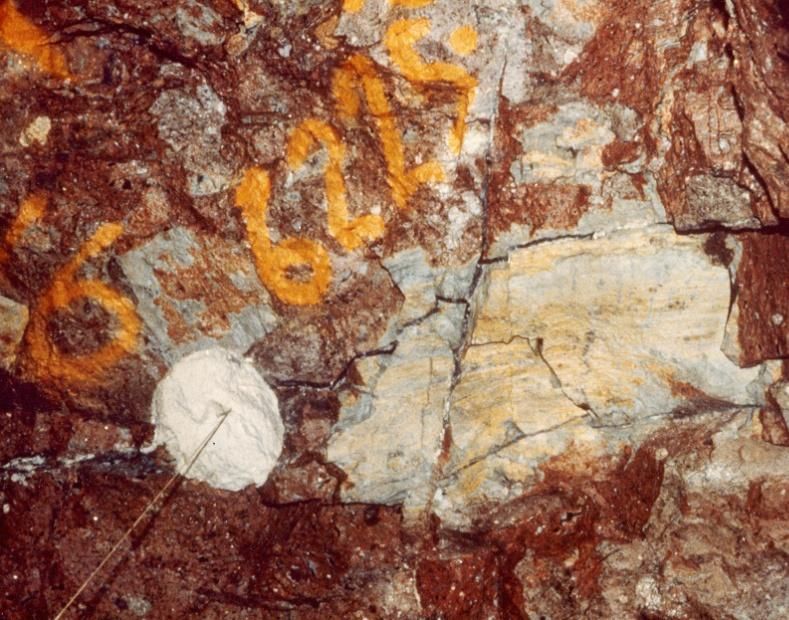
Figure 13 shows a second example of the
complexity that can occur as hydraulic fractures
intersect natural fractures and other geologic
discontinuities (e.g., interfaces). There are many Figure 13. Mineback photograph of offsets
offsets and some splits that occur as part of this & splitting.
interaction process, the details of which are largely
driven by the local stress state and the material
properties in conjunction with the treatment 4000
GR 2,000 psi
conditions. In many instances, natural fractures, stress
4500
faults, and interfaces have been observed to contrast
terminate fracture growth, thus providing a complete
5000
containment feature.
5500 Lithostatic
The in situ stress has a dominant role in all of these (1.07 psi/ft)
processes, but also directly affects vertical hydraulic 6000
Depth (ft)
fracture growth. Fractures are impeded from growing
vertically by higher stress layers. This might appear to 6500
be an unusual case because stresses decrease as the
7000
depth becomes shallower, but measurements have
shown that large stress contrasts exist in sedimentary
7500
basins at all depths.
8000
Figure 14 shows an example of the results from a Reservoir rocks
Non-reservoir rocks
stress measurement program at the DOE funded 8500
0 2000 4000 6000 8000 10000
multi-well experiment in the Mesaverde formation Stress (psi)
located in the Piceance basin (e.g., Warpinski and Source: DOE Multiwell experiment & DOE/GRI M-Site test
Teufel 1989). The stress measurements made in
reservoir rocks (sandstones) are shown in blue, Figure 14. Measured stress profile in
whereas the non reservoir shales, mudstones, and Mesaverde.
siltstones are shown in red. The stress contrasts areoften in the range of 1,000 – 2,000 psi. While the overall trend is one of decreasing stress with shallower depth, the large variations make it unlikely that fractures would grow very far across such a section. Fractures that grow out of zone and propagate vertically upward would quickly hit another low stress layer and tend to grow laterally in it. Should the pressure overcome the next higher stress layer above it, then the fracture would grow and again hit a lower stress layer, and also result in preferential lateral growth. Repeated crossing of these layers is an inefficient process that soon uses up the fluid and energy. All of these processes and mechanisms have been verified in laboratory testing and modeling. We now have the laboratory equipment to study layered and fracture rocks and the computational tools to study fracture behavior in a discontinuous medium. As noted above, the exact details may be difficult to determine because of the poor understanding of the geologic details, but the overall behavior is very clear. Diagnostics Tell the Story While all of the mechanisms discussed above provide the understanding of what is occurring as fractures propagate, it is the advent of far-field diagnostic technologies that have given us a full picture of the propensity of fractures to propagate laterally. Although tiltmeter deformation measurements have been applied more often and longer, it is microseismic technology that has been the most revealing. Microseisms are small earth movements that occur in the vicinity of a hydraulic fracture due to inflation of that fracture and leakoff of high pressure fluid into the formation. These two mechanisms cause changes in both stress and pressure that can induce complex shear slippage processes. These microseisms emit seismic energy that can be detected at receiver arrays located in adjacent wells, and the waveform data, in conjunction with a velocity model, can be processed to extract microseismic locations. The sum of these locations yields a map of where the activity is occurring which describes the fracture. One common question is that of validation. How can we be sure that the microseismic data is representative of the true fracture behavior? The answer to that question is in the results from several validation experiments, the most extensive of which was the DOE/GRI funded M-Site test in Colorado. (Warpinski et al. 1998) Figure 15 shows a side view representation of the testing results from M-Site, in which several approaches were taken to verify the microseismic data. There were two monitor wells with seismic receivers to capture microseismicity, but there were also tiltmeters cemented in place in one of the wells to measure the earth deformation and compare the mechanical behavior with the microseismic behavior to verify fracture height. In addition, intersection wells were drilled to verify fracture azimuth and examine the fractures in core or with imaging logs, but one of those intersection wells was drilled prior to fracturing and instrumented with pressure gages. During fracturing, the time at which the hydraulic fracture intercepted this well could be determined by an observed increase in pressure, thus providing a fracture length at that time which could be compared to the microseismic length. All parameters – length, height, and azimuth – exhibited close agreement between the microseismic results and the verification technologies.
4000
                                                                                                             Monitor well:
                              Gamma Ray            Tiltmeter heights                                         cemented-in
                    4200                                                                                     receivers
                                          C sand

                    4400
                                                                                                                                                         Intersection
                                              B sand
       Depth (ft)

                                                                                                                                                             wells
                    4600
                                                     Microseismic data
                    4800                                                                                     600
                                             A sand                                                                                                  Wireline receivers
                                                                                                             400

                                                                                             Northing (ft)
                                                                                                             200
                    5000                                   Monitor well:                                       0
                                                                                                                       Cemented-in receivers
                                                           wireline                                          -200
                                                                                                                                                                Intersection wells

                                                           receivers                                                -800   -600   -400   -200        0         200   400   600    800

                    5200                                                                                                                        Easting (ft)

                           -800     -600            -400        -200         0         200                                 400                           600                     800
                                                   Lateral distance along fracture azimuth (ft)
                                                               Source: DOE/GRI M-Site test

    Figure 15. Overview of DOE/GRI M-Site hydraulic fracture diagnostics field test
    site.

While only a very limited number of industrial fracture monitoring projects have been
published, there are many thousands that have already been done and these provide a
comprehensive record of the behavior of fractures in these sedimentary environments. Figure
16 shows a case of a Haynesville shale
fracture (Pope et al. 2009) where there is
some extensive height growth – on the order               SPE 125079 GMX Resources
of 600 ft. This degree of height growth does
occur in some of these deep shale reservoirs
and the monitoring provides information that
can be used to optimize the process as much
as is possible. Any amount of height growth             600 ft
out of zone is undesirable because it wastes
fluid, horsepower, chemicals, and time. The
point of hydraulic fracturing is to stimulate
the reservoir, not the unproductive rocks
around it. Monitoring provides information
that can be used to figure out ways to
minimize this behavior.
                                                                           Figure 16. Example Haynesville shale
                                                                           microseismic data.
Since one monitoring test proves nothing and one can always use the best examples, a more compelling result can be demonstrated by showing all of the fracturing results in a basin in a correlated plot. Figure 17 shows the results of nearly 2400 fractures in the Barnett shale prior to mid-2010 – everything that was monitored up to that time (Fisher 2010). The plot has been sorted by depth, with deeper wells on the left. The perforation depth is shown, along with the top and bottom of the hydraulic fracture as measured by the microseismicity. Although difficult to see and read, the data are also colored by county. In addition to the fracturing results, the deepest water well in each county, as obtained from the USGS web site, is also plotted at the top. Figure 17. A compendium of microseismic fracture diagnostic results in the Barnett shale relative to known aquifers. These results show that fracturing does not intrude on the aquifers. There is a limit to how much a fracture can grow vertically, even in the most advantageous conditions. There is considerable variability in fracture height in this plot, with much of it due to intersections of faults. However, even the most extreme cases do not extend vertically anywhere close to the aquifers. Similar results have been compiled for the Woodford and the Marcellus shale and those plots look similar. The fractures that have been compiled in Figure 17 are for relatively deep injections, but there are many reservoirs that are much shallower. One might expect that fracturing to surface would be common in shallow reservoirs, but Mother Nature again conspires against vertical fracture growth by reversing the stress field at shallow depths. Hydraulic fractures at depths greater than ~2,000 ft are mostly vertical, but at depths less than ~1,500 ft, they are either horizontal or mostly horizontal (a vertical component in some layers) due to the overburden stress being generally greater than the horizontal stresses at shallow depths. There is a wealth
of tiltmeter data on ~10,000 fractures that details how fractures have primarily vertical
components at depth, but have a larger percentage of the fracture growing horizontally in
shallow environments.

Summary
There are over seventy years of experience in conducting hydraulic fractures, a multitude of
fracture models, thousands of petroleum engineering papers on the subject, many years of
studying fractures using minebacks, corethroughs, laboratory experimentation and numerical
analysis, and most recently the application of fracture diagnostic measurements in thousands
of projects across North America. All of this knowledge and information has provided a sound
understanding of the basic principles and general behavior of hydraulic fracturing.

Vertical propagation of a hydraulic fracture across layers is very inefficient and it is difficult to
obtain extensive vertical growth. Fracture heights of several hundred feet are common, and
they may occasionally exceed 1,000 ft in a few deep reservoirs. However, there has never been
an observed case of a hydraulic fracture propagating thousands of feet vertically to intersect an
aquifer. In shale projects where large fluid volumes are injected, the thousands of diagnostic
measurements have consistently shown that fractures remain thousands of feet deeper than
the aquifers.

Fractures do occasionally intersect faults, but the diagnostic information shows that vertical
growth is also limited when this occurs. Some of the largest measured heights occur in cases
where a fault has been intersected, but growth is equally likely to be downward as upward and
it is typically only about twice the height of a normal fracture.

Shallow hydraulic fractures are not observed to grow vertically because of the changing stress
state. Less than about 1500 ft, the overburden stress is the least principal stress and this causes
fractures to be primarily horizontal at shallow depths. Some vertical components may occur,
but they are typically very limited.

References
Pope, C, Peters, B., Benton, T., and Palisch, T. 2009. Haynesville Shale: One Operator’s Approach
        to Well Completions in this Evolving Play. Paper SPE 125079, SPE Annual Technical
        Conference and Exhibition, New Orleans, Louisiana, 4-7 October.
Fisher, M.K. 2010. Data Confirm Safety of Well Fracturing. American Oil and Gas Reporter. July.
Warpinski, N.R., Branagan, P.T., Peterson, R.E., and Wolhart, S.L. 1998. An Interpretation of M-
        Site Hydraulic Fracture Diagnostic Results. Paper SPE 39950 SPE Rocky Mountain
        Regional/Low Permeability Reservoirs Symposium, Denver, Colorado, 5-8 April.
Warpinski, N.R. and Teufel, L.W. 1987. Influence of Geologic Discontinuities on Hydraulic
        Fracture Propagation. Journal of Petroleum Technology, 39: 209-220.
Warpinski, N.R. and Teufel, L.W. 1989. In Situ Stresses in Low-Permeability, Nonmarine Rocks.
        Journal of Petroleum Technology, 41: 405-414.
You can also read