NAREIT Conference Presentation June 2017 - Together with you, we make a house a home - Invitation Homes
←
→
Page content transcription
If your browser does not render page correctly, please read the page content below
NAREIT Conference
  Presentation
    June 2017

                    Together with you, we make a house a home.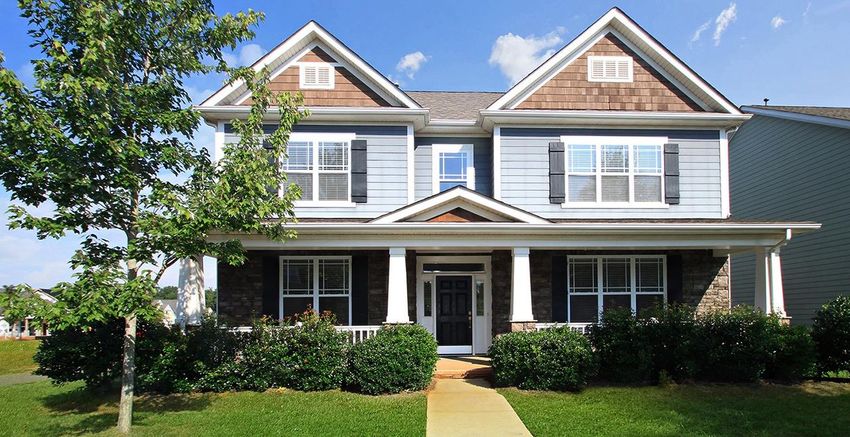
Invitation Homes Highlights
Best-in-class owner and operator of 47,918 single-family homes for lease
Compelling Low housing supply growth; completions 45% below long-term average in IH markets (1)
Industry
Fundamentals Strong rental demand; demographics imply even more demand in the pipeline
72% of revenues concentrated in supply-constrained Western U.S. and Florida markets
Concentrated
13 selected markets with strong fundamentals
Strategic Portfolio
Significant operating scale, with 3,686 homes per market on average
Simple Business
High margin, low volatility business
Model with
Significant Internal Differentiated business model based on market level, local expertise
Growth
Additional NOI upside potential from operational improvements and enhanced revenue management
Opportunity
________________________________________________
Note: For additional detail, please see notes in the Appendix section.
2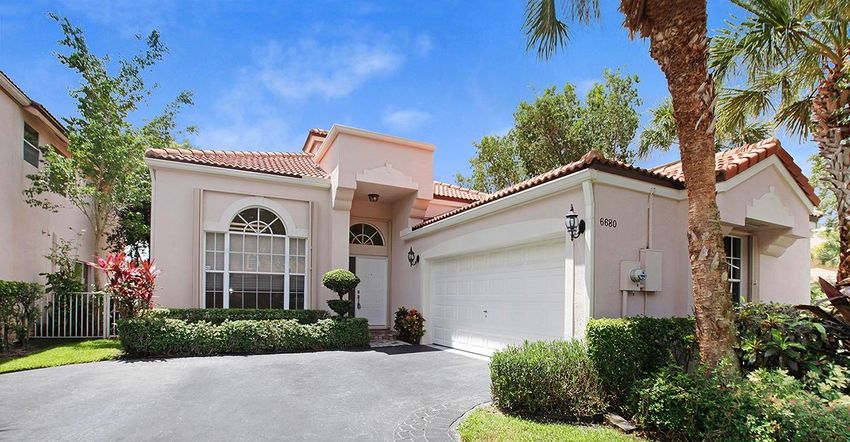
Portfolio Concentrated in Supply-Constrained Coastal Markets

              72%
 of revenue generated
                                                          Seattle
  in Western U.S. and                                       8%
       FL markets
                                                                                    Minne-
                                                                                    apolis
                                                                                     3%
           >95%
   of revenue from                                 Northern
                                                                                             Chicago
  markets with > 1,800                             California
                                                                                               7%
                                                      7%
        homes

                                                                    Las Vegas
                                                                       2%
                                                     Southern
                                                                                                                Charlotte
              45%                                    California
                                                       12%
                                                                          Phoenix
                                                                            8%                                    5%
     below long-term                                                                                    Atlanta Jacksonville
   average supply in IH                                                                                  13%        4%

        markets (1)
                                                                                                                Orlando
                                                                                                                  7%
                                                                                                       Tampa
                                                                                                         9%               South
            5.5%                                                                                                          Florida
                                                                                                                           15%
   same store renewal
     rent growth (2)

________________________________________________
Note: For additional detail, please see notes in the Appendix section.

                                                                                3
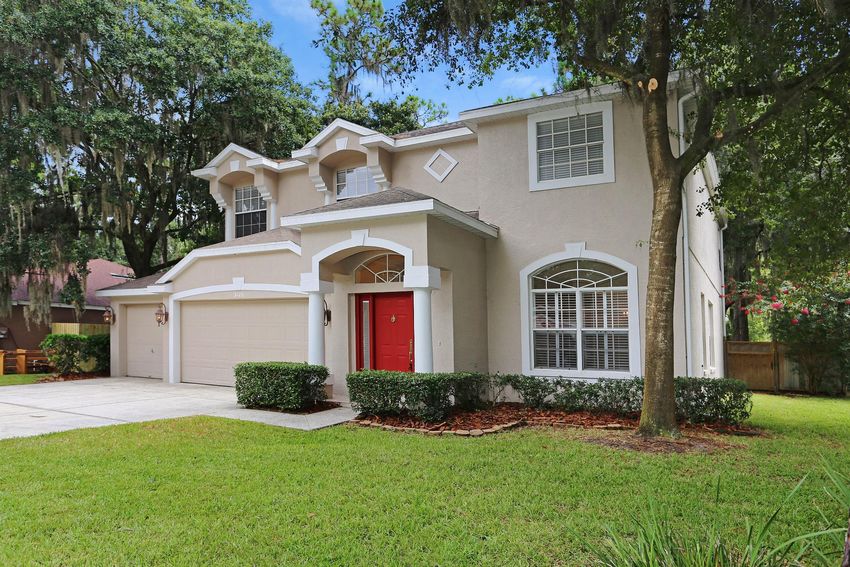
High-Quality Homes
        Seattle, WA       Northern California   Southern California

        Atlanta, GA         South Florida          Orlando, FL

         Tampa, FL           Phoenix, AZ           Seattle, WA

                      4
Resident-Centric Service and Management
Proactive resident service from in-house team committed to genuine care drives higher resident
satisfaction and lower turnover
General Maintenance “ProCare” Proactive
Satisfied Residents
Service Program Maintenance Program
24/7 maintenance hotline Continuous evaluation of 35% Same Store turnover rate for the
property condition twelve months ended 3/31/17
217 maintenance techs
• 45-day post move-in visit 5.5% Same Store renewal rent growth
Majority of maintenance
• 6-month visits thereafter for twelve months ended 3/31/17
performed in-house
Reduce future turn spend A+ Better Business Bureau (BBB) Rating
through proactive monitoring
5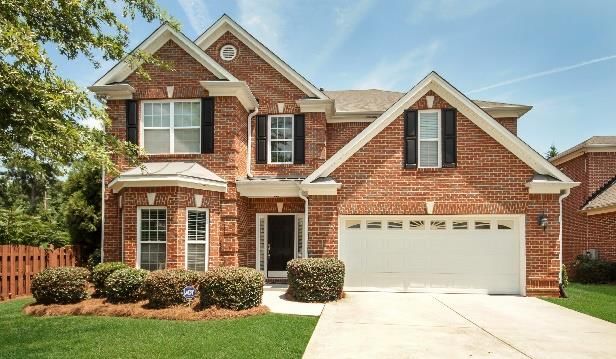
Strategic Initiatives
Optimizing the portfolio and service platform to drive incremental growth and efficiency
Continue to capitalize on favorable supply/demand fundamentals by driving outsized rent growth
Location
Focus acquisitions on Western U.S. and Florida
Recycle capital accretively
Product
Begin to pursue select revenue enhancing capex opportunities
Pursue other income opportunities
Service Optimize lease expiration schedule
Centralize and automate administrative functions
6
I.           COMPELLING INDUSTRY FUNDAMENTALS

Home Pictured: Southern CA      7

Shortage of Housing Supply
       U.S. Housing Summary
            121 Million Households
                              Owned
                                63%
                              (76mm                                              Total Housing Completions (Single and Multifamily) as
                               units)                                            a % of Households in Invitation Homes’ Markets
                             Rented
                               37%
                             (45mm
                              units)

      45 Million Rental Households
                                                                                                                             45% below
                                                                                                                           Long-Term Avg.
                         Single-Family
                          Rental 35%
                        (15.8mm units)                      Mobile Homes, Etc.
                                                            5% (2.1mm units)

      10+ Unit
     Apartments                              2-9 Unit
        31%                                Apartments
   (14.2mm units)                              29%
                                         (13.4mm units)

________________________________________________
Note: For additional detail, please see notes in the Appendix section.

                                                                          8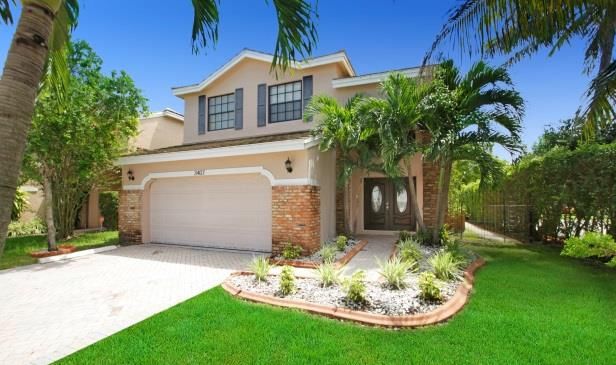
Strong Demand
 Demand in Invitation Homes markets is forecast to outpace the national average

   2016A – 2018E Job Growth CAGR (1)                                         2016E – 2018E Household Formation CAGR (2)

                                                                             2.0%

                                                                             1.8%
                                                                                                                  1.8%
                                           65% Higher
                                                                             1.6%
                                                                                                86% Higher

                                                                             1.4%

                   1980-2016 U.S. Avg.                                       1.2%
                                                                                    1980-2016 U.S. Avg.

                                                                             1.0%
                                                                                               1.0%

                                                                             0.8%
                                                                                           U.S. Average      Invitation Homes
                                                                                                                  Markets

________________________________________________
Note: For additional detail, please see notes in the Appendix section.

                                                                         9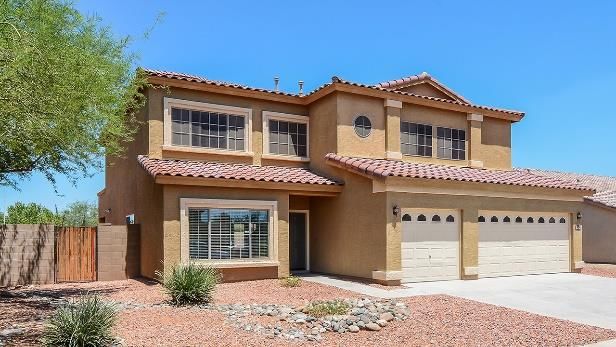
Demographics Create a Long Runway for Household Formations
JBREC expects 12.5M net households to form over the next 10 years
Younger generations have shown a higher tendency to rent than own their homes.
58% of the 12.5 million new households to be formed by 2025 are expected to become renters.
________________________________________________
Note: For additional detail, please see notes in the Appendix section.
10Shifts in Household Composition Align with Our Resident Profile
Average resident age of 40 years positions Invitation Homes to capture future household growth
Current Population by Age Cohort (1)
(millions of people)
23.0 Future
Demand
22.7
22.5
Invitation Homes Resident Profile (2)
22.0
• Average Age: 40
21.7
Avg. IH • Marital Status: 49% married
21.0 Resident
21.1
Age: 40
20.9 • Average Income: $96k (2 incomes per household)
20.4 • Income-to-Rent Ratio: 4.7x
20.0 20.2
19.0
18.0
15-19 20-24 25-29 30-34 35-39 40-44 45-49
________________________________________________
Note: For additional detail, please see notes in the Appendix section.
11II. THE INVITATION HOMES WAY Home Pictured: South FL 12
Growth in IH Markets Significantly Outpacing National Average
 High quality homes in desirable neighborhoods drive outsized rent growth and capital appreciation

   New Lease Rental Rate Growth (1)                                           Home Price Appreciation (2)
   (Lease-over-Lease, T12M as of 3/31/17)                                     (Year-over-Year, February 2017)

                                                                                              14% Higher
                                  31% Higher

________________________________________________
Note: For additional detail, please see notes in the Appendix section.

                                                                         13
Targeted Strategy Utilizing Local Market Knowledge
Our integrated acquisition platform and local market expertise have guided our investments
Home Selection Process
(data as of March 31, 2017) Purpose-Built Portfolio – 94% of our homes were
acquired in single transactions
Current Disciplined Investment Strategy – Analyze 64 factors
Portfolio of
47,918 homes in evaluating acquisition
• Desirable, in-fill submarkets; primarily 3 bedroom,
Placed bids on 2 bathroom homes that appeal to families
~300,000 homes
Performed pre-bid diligence Local Market Knowledge – Asset selection led by
investment teams in each market, combining local
Underwrote >1 million homes knowledge with centralized portfolio oversight out of
Dallas headquarters
Key Underwriting • 26 dedicated investment professionals; 21 in-
Criteria market
1. Location
2. Physical
attributes Disciplined Investors – More than 1 million homes
3. Total return
underwritten since inception in 2012 to arrive at
objectives
current portfolio of 47,918 homes
14Market Scale and In-Fill Locations Are Key Differentiators
Southern California Seattle
Number of Homes: 4,610 Number of Homes: 3,185
Total Avg. Rent PSF: $1.30 Total Avg. Rent PSF: $1.00
15Core Activities In-House From Day One
Acquisitions, renovations, leasing, and asset management have all been run in-house since inception
700+ local market employees employ a
Purposeful differentiated approach leading to superior
Acquisitions operating results
• 200+ maintenance techs, 100+ leasing agents
95%+ Same Store occupancy since 2014
100% In-House
Rigorous Asset Community Disciplined ~100% of “handyman” work completed by in-
Management Model Renovation
house maintenance techs
Over 47,000 renovations completed in-house
Over 30,000 turns completed by in-house
Resident-
personnel
Centric Leasing
and Service
Over 3,000 homes sold through multiple
disposition channels, low average cost of sales
16III. Strong Growth and Performance Home Pictured: Seattle, WA 17
Attractive Growth and Margin Expansion
NOI growth driven by both revenue growth and operating expense efficiencies

Total Portfolio NOI             Same Store NOI                           Same Store Core NOI Margin
($ in millions)                 ($ in millions)

$155                             $140                                    64.5%

                                              +5.7%         $137.2                                  64.3%
                       $150.6                Growth
             +7.9%                                                       64.0%
$145        Growth               $130
                                              $129.8                                +90bps

                                                                         63.5%
              $139.5
                                                                                     63.4%
$135                             $120
                                                                         63.0%

$125                             $110                                    62.5%
              Q1 16    Q1 17                  Q1 16         Q1 17                     Q1 16         Q1 17

                                         FY 2017 Same Store NOI Growth           FY 2017 Same Store NOI Margin
                                              Guidance: 6.5 - 7.5%                     Guidance: 63 - 64%

                                        18
Strong Rent Growth with Consistently Low Turnover
High quality portfolio and differentiated operating platform drive strong rent growth and low
turnover
Same Store Average Monthly Rent Same Store Turnover (Annualized)
$1,700 50%
$1,664
$1,651
$1,633 39.5%
38.7%
$1,614
$1,600 35%
T12 Turnover = 34.9%
$1,592
31.8%
31.1%
29.6%
$1,500 20%
Q1 16 Q2 16 Q3 16 Q4 16 Q1 17 Q1 16 Q2 16 Q3 16 Q4 16 Q1 17
Same Store Average Occupancy
Q1 ‘17: 95.8%
April ’17: 96.0%
May ‘17: 96.1%
19Significant Other Income Growth
Early stages of maturation of the business and under-penetration of other income opportunities
provide robust growth opportunity
Same Store Other Income Same Store Monthly Other Income per Home
($ in millions)
$90 $90
$87
$80 $80
+18.8% $79 +22.3%
Growth Growth
$70 $70 $71
$66
$60 $60
FY 15 FY 16 1Q 16 1Q 17
________________________________________________
Note: For additional detail, please see notes in the Appendix section.
20Safe Balance Sheet
Flexible capital structure, with majority fixed rate debt and no maturities until Q3 2019 (1)
78% fixed rate debt with weighted average maturity of 4.7 years (1)(2)
Large undrawn revolver capacity of $1.0 billion as well as $192 million unrestricted cash
Solid cash flow stream, diversified by both geography and resident
3.7% weighted-average interest rate (1)
Unencumbered assets provide additional balance sheet flexibility
$1.0 billion, 10-year fixed rate Fannie Mae securitization closed in April 2017
Sizable Unencumbered
Majority Fixed Rate Debt (1) (2)
Pool (1)
Fixed Rate Debt Floating Rate Debt Encumbered Unencumbered
22%
41%
59%
78%
________________________________________________
Note: For additional detail, please see notes in the Appendix section.
21Favorable 2017 Outlook
Invitation Homes is positioned for another year of outsized growth
FY 2017
Guidance
Core FFO per common share, diluted (1) $0.96 - $1.04
AFFO per common share, diluted (1) $0.80 - $0.88
Same Store Revenue Growth 4.75% - 5.25%
Same Store Operating Expense Growth 1.50% - 2.00%
Same Store NOI Growth 6.50% - 7.50%
Same Store Core NOI Margin 63.0% - 64.0%
________________________________________________
Note: For additional detail, please see notes in the Appendix section.
22Appendix
Experienced Management Team
Executive management team has significant residential public company leadership experience
Bryce Blair John B. Bartling Jr. Ernest M. Freedman Dallas B. Tanner Bruce A. Lavine G. Irwin Gordon Mark A. Solls
Executive Chairman, President and Chief Chief Financial Chief Investment Chief Operations Chief Revenue Chief Legal
Board of Directors Executive Officer Officer Officer Officer Officer Officer
AvalonBay Ares Management AIMCO (NYSE: AIV) Invitation Homes Equity Residential The Trion Group DentalOne Partners
Communities (NYSE: (NYSE: ARES) HEI Hotels & Founder (NYSE: EQR) Gruma Corporation Concentra Inc.
AVB) Ares Commercial Resorts (Mission Foods)
Treehouse Group R&B Enterprises Wyndham
Trammell Crow Real Estate (NYSE: GE Real Estate (Oakwood Suiza Foods (Dean International
Experience
Residential ACRE) Apartments) Foods) (NYSE: DF) (AMEX: WBR)
Ernst & Young
Current Board Walden Residential PepsiCo (Frito-Lay) Dal-Tile
Trammell Crow
Positions: Lexford Residential (NYSE: PEP) International (NYSE:
PulteGroup and Residential
Trust (NYSE: LFT) Kellogg Company DTL)
Regency Centers Metropolitan
Credit Suisse First (NYSE: K) ProNet Inc.
Boston Structures (NASDAQ: PNET)
Current Board
Trammell Crow Position: Heska
Residential Corporation
24Same Store NOI and Same Store Core NOI Margin Reconciliations
Reconciliation of Net Loss to NOI, Same Store NOI, and Same Store Core NOI Margin
(in thousands) (unaudited)
Q1 2017 Q1 2016 % Change
Net loss $ (42,391) $ (9,975)
Interest expense 68,572 70,277
Depreciation and amortization 67,577 65,702
General and administrative 58,266 15,360
Property management expense 11,449 7,393
Impairment and other 1,204 (183)
Acquisition costs - 35
Gain on sale of property, net of tax (14,321) (9,192)
Other 226 118
NOI (total portfolio) 150,582 139,535 7.9%
Non-Same Store NOI (13,380) (9,772)
NOI (Same Store portfolio) $ 137,202 $ 129,763 5.7%
Core revenues (Same Store portfolio) $ 213,394 $ 204,690
Core NOI margin (Same Store portfolio) 64.3% 63.4%
25Notes
Page 2
Note: All Invitation Homes portfolio metrics are as of or for the three months ended March 31, 2017.
1) Source: Moody’s Analytics, sourced June 2017. Represents 2016 completions as a percentage of total households, relative to average completions as a percentage of total households from 1984 – 2016.
Page 3
Note: Percentages represent contribution to total revenue in 1Q17.
1) Source: Moody’s Analytics, sourced June 2017. Represents 2016 completions as a percentage of total households, relative to average completions as a percentage of total households from 1984 – 2016.
2) Reflects lease-over-lease rent growth for renewal leases signed in the trailing twelve months ended March 31, 2017 for the Same Store pool.
Page 8
Sources: U.S. Census Bureau, Bureau of Economic Analysis. Moody’s Analytics, sourced June 2017.
Page 9
1) Source: John Burns Real Estate Consulting, April 2017.
2) Source: John Burns Real Estate Consulting, January 2017.
Page 10
Source: John Burns Real Estate Consulting (JBREC) – Demographic Trends and the Outlook for Single Family Rentals, April 2017.
Page 11
1) Source: U.S. Census Bureau.
2) Source: Resident application data, for residents as of 3/31/17 with move-in dates in the trailing twelve months.
Page 13
1) U.S. Average based on John Burns Single-Family Rent Index as of February 2017.
2) U.S. Average based on Case Shiller Index as of February 2017.
Page 20
Note: FY 2016 vs FY 2015 comparison based on 2016 Same Store pool of 36,469 homes. 1Q17 vs 1Q16 comparison based on 1Q17 Same Store pool of 43,224 homes.
Page 21
1) As of 3/31/17, pro forma Fannie Mae loan and associated repayment activity. Includes retained certificates.
2) Includes impact of $3.5 billion of interest rate swaps.
Page 22
1) Core FFO and AFFO guidance is for operating results for the full year from January 1, 2017 through December 31, 2017, and assumes that estimated weighted average shares outstanding from February
1, 2017 through December 31, 2017 were outstanding for the full year 2017.
Note: The Company does not provide guidance for the most comparable GAAP financial measures of net loss, total revenues, and property operating and maintenance, or a reconciliation of the forward-
looking non-GAAP financial measures of Core FFO per share, AFFO per share, Same Store revenue growth, Same Store operating expense growth, Same Store NOI growth, and Same Store Core NOI
margin to the comparable GAAP financial measures because it is unable to reasonably predict certain items contained in the GAAP measures, including non-recurring and infrequent items that are not
indicative of the Company's ongoing operations. Such items include, but are not limited to, impairment on depreciated real estate assets, net (gain)/loss on sale of previously depreciated real estate
assets, share-based compensation, casualty loss, non-Same Store revenues, and non-Same Store operating expenses. These items are uncertain, depend on various factors, and could have a material
impact on our GAAP results for the guidance period.
26Disclaimer
This presentation may contain forward-looking statements within the meaning of Section 27A of the Securities Act of 1933 and Section 21E of the
Securities Exchange Act of 1934, which include, but are not limited to, statements related to the Invitation Homes Inc.’s (the “Company”)
expectations regarding the performance of its business, its financial results, its liquidity and capital resources, and other non-historical statements.
In some cases, you can identify these forward-looking statements by the use of words such as "outlook," "believes," "expects," "potential,"
"continues," "may," "will," "should," "could," "seeks," "projects," "predicts," "intends," "plans," "estimates," "anticipates" or the negative version of
these words or other comparable words. Such forward-looking statements are subject to various risks and uncertainties, including, among others,
risks inherent to the single-family rental industry sector and the Company’s business model, macroeconomic factors beyond the Company’s control,
competition in identifying and acquiring the Company’s properties, competition in the leasing market for quality residents, increasing property
taxes, homeowners’ association and insurance costs, the Company’s dependence on third parties for key services, risks related to evaluation of
properties, poor resident selection and defaults and non-renewals by the Company’s residents, performance of the Company’s information
technology systems, and risks related to the Company’s indebtedness. Accordingly, there are or will be important factors that could cause actual
outcomes or results to differ materially from those indicated in these statements. We believe these factors include but are not limited to those
described in the Company’s Annual Report on Form 10-K for the year ended December 31, 2016, as such factors may be updated from time to time
in the Company’s periodic filings with the Securities and Exchange Commission (the “SEC”), which are accessible on the SEC’s website at
www.sec.gov. These factors should not be construed as exhaustive and should be read in conjunction with the other cautionary statements that are
included in the Company’s filings with the SEC. The forward-looking statements speak only as of the date hereof and the Company expressly
disclaims any obligation or undertaking to publicly update or review any forward-looking statement, whether as a result of new information, future
developments or otherwise, except to the extent otherwise required by law.
This presentation includes certain non-GAAP financial measures, including Net Operating Income (“NOI”), Core NOI margin, Core Funds from
Operation (“Core FFO”) and Adjusted Funds from Operations (“AFFO”). These non-GAAP financial measures should be considered only as
supplemental to, and not as alternative or superior to, financial measures prepared in accordance with GAAP. Please refer to the Appendix of this
presentation for a reconciliation of the non-GAAP financial measures included in this presentation to the most directly comparable financial
measures prepared in accordance with GAAP.
27You can also read