GLOBAL ENERGY GROWTH IS OUTPACING DECARBONIZATION - A global research project of Future Earth and a research partner of the World Climate Research ...
←
→
Page content transcription
If your browser does not render page correctly, please read the page content below
A global research project of
            Future Earth and a research
            partner of the World Climate
            Research Programme

GLOBAL ENERGY
GROWTH IS OUTPACING
DECARBONIZATION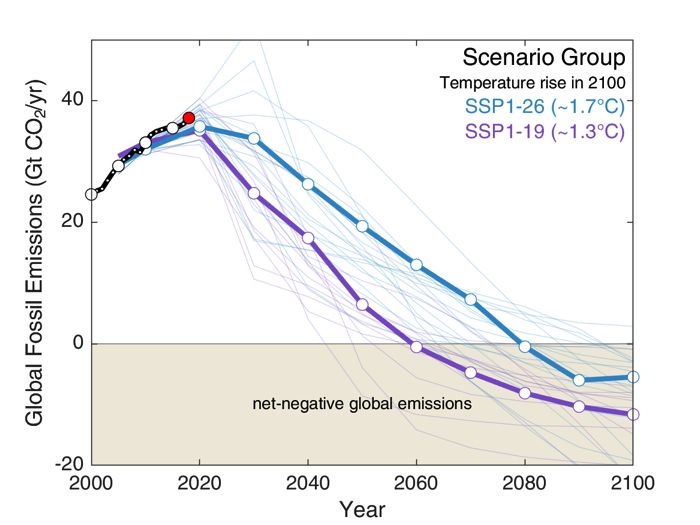
RB Jackson, C Le Quéré, RM Andrew, JG
Canadell, JI Korsbakken, Z Liu, GP Peters,
B Zheng, P Friedlingstein

September 2019

Citation
Jackson RB, Le Quéré C, Andrew RM , Canadell JG, Korsbakken JI , Liu Z, Peters GP , Zheng B, Friedlingstein P (2019) Global
Energy Growth Is Outpacing Decarbonization. A special report for the United Nations Climate Action Summit September 2019.
Global Carbon Project, International Project Office, Canberra Australia.
An update of Jackson RB, Le Quéré C, Andrew RM , Canadell JG, Korsbakken JI , Liu Z, Peters GP , Zheng B (2018) Global
Energy Growth Is Outpacing Decarbonization. Environmental Research Letters 13:120401, https://doi.org/10.1088/1748-9326/
aaf303. ©2018 The Author(s). Published by IOP Publishing Ltd.
Cover image: iStock by Getty Images
Global Carbon Project
https://www.globalcarbonproject.org
Global Energy Growth is Outpacing Decarbonization         3

R
        ecent reports have highlighted the challenge of     damage from two severe bleaching events since 2014
        keeping global average temperatures well below      and cyclones (AIMS 2018). Extreme events, from
        2°C and—even more so—1.5°C (IPCC 2018).             hurricanes to heat-waves and wildfires, increasingly
Fossil-fuel burning and cement production release           disrupt societies, including the loss of human lives.
~90% of all CO2 emissions from human activities,            Changes in the intensity and frequency of climate
with net deforestation releasing the remaining 10%.         extreme events and their impacts on ecosystems and
After a three-year hiatus with stable global emissions      society now have a discernible influence from climate
from 2014 to 2016 (Jackson et al. 2016, Le Quéré            change and its underlying warmer temperatures
et al. 2018, IEA 2018), CO2 emissions grew by               (Herring et al. 2018). Weather and climate disasters
1.4% in 2017 and 2.1% in 2018 to 37 Gt (billion             in the United States cost an estimated $306 billion in
tonnes), and are expected to continue to grow in 2019       2017, a hundred billion more than ever before (NOAA
(updated from Le Quéré et al. 2018). Additional             2018). CO2 emissions are responsible for most of the
increases through 2019 and 2020 remain uncertain            climate change that has occurred and will occur (e.g.,
but appear likely because of persistent growth in oil       Etminan et al. 2016, Huntingford and Mercado 2016)
and natural gas use and growth projected for the            and emissions are rising again (Figueres et al. 2018).
global economy. Coal use has slowed markedly in             Fossil CO2 emissions increased about 2% in 2018,
the last few years, potentially peaking, but its future     the second year of growth after three previous years
trajectory remains uncertain.                               of relatively stable emissions (Jackson et al. 2017, Le
                                                            Quéré et al. 2018a,b).
Despite positive progress in ~20 countries whose
economies have grown over the last decade and               Current economic and energy trends suggest that
their emissions have declined, growth in energy use         industrial emissions will be at least as high in 2019
from fossil fuel sources is still outpacing the rise of     as they were for the record emissions observed in
low-carbon sources and activities (Le Quéré et al.          2018. The International Monetary Fund projects
2019). A robust global economy, insufficient emission       Global Gross Domestic Product to grow by 3.2%
reductions in developed countries, and a need for           in 2019, and if the global economy decarbonised at
increased energy use in developing countries where per      the same rate as in the last 10 years, that would still
capita emissions remain far below those of wealthier        lead to an increase in global emissions. However,
nations will continue to put upward pressure on             many uncertainties cloud predictions, including risks
CO2 emissions. Peak emissions will occur when               associated with a potential US-China trade-war, the
improvements in the CO2 emitted per unit energy             extent to which the European Emissions Trading
overcome the growth in global energy use, requiring         System (ETS) carbon price remains relatively high,
fossil energy use to be replaced by rapidly low- or         and the unpredictability of Brexit, all of which could
no-carbon technologies.                                     lead to rapid changes in global economic growth.
                                                            Thus, while we expect global emissions to grow in
Climate change has arrived. Average global                  2019, we are uncertain how large that growth will be.
temperatures have already risen 1.1°C above pre-
industrial levels and, at current rates of warming, are     Emissions to date place us on a trajectory for warming
projected to reach 1.5°C within two decades (IPCC           that is currently well beyond 1.5°C and, potentially,
2018). The Great Barrier Reef in Australia has lost         2°C (Figures 1, 2, and 3).
half of its coral cover in its northern range, reflecting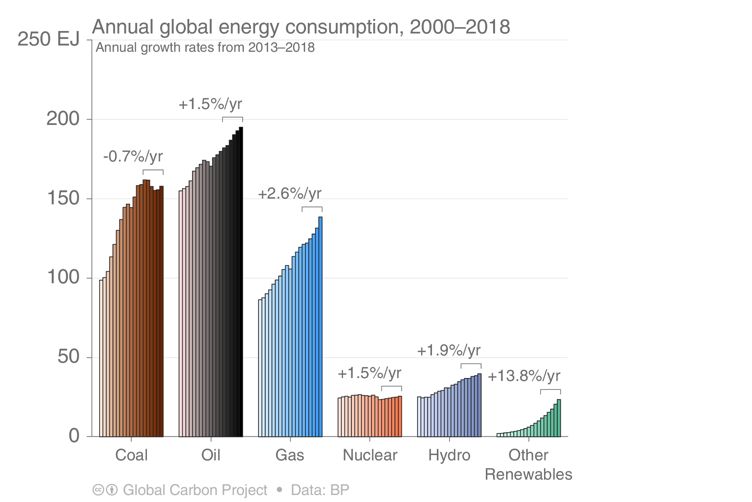
4

Figure 1 Bottom panel: Global CO2 emissions from fossil-fuel use and industry (green) and Gross World Product ($ US)
expressed as purchasing power parity (red; World Bank 2019) since 1990. Upper panel: Relative to year 2000, Gross World
Product, global CO2 emissions from fossil-fuel use and industry, global energy use (BP 2019), CO2 intensity of the energy
system (global CO2 emissions from fossil-fuel use and industry divided by global energy use), and energy intensity of the global
economy (global energy use divided by global GDP) from 1990-2018.

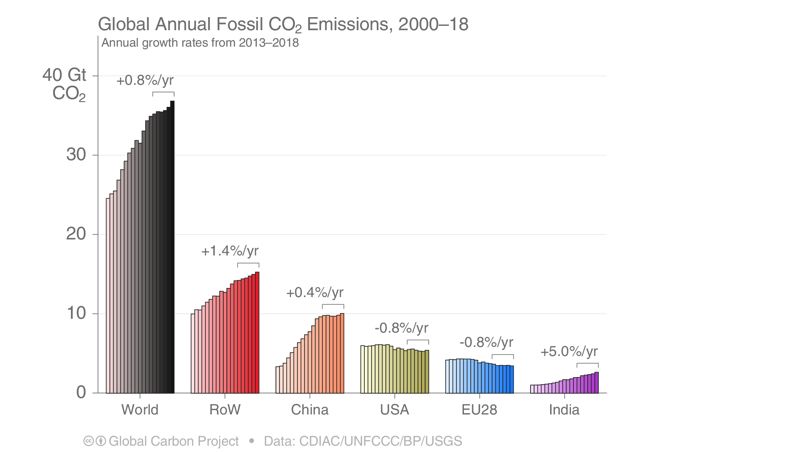
Global Energy Growth is Outpacing Decarbonization             5

Figure 2 Fossil CO2 emissions, including cement production globally and for five regions (ROW= Rest of Word); brackets
show average annual growth rate for 2013-2018.

The global growth in emissions in 2018 can be                having significantly lower fossil CO2 emissions over
examined more closely through national trends.               the past decade without decreases in Gross Domestic
Changes in emissions (and estimated ranges) for              Product (GDP): Aruba, Barbados, Czech Republic,
2018 compared to 2017 for major emitting countries           Denmark, France, Greenland, Iceland, Ireland, Malta,
and regions are (based on preliminary data): China           Netherlands, Romania, Slovakia, Slovenia, Sweden,
+2.3%, the United States +2.8%, the European Union           Switzerland, Trinidad and Tobago, United Kingdom,
-2.1%, India +8.1%, and the Rest of the World +1.7%.         USA, and Uzbekistan (Le Quéré et al. 2019). These
Despite the return of rising emissions in 2018, positive     countries contribute 20% of CO2 emissions globally.
developments can be found in at least 18 countries

Figure 3 Historical fossil CO2 emissions (black, Le Quéré et al 2018b) compared to scenarios with a 66% probability of
staying below 2°C in 2100 (thin blue lines, median temperature increase of 1.7°C; Riahi et al 2016) and below 1.5°C
in 2100 (thin purple lines, median temperature of 1.3°C). The respective marker scenarios shown in bold are based on the
Shared Socioeconomic Pathways (SSPs). Data: Riahi et al (2017), Rogelj et al (2018). Preliminary value for fossil CO2
emissions in 2018 is shown in red.
6

Different fossil fuels are contributing varying amounts      consumption has grown 1.5%/yr on average globally
to the observed increases in global and regional CO2         since 2013 (Figure 4), with increases of ~5%/yr in
emissions. Natural gas use has grown the fastest of any      China and India (Figure 5) contributing most to
fossil fuel at a rate of 2.6%/yr since 2013 (Figures 4,      the global increase. More surprising has been the
5). Although natural gas is the cleanest of the fossil       increased oil use of 1.3%/yr in the United States
fuels, it is still a major source of the global increase     and 1.0%/yr in the European Union, where oil use
in CO2 emissions and contributes to the growth in            was believed to have peaked some years ago (Figure
methane emissions. In countries such as the United           5). Despite improved fuel efficiency, these increases
States, some of this growth has come at the expense of       are driven by more air travel and vehicles and, in
coal as a fuel for electricity generation, reducing CO2      some countries, distance driven per vehicle. Vehicle
emissions as a result (Figure 5). In China natural gas       numbers have grown ~4%/yr globally since 2012
use has grown at a rapid 9.4%/yr since 2013, both to         (OICA 2017). Electric vehicle numbers doubled to
supply new energy and to reduce air pollution from           4 million between 2016 and 2018 but still represent
coal use. Natural gas use has grown in essentially every     only a tiny fraction of the billion or more of the
region of the world—and in many countries—over the           light-duty fleet. Finally, air traffic is also using more
past five years as energy consumption has increased.         fuel. Fuel consumption by commercial aircraft grew
                                                             27% over the last decade (Statista 2018). Passenger
Oil use has also grown steadily for many decades and,        numbers and distance traveled both increased ~5%/yr
despite rapid increases in electric vehicles around the      over the same period, more than offsetting increases
world, continues to increase in transportation. Oil          in aviation fuel efficiency (ICAO 2017).

Figure 4 updated. Average annual energy consumption (EJ) by fuel source from 2000 to 2018 globally, with average annual
growth shown from 2013 through 2018 (BP 2019).

Global coal consumption had either declined or been          a substantial ~40% since 2005; in 2018 alone, ~15
steady since 2013, but unexpectedly increased in             MW of coal-fired capacity in the U.S. will close, a
2018 (Figure 4). Global energy consumption from              potential record. In the UK where the industrial
coal decreased from 162 billion GJ in 2013 to 158            revolution was born, coal use has declined rapidly in
billion GJ in 2018, a drop of 0.7% per year on average       recent decades and could be phased out by 2025. In
(BP 2019). Based on price and policy competition             the E.U., wind, solar and other non-hydro renewables
with natural gas and renewables, coal consumption            have grown so quickly that—at average rates of change
in both Canada and the United States has dropped             over the past five years (Figure 5)—they are on pace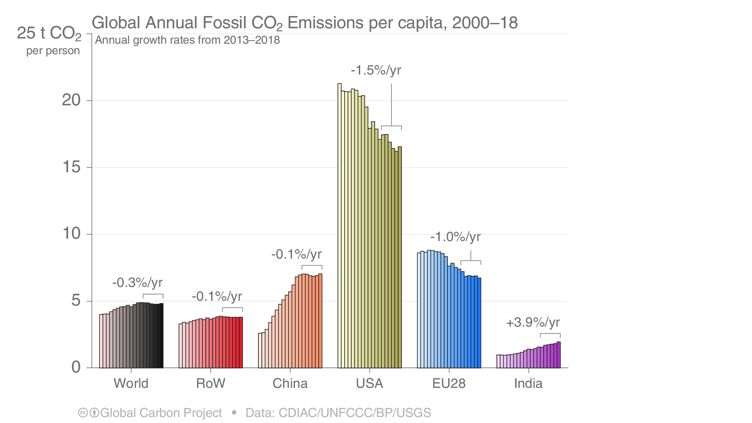
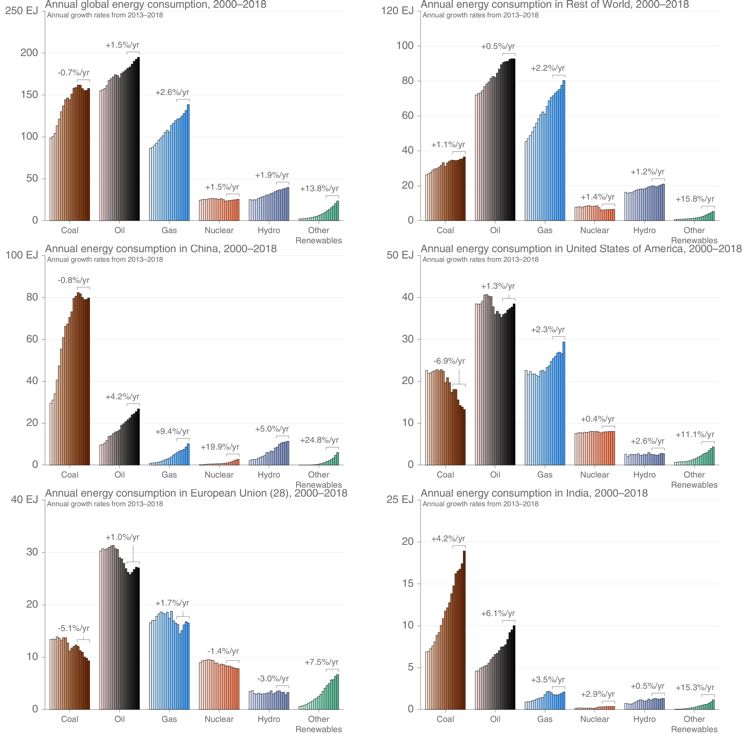
Global Energy Growth is Outpacing Decarbonization             7

to supply more primary energy than coal by 2021.

Figure 5. Average annual energy consumption (EJ) by fuel source from 2000 to 2018 globally (same as in Figure 4) and
regionally, with average annual growth shown from 2013 through 2018 (BP 2019).

Steep decreases in coal use in places such as Canada,      two decades and generate more than a billion tonnes
the U.S., and E.U. could eventually be outpaced            of additional CO2 emissions yearly.
by increased coal use elsewhere, particularly where
energy poverty is prevalent (Hubacek et al. 2017).         In countries such as India where energy use and CO2
Increased coal consumption is occurring regionally in      emissions are growing quickly, per capita statistics
the Asia Pacific and Central/South America at rates        highlight inequities in global resource use (Figure 6).
of ~3%/yr over the past decade (BP 2019). Recent           Energy use in the U.S. is ten-fold higher per capita
coal consumption in India grew at rates of 4.8% per        than in India, where hundreds of millions of people
year and now surpasses that of both the E.U. and the       still lack access to reliable electricity. It is five-times
United States (Figure 5). Sustained growth at this rate    higher in the E.U. and, surprisingly, has increased for
would double India’s coal consumption in less than         the last five years, reversing a decade-long trend of
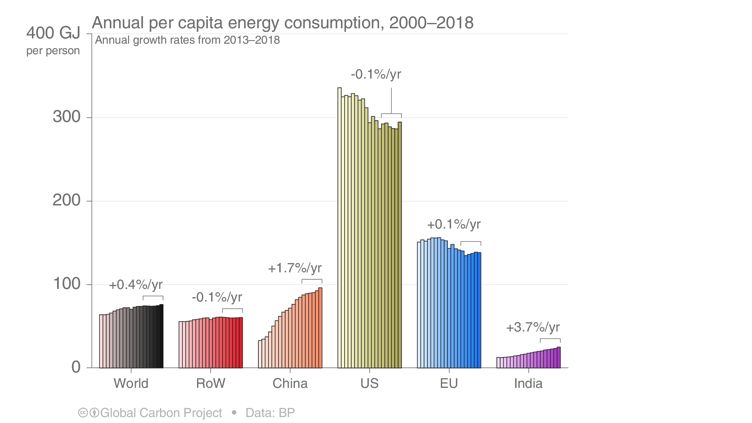
8

declining energy use and CO2 emissions (Figure 6).

Figure 6. Per capita primary energy consumption (GJ per person) and CO2 emissions (Mg or tonnes CO2 per person) from
2000 to 2018, with average annual change shown from 2013 through 2018. RoW=Rest of World.

Increased CO2 emissions in 2018 are not attributable       increased steadily for the last five years at an average
solely to relatively poorer nations where energy poverty   rate of 1.3% per year (Figure 5; 2013-2018 average).
remains a major concern (e.g., Casillas and Kammen         Low oil prices have spurred both gasoline use and sales
2010, González-Eguino 2015). The U.S. Energy               of light trucks in the United States; light trucks, which
Information Administration estimated that U.S. CO2         use a third more gasoline per mile on average than
emissions grew 2.8% in 2018, but expects them to           passenger cars (US DOT 2018), increased from half
decline in 2019 (EIA 2019). A cold winter in the           of new vehicles sales five years ago to two thirds today.
eastern half of the country increased heating demand
compared to 2017, and a warm summer increased              The biggest change in CO2 emissions in 2018
cooling demand. Oil use in the United States has also      compared with 2017 was an increase in both energy

Global Energy Growth is Outpacing Decarbonization           9

consumption and CO2 emissions in China, in stark           In summary, peak CO2 emissions remain elusive,
contrast to relatively stable emissions since 2013         declining global emissions even more so. Short of
(Figure 5, and Liu et al. 2015, Guan et al. 2018). As      a dramatic global economic downturn in the final
a result, preliminary estimates show CO2 emissions         quarter in 2019, global CO2 emissions are likely to
in China to grow by +2.3%in 2018 compared to               rise further. Projections in 2019 for growth in Gross
2017. The large growth of natural gas arises primarily     Domestic Product are 3.2% (IMF 2019). However,
from China’s policy for climate change mitigation          projected economic growth of 6 to 8% for India and
and air pollution control. The increase in China’s         China and 2.5% in the United States (World Bank
energy consumption more broadly in 2018 is driven          2018) would almost certainly increase emissions over
largely by growth in heavy manufacturing, with             this year’s value of 37 ± 1.8 Gt CO2. A quarter century
additional contributions from household use and            after the United Nations Framework Convention on
the service sector. Iron, steel, aluminium and cement      Climate Change, we remain far from its signature
production, for example, all increased compared to         goal to “stabilize greenhouse gas concentrations in the
2017: +1.2% for iron production, +6.1% for steel,          atmosphere at a level that would prevent dangerous
+4.2% for aluminium, and +1% for cement; thermal           anthropogenic interference with the climate system.”
power generation increased 6.9% in the first three
quarters of 2018, as well. Our estimated uncertainty       References
range of China’s 2018 emissions growth is large (i.e.,
0.4% to 6.7%). This range reflects uncertainties in        AIMS 2018 Long-term Reef Monitoring Program—
the evolution of China’s economic growth and energy        Annual Summary Report on coral reef condition for
consumption in the last three months of 2018, as           2017/18. Australian Institute of Marine Science.
well as inherent uncertainties in preliminary monthly
statistics. Near-term emission trends will depend          BP 2019 BP Statistical Review of World Energy June
on many factors, including the extent to which             2019
the Chinese government continues stimulating its
economy and China’s international balance of trade.        Casillas C E and Kammen D M 2010 The energy-
                                                           poverty-climate nexus. Science 330 1181-1182.
Whether CO2 emissions will continue to rise in 2019
and beyond is unclear. As noted above, one positive        EIA 2019 Energy Outlook, Energy Information
sign is the number of countries where emissions are        Administration, January 28th, 2019; https://www.
declining in the presence of economic growth, led          eia.gov/todayinenergy/detail.php?id=38133
by the E.U. and the United States. Such emission
reductions are important but need to accelerate            Etminan M, Myhre G, Highwood EJ, Shine KP 2016
(Figures 4 and 5). Emission reductions in the E.U.         Radiative forcing of carbon dioxide, methane, and
have slowed in recent years (Le Quéré et al. 2018b;        nitrous oxide: a significant revision of the methane
BP 2019), but declined 2.1% in 2018. Increased             radiative forcing. Geophysical Research Letters
CO2 emissions for the United States in 2018 arise          43:12,614-12,623
both from weather this year (see above), a factor that
is transient, and from sustained increases in oil use;     Figueres C et al. 2018 Carbon dioxide emissions rise
continued reductions in the United States may also         again. Nature, in press.
be at risk with changing political conditions and a
potential withdrawal from the Paris Accord. China and      González-Eguino M 2015 Energy poverty: an
India are experiencing a rapid expansion of non-fossil     overview. Renew. Sustain. Energy Rev. 47 377-385.
energy sources, but it is occurring with rapid growth
in fossil energy sources in India, in particular. In the   Guan D et al. 2018 Structural decline in China’s CO2
rest of the world, emissions are likely to continue to     emissions through transitions in industry and energy
grow as developing countries strive for much needed        systems. Nature Geosci. 11 551-555
economic growth and increasing energy use.
                                                           Herring, S. C., N. Christidis, A. Hoell, J. P. Kossin, C.
10
J. Schreck III, and P. A. Stott, Eds., 2018: Explaining Earth Syst. Sci. Data 10, 2141-2194,
Extreme Events of 2016 from a Climate Perspective.
Bull. Amer. Meteor. Soc. 99 S1–S157 Le Quéré C. et al. 2019 Drivers of declining CO2
emissions in 18 develop economies. Nature Climate
Hubacek K, Baiocchi G, Feng K and Patwardhan Change 9, 213-217.
A 2017 Poverty eradication in a carbon constrained
world. Nat. Commun. 8 912 Liu Z. et al. 2015 Reduced carbon emission estimates
from fossil fuel combustion and cement production
Huntingford C, Mercado L M 2016 High chance in China. Nature 524 335-338
that current atmospheric greenhouse concentrations
commit to warmings greater than 1.5°C over land National Oceanic & Atmospheric Administration
Scientific Reports 6 30294 2018; https://www.ncdc.noaa.gov/billions/
ICAO 2017 The World of Air Transport in 2017, OICA 2017 Motorization Rate 2015, International
International Civil Aviation Organization; https:// Organization of Motor Vehicle Manufacturers; http://
www.icao.int/annual-report-2017/Pages/the-world- www.oica.net/category/vehicles-in-use/
of-air-transport-in-2017.aspx
O’Neil B C et al. 2016 The Scenario Model
IEA 2018 CO2 Emissions from Fossil Fuel Intercomparison Project (ScenarioMIP) for CMIP6.
Combustion 2018; International Energy Agency; Geosci. Model Dev. 9 3461-3482
https://webstore.iea.org/co2-emissions-from-fuel-
combustion-2018 Peters G P, Andrew R M, Canadell J G, Fuss S, Jackson
RB, Ivar Korsbakken J, Le Quéré C, Nakicenovic
IMF 2018 World Economic Outlook Update, July N 2017 Key indicators to track current progress
2018. International Monetary Fund, Washington, and future ambition of the Paris Agreement Nature
D.C. Climate Change 7 118–122
IPCC 2018 Global Warming of 1.5°C. Special Report, Riahi K et al. 2017 The Shared Socioeconomic
Intergovernmental Panel on Climate Change. Pathways and their energy, land use, and greenhouse
gas emissions implications: an overview. Global
Jackson R B, Canadell J G, Le Quéré C, Andrew Environmental Change 42 153-168
R M, Korsbakken J I, Peters G P and Nakicenovic
N 2016 Reaching peak emissions Nature Climate Rogelj J, Luderer G, Pietzcker R C, Kriegler E,
Change 6 7-10 Schaeffer M, Krey V and Riahi K 2015 Energy system
transformations for limiting end-of-century warming
Jackson R B, Le Quéré C, Andrew RM, Canadell to below 1.5 °C Nature Climate Change 5 519–527
JG, Peters GP, Roy J, Wu L 2017 Warning signs for
stabilizing global CO2 emissions Environmental Rogelj J et al. 2018 Scenarios towards limiting global
Research Letters 12 110202. mean temperature increase below 1.5 °C. Nature
Climate Change 8 325–332
Jackson R B, Le Quéré C, Andrew RM , Canadell JG,
Korsbakken JI , Liu Z, Peters GP , Zheng B 2018 Seneviratne S I, Donat M G, Pitman A J, Knutti R,
Global energy growth Is outpacing decarbonization. Wilby R L 2016 Allowable CO2 emissions based on
Environmental Research Letters 13 120401. regional and impact-related climate targets Nature
529 477–483
Le Quéré C. et al. 2018 Global Carbon Budget 2018.Global Energy Growth is Outpacing Decarbonization 11
Statista 2018 Total fuel consumption of commercial https://www.bts.gov/content/average-fuel-efficiency-
airlines worldwide between 2005 and 2018; us-light-duty-vehicles.
https://www.statista.com/statistics/655057/fuel-
consumption-of-airlines-worldwide/ World Bank 2018 Global Economic Prospects, June
2018: The Turning of the Tide? Washington, DC:
US DOT 2018 Average Fuel Efficiency of U.S. Light World Bank. doi: 10.1596/978-1-4648-1257-6.
Duty Vehicles; Bureau of Transportation Statistics;A Global Research Project of Future Earth and a Research Partner of the World Climate Research Programme https://www.globalcarbonproject.org
You can also read