Experimental investigation into the performance of the solar pond in Kerbala - IOPscience
←
→
Page content transcription
If your browser does not render page correctly, please read the page content below
IOP Conference Series: Materials Science and Engineering

PAPER • OPEN ACCESS

Experimental investigation into the performance of the solar pond in
Kerbala
To cite this article: M H Abbood et al 2021 IOP Conf. Ser.: Mater. Sci. Eng. 1067 012098

View the article online for updates and enhancements.

                               This content was downloaded from IP address 46.4.80.155 on 11/08/2021 at 04:11
4th International Conference on Engineering Sciences (ICES 2020)                                                         IOP Publishing
IOP Conf. Series: Materials Science and Engineering              1067 (2021) 012098           doi:10.1088/1757-899X/1067/1/012098

Experimental investigation into the performance of the solar
pond in Kerbala

                    M H Abbood1, M Alhwayzee2 and M A Sultan1

                    1
                     Mechanical Engineering Department, College of Engineering, University of Kerbala, Iraq.
                    2
                     Petroleum Engineering Department, College of Engineering, University of Kerbala,, Iraq.
                    E-mail: mohadgla2@gmail.com

                    Abstract Solar ponds are a low-cost technology options for harnessing solar energy. An
                    experimental model for a solar pond was designed for Kerbala, Iraq, with the aim of heating water.
                    The surface area of the pond was 7.29 m2, at a depth of 1 m, and with walls tilted at an angle of 45o.
                    The experiment was conducted in February, March, and April, in the winter and spring seasons of
                    2020. Two types of salt were used in this work: sodium chloride and potassium chloride. Solar
                    radiation was recorded daily, and the measured solar irradiance ranged between 360 W/m2 and
                    1384W/m2. Solar radiation was focused on the surface of the pond using two reflecting mirrors, the
                    first being a flat surface and the second a concave shape, with a concavity depth of 0.1 m. Both
                    mirrors were 1 m long by 0.8 m wide. The experimental results showed that the highest temperature
                    of water in the pond was 44 °C, achieved using sodium chloride, while using potassium chloride
                    produced a maximum temperature of 40 °C. The useful energy and the experimental thermal
                    efficiencies were found to be 28.2 MJ per hour and 11.6%, respectively.

                    Keywords: salinity gradient, solar pond, sodium chloride, reflectors.

1-    Introduction

Due to ongoing increases in need for energy that have caused surges in fossil fuels consumption for energy
production, environmental concerns about the pollution caused by the use of that type of fuel have been
intensified, highlighting the need to find alternatives to provide clean, safe, and environmentally friendly
energy. In terms of renewable energy, one of the most abundant types is solar energy, especially where solar
radiation can be converted into thermal energy. The high temperatures in Iraq, especially in the summer,
make the use of solar pond technology a good choice for converting solar radiation into stored thermal
energy in that region. The working principle of a solar pond is based on absorbing solar radiation energy
and storing it in layers of water. The thermal efficiency of a solar pond can thus be calculated as the useful
energy (the thermal energy stored in the storage layer of the pond) over a period of time, divided by the
solar radiation, multiplied by the total area of the solar pond [1]. One type of pond, the salinity gradient

              Content from this work may be used under the terms of the Creative Commons Attribution 3.0 licence. Any further distribution
              of this work must maintain attribution to the author(s) and the title of the work, journal citation and DOI.
Published under licence by IOP Publishing Ltd                          1
4th International Conference on Engineering Sciences (ICES 2020)                                  IOP Publishing
IOP Conf. Series: Materials Science and Engineering     1067 (2021) 012098   doi:10.1088/1757-899X/1067/1/012098

solar pond, depends on the properties of a saline solution to restrict convection, making it possible to use
stored energy in several applications, the most prominent of which is water heating, at a later stage [1].
Many research papers have investigated solar pond technology with the aim of improving the design and
performance the solar ponds in terms of storing thermal energy in both laboratory and open-air conditions
[1].

Aiman [2] established a solar pond in Jordan with an area of 56 m2 and a depth of 1.8 m. The temperature
and salinity scale were recorded, which indicated that there were three main layers: UCZ, NCZ, and LCZ.
The lowest specific gravitational value in the LCZ layer was 1.16. Aiman [2] concluded that both the dust
that settled on the surface of the pond and the wind had a significant impact on the pond’s performance, and
continuous cleaning increased its efficiency, while the development of a network of ropes reduced the
impact of the wind [2]. A solar pond with a surface area of 1 m2 and a depth of 2 m was built, and reflecting
mirrors were used to focus the solar radiation on the surface of the water to increase the evaporation process;
their movement was manually controlled. The researcher studied several factors affecting the evaporation
process, including wind speed, ambient temperature, relative humidity and the amount of solar radiation.
From the experimental results, that both wind speed and relative humidity were found to have an inverse
relationship with the rate of evaporation, while radiation has a direct relationship. The maximum
evaporation rate occurred when the relative humidity reached 67.6%, and increasing the number of reflective
mirrors increased the pond temperature and reduced the surface area required for the pond to be effective
[3].
Muhammad et al. [4] constructed solar ponds in various shapes (rectangular and circular) during the three-
month summer season. The surface area of the rectangular and circular ponds were 63 and 51 cm2,
respectively, both with depths of 60 cm. Test results showed that the maximum temperatures of the
rectangular and circular ponds were 74 and 71 °C, respectively, with the difference attributed to the presence
of a smaller shadow area in the rectangular pond. The researchers thus analysed the shadow areas formed
in ponds, which depend on several factors such as geographical location, angle of radiation, and the
dimensions of the pond. The use of plastic sheeting on the surface of the pond was found to raise
temperatures, and at the end of the experiment, the temperature difference between the top layer and the
surrounding environment was 13 °C [4]. Balaji [5] studied the effect of sodium sulphate and sodium
carbonate salts on solar pond performance in a solar pond with a surface area of 2.5 m2 and a depth of 2 m,
in the Dead Sea region in Jordan. Based on the experimental results, he found that solar pond performance
was stable for a long period, and that the maximum temperature over 15.3 hours was 45 °C, while this was
60 °C within 10 hours, suggesting a thermal efficiency of 18.68%.

Khaldoon et al. [6] analysed the temperature distribution and salt concentration in the layers of water in a
solar pond rig. Their experimental results showed that the temperature of the LCZ reached 85 °C due to the
good insulation in the pond, which contributed to maintaining high temperatures even with the extraction
of thermal energy during the day. The researchers concluded that building a stepwise solar pond near a salt
water source would reduce costs [6]. Sathish et al. [7] created a solar pond with an area of 1.7 m2 and a
depth of 0.5 m in India. The performance of the pond was monitored with both sodium chloride salt and
coal cinders. NaCl showed better performance as compared to coal cinder in terms of storing more energy
due to the presence of a saline gradient. In their experimental work, they observed that the maximum storage
temperature for sodium chloride salt was 43 °C while that for coal was 37 °C, and that the period between
the hours of two and four in the afternoon was the peak period for solar energy, as in this period the amount
of radiated energy on the surface of the pond increased, while in the mornings the temperature decreased
due to there being less radiation [7]. Ito and Azam [8] assessed feasibility in salinity gradient solar ponds
(SGSP) in Saskatchewan, Canada. Highlights of their work included the global assessment of SGSP from

                                                            2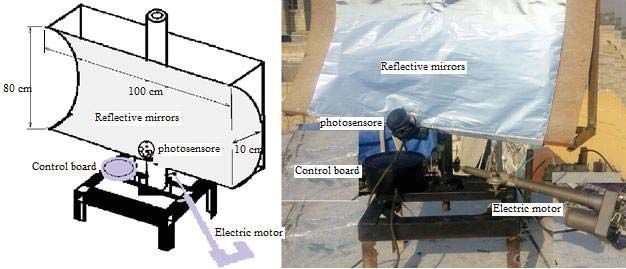
4th International Conference on Engineering Sciences (ICES 2020)                                  IOP Publishing
IOP Conf. Series: Materials Science and Engineering     1067 (2021) 012098   doi:10.1088/1757-899X/1067/1/012098

theoretical and practical viewpoints, the assessment of salinity and environment parameters, and valuation
of thermophysical property mechanisms affecting SGSP, and the use of simulations to examine transient
heat diffusion in SGSP. Their results suggested that, due to high solar insolation (1,100 to 1,400 kWh/m2),
Saskatchewan was a suitable location for thermal energy harvesting from saline water bodies, based on the
solar radiation absorbed under a gradient of salt concentration. Thermal conductivity increases with
temperature but decreases with increase in water salinity (0.55 to 0.675 W/m.K), while the opposite is true
for density (1,000 to 1,200 kg/m3). Similarly, the specific heat capacity increases slightly with temperature
and correlates inversely with salinity (3,000 to 4,200 J / kg K).

 In Turkey, Sogukpinar [9] compared numerical results with the experimental results for a specific district,
modelling a prototype salinity gradient solar pond with a square cross-section, isolated walls, and seven
layers as used in previous experimental studies. Numerical calculations were then performed using the Finite
Element Method in COMSOL, which showed that maximum temperature was found at 600 hours into the
720 hours of total simulation, and that after that temperature remained constant. Significant heat loss was
observed at the pond's top surface, as the side wall and foundation were lined with rock wool. According to
the numerical analysis carried out for 81 provinces, only one solar pond temperature remained below 300
K, that in Edirne; solar pond temperatures remained below 310 K in five further provinces, while the solar
pond temperature for 31 provinces was measured above 320 K [9].

More recently, Osamah et al [10] briefly demonstrated the historical context for solar ponds and examined
solar ponds world-wide using an overview of the literature. The work also described and addressed the
theoretical context of heat and mass transfer that governs the activity of solar ponds. Solar ponds are one of
the most promising and significant sources of renewable energy, and a basic energy balance technique can
be used to model the overall efficiency of a solar pond. Solar ponds are also particularly useful energy
resources in remote areas. Many parameters affect solar pond efficiency, however, and these parameters
may thus be seen as limitations with regard to cost and operating performance. In order to achieve smooth
installation and operability of a solar pond, these parameters should be assessed: it should be easy to access
a water supply for pond creation and external rinsing; good solar radioactivity should be available for higher
thermal activity; lower wind velocities are preferred to minimise mixing between three zones of the pond
and to limit wind-borne debris to preserve purity; and a lower vaporising rate is desirable to decrease the
required input of water [10].

The aim of the present work was to study a salinity gradient solar pond, in terms of its performance as a
source of hot water. The pond was designed to take full advantage of the solar radiation falling on its surface
to allow a comparison of the addition of two types of salts with respect to their properties and effectiveness
in thermal storage. The use of reflective surfaces with a tracking system to monitor the sun’s effects on the
performance of the pond further facilitated this. The research also aimed to study the performance of a
simple heat exchanger in terms of extracting heat from the pond.

2. Experimental Setup

2.1 Solar pond rig installation.

A solar pond with a square surface area and inclined 45° sloping walls was constructed with three layers,
UCZ, NCZ, LCZ, of 0.1, 0.6, and 0.3 m thickness, respectively and a surface area of 7.29 m2.The walls were
made of plywood and glass wool with a black liner added to enhance thermal insulation, as shown in figure

                                                            3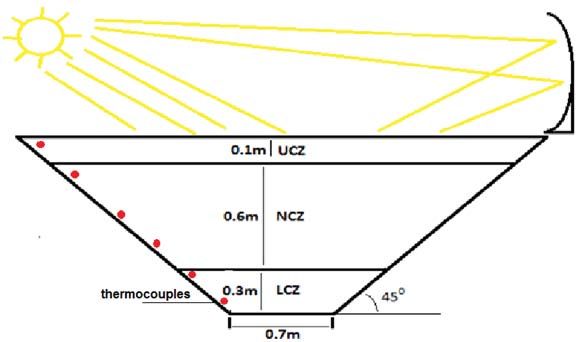
4th International Conference on Engineering Sciences (ICES 2020)                                  IOP Publishing
IOP Conf. Series: Materials Science and Engineering     1067 (2021) 012098   doi:10.1088/1757-899X/1067/1/012098

1. After construction, the pond was exposed to natural solar radiation and other climatic factors. As seen in
Figure 2, 11 k-type thermocouples were used: six of these were positioned at 0.1, 0.3, 0.5, 0.7, 0.9, and 1 m
from the bottom of the pond, within the water, and one was placed at the heat exchanger inlet and another
at the outlet, with one at the pond bottom and one at the pond walls; the final thermocouple was positioned
to read the ambient temperature. Measurement of solar radiation was taken daily for a period of 12 days,
from 8 am to 5 pm, during the test period for each type of salt used, as shown in the figures 3 and 4. The
temperatures of the pond layers over 24 hours were measured during the test period from 25 February to 2
April. Data were recorded for two types of salts, sodium chloride and potassium chloride. The test period
of each salt was 12 days with three different salt concentrations examined for each. The temperature of the
liquids flowing to and from the heat exchanger were measured at specified times for the saturated mixture,
and the useful energy and overall efficiency of the pond were calculated.

 Reflecting mirrors were used in conjunction with a sun tracking system to increase the concentration of
solar radiation on the surface of the pond and thus reduce the necessary surface area. The sun tracking
system used a motor to control the movement of the reflecting mirrors and photoresistors to sense sunlight
and search for the best direction to allow the mirror to get the largest amount of sunlight to focus on the
surface of the solar pond. There are two types of such system, one-axis and two-axis systems, and in this
research, a one-axis tracker was used that tracked the sun from east to west, as shown in figure 3.

                        Figure 1. Experimental salinity gradient solar pond in Kerbala.

                                                            4
4th International Conference on Engineering Sciences (ICES 2020) IOP Publishing
IOP Conf. Series: Materials Science and Engineering 1067 (2021) 012098 doi:10.1088/1757-899X/1067/1/012098
Figure 2. Schematic of the solar pond in Kerbala.
Figure 3. Sun tracking mirror system.
3. Materials and Methodology
3.1 Salts.
Several different salts can be used in solar ponds to store thermal energy, each of which has different
characteristics and affects the performance of the pond differently. Two types of salts were used in this
work, sodium chloride and potassium chloride. These salts have the advantage of being easily obtained due
54th International Conference on Engineering Sciences (ICES 2020) IOP Publishing
IOP Conf. Series: Materials Science and Engineering 1067 (2021) 012098 doi:10.1088/1757-899X/1067/1/012098
to good availability in the market and thus being of lower cost relative to other types of salts. In addition,
they are stable at high temperatures and have suitable solubility.
3.2 Water quality.
The water used in the construction of the solar pond was produced using reverse osmosis equipment
commonly used to purify water for human use. The specifications of this water are such that it contains a
very low percentage of salts and other solids. The percentage of solid particles in the local municipal water
was 360 TDS, while that in the water used in the pond had a reading of 14 TDS. The thermal conductivity
of this water is thus minimal, so salt was added gradually and to form the required layers of the solar pond.
3.3 Preparation of salt concentrations.
The concentration of salts for each layer of the pond was determined according to the function of each layer.
The upper layer, pure water, had a ratio of 0 to 0.005% salts to allow solar radiation to enter the lower layers,
while the middle layer had increases in concentration with depth to create three gradients, 2, 3, and 4%,
respectively. The lower layer had an increased concentration at specific times to study the effect of each
concentration on the temperature in that layer.
3.4 Measurements.
The temperature, solar radiation intensity on the pond, and salt concentration of water were measured using
the following devices:
a- Temperature meter, TM500 Thermometer, 12 nodes.
b- K-type thermocouples.
c- Solar power meter with TES-132 datalogging.
d- Salt concentration meter (EC/TDS Meter, Mi 306).
The relevant devices are shown in Figure 4 (a-d), respectively.
64th International Conference on Engineering Sciences (ICES 2020) IOP Publishing
IOP Conf. Series: Materials Science and Engineering 1067 (2021) 012098 doi:10.1088/1757-899X/1067/1/012098
Figure 4. Devices used for measurement: a- Temperature meter, b- Thermocouples, c- Solar power
meter, d- Salt concentration meter
3.5 Useful energy and pond thermal efficiency calculations.
The thermal efficiency of a solar pond can be calculated from the useful energy for the highest salinity
concentration, as in the following equation [11]:
ொೠ
ᢡൌ (1)
ூ
where Qu is the quantity of useful energy, calculated as
ܳ ݑൌ ܯ௦ ܿ כ௦ כοܶ (2)
where
ܯ௦ ൌ ܸ ߩ כ௦ (3)
ߩ௦ ൌ ߩ௪ כሺͳ െ ܥሻ ߩ௦௧ ܥ כ (4)
and
ሾሺఘೢ כೢ כሺଵିሻାఘೞೌ כೞೌ כሻሿ
ܿ௦ ൌ (5)
ఘೞ
74th International Conference on Engineering Sciences (ICES 2020) IOP Publishing
IOP Conf. Series: Materials Science and Engineering 1067 (2021) 012098 doi:10.1088/1757-899X/1067/1/012098
where C is the salt concentration in water; Vlcz is the volume of the LCZ layer (0.309 m3); ρw = 997 kgm-3,
ρNaCl =2160 kgm-3 and ρKCl= 1987 kgm-3 are the densities for water, NaCl salt, and KCl salt, respectively;
୵= 4.18 kJkg-1.K-1, and ୟେ୪= 0.88 kJkg-1.K-1, and େ୪= 0.69 kJkg-1.K-1 are the specific heats for
water, NaCl salt and KCl salt, respectively [12]; and Ms = 399.4 kg and 362.8 kg for NaCl and KCl solution
respectively. Additionally, ΔT is the temperature difference between the lower convective zone and ambient
air, while I is the solar energy incident on the pond such that
ܫൌ ܪ ܣ כ (6)
where Ho is the solar irradiance on the solar pond calculated using the equation for solar radiation on a
horizontal surface for a period between hour angles ω1 and ω2 defined as [16]
ଷ
ܪൌ ͳʹ כ כ ܩௌீ ቀͳ ͲǤͲ͵͵ כቀ͵Ͳ כ ቁቁ כ
గ ଷହ
గሺఠమ ିఠభ ሻ
ቀܿߜݏܿ߮ݏሺ߱݊݅ݏଶ െ ߱݊݅ݏଵ ሻ ߜ݊݅ݏ߮݊݅ݏቁ (7)
ଵ଼
ଶ଼ସା
ߜ ൌ ʹ͵ǤͶͷ כቀ͵Ͳ כ ቁ (8)
ଷହ
where ܩௌீ is the solar constant of 1,367 wm-2 and݊is the day of the year, ߮ is the latitude angle, ߜ is the
declination angle, and A is the surface area of the solar pond.
3.6 Experimental Procedure.
The pond was filled with water in stages, beginning with a 0.3m thickness LCZ layer to which sodium
chloride salt at a concentration of 10.7% was added. The concentration of this layer was increased until it
reached its maximum percentage of 26%, the saturation point. Then, the NCZ layer was added in three
levels, each with a thickness of 0.2 m, with different salt concentrations ranging from 2% to 4%, increasing
with depth. Finally, the UCZ layer was added; this was salt free and 0.1m thick. The pond was left for
several days until its layers had been warmed by solar radiation. Temperatures were then recorded using
thermocouples and solar radiation was recorded during the research period. The pump connected to the heat
exchanger was operated and the flow velocity of the fluid used in the exchanger controlled during
temperature measurement. These steps were repeated for potassium chloride salt.
4. Results and Discussion
Solar pond temperatures and the daily intensity of radiation were recorded; the highest readings for the later,
of 1384 W/m2, were found at about 2:00 pm, as shown in figures 5 and 6. The results also showed the highest
temperatures when using sodium chloride salt as compared to potassium chloride salt. Figures 7 and 8 show
the temperatures at three concentrations (10.7%, 19.4% and 25.4%) for sodium chloride and potassium
chloride salts in the lower zone of the pond. Figure 7 shows that temperatures increased with increasing
NaCl salt concentrations, while Figure 8, for the potassium chloride salt, shows that for the same
concentrations, the temperature rose until it reached 40 °C and then began to gradually decrease. Comparing
the two graphs, the highest accessible temperature at a concentration of 25.4% was found with NaCl salt at
44.5 °C. It can thus be concluded that sodium salt has a higher heat storage capacity than potassium salt;
further, in terms of cost, sodium chloride salt is the least expensive and most abundant salt on the market.
84th International Conference on Engineering Sciences (ICES 2020) IOP Publishing
IOP Conf. Series: Materials Science and Engineering 1067 (2021) 012098 doi:10.1088/1757-899X/1067/1/012098
1400
1200
Solar Radiation W/m2
1000
800
600 Max. Radiation
400 Min. Radiation
200
0
1 2 3 4 5 6 7 8 9 10 11 12
Day
Figure 5. Maximum and minimum values of daily solar irradiance on the solar pond
with NaCl salt.
1400
1200
Solar Radiation W/m2
1000
800
600 Max. Radiation
400 Min. Radiation
200
0
1 2 3 4 5 6 7 8 9 10 11 12
Day
Figure 6. Maximum and minimum values of daily solar irradiance on the solar pond
with KCl salt.
94th International Conference on Engineering Sciences (ICES 2020) IOP Publishing
IOP Conf. Series: Materials Science and Engineering 1067 (2021) 012098 doi:10.1088/1757-899X/1067/1/012098
50
40
Temperature oC
30
temp. ambiant
20
con. 10.7%
10 con. 19.4%
0 con. 25.4%
Local time
Figure 7. Maximum temperature in the LCZ with variable NaCl concentrations.
50
40
Temperature oC
30
temp. ambient
20
con. 10.7%
10 con. 19.4%
con. 25.4%
0
Local time
Figure 8. Maximum temperature in LCZ with variable KCl concentration.
Figures 6 and 7 show the fluid temperature in the heat exchanger used to extract heat from the solar pond.
Across the three flow rates, 0.5, 0.75, and 1 L/min., the liquid reached its maximum temperature at a flow
of 0.5 L/min. Comparing the use of sodium chloride salt with that of potassium chloride in the solar pond,
the experimental results show that sodium chloride salt has a higher storage capacity for heat than potassium
chloride salt, as shown in figures 9 and 10. Sodium chloride salt is thus the best choice for heat extraction.
104th International Conference on Engineering Sciences (ICES 2020) IOP Publishing
IOP Conf. Series: Materials Science and Engineering 1067 (2021) 012098 doi:10.1088/1757-899X/1067/1/012098
40
Temperature oC
30
inlet temp.
20
outlet temp. at ṁ= 0.5 L/min
10 outlet temp. at ṁ= 0.75 L/min
outlet temp. at ṁ= 1 L/min
0
12:00 PM
12:10 PM
12:20 PM
12:30 PM
12:40 PM
12:50 PM
1:00 PM
1:10 PM
1:20 PM
1:30 PM
1:40 PM
1:50 PM
2:00 PM
2:10 PM
2:20 PM
Time in minute
Figure 9. Outlet temperature of the heat exchanger for various flow rates of NaCl salt mixture.
40
Temperature oC
30
inlet temp.
20
output temp. at ṁ= 0.5 L/min
10 output temp. at ṁ= 0.75 L/min
output temp. at ṁ= 1 L/min
0
12:00 PM
12:10 PM
12:20 PM
12:30 PM
12:40 PM
12:50 PM
1:00 PM
1:10 PM
1:20 PM
1:30 PM
1:40 PM
1:50 PM
2:00 PM
2:10 PM
2:20 PM
Time in minute
Figure 10. Outlet temperature of the heat exchanger for various flow rates of KCl salt mixture.
Based on the useful energy and the value of radiation entering the pond, the thermal pond efficiency was
calculated. The useful energy was 28.2 MJ for one hour, giving an efficiency of about 11.6% when sodium
chloride salt was used, as shown in Figures 11 and 12.
114th International Conference on Engineering Sciences (ICES 2020) IOP Publishing
IOP Conf. Series: Materials Science and Engineering 1067 (2021) 012098 doi:10.1088/1757-899X/1067/1/012098
30
Useful Energy MJ
20
NaCL
10 KCL
0
10.70% 19.40% 25.40%
Concentration%
Figure 11. Useful Energy of Solar Pond with NaCl and KCl salts.
14.00%
12.00%
10.00%
Efficiency
8.00%
6.00% NaCL
4.00% KCL
2.00%
0.00%
10.70% 19.40% 25.40%
Concentration%
Figure 12. Efficiency of Solar Pond with NaCl and KCl salts.
A comparison with previous research, shown in Table 1, taking into consideration the size of the heat storage
layer in the pond, suggests that the optimisation of the solar pond system by adding mirrors with a solar
tracking system and the use of sodium chloride salt offer the best means of providing suitable temperatures
for applications that need low temperatures, especially during winter months. Renuka [13] obtained an
efficiency of 11.21% and Kasaeian et al. [14] obtained an efficiency of 9.68%,while the efficiency obtained
from this research was 11.6%; the thicknesses of the thermal storage layers were 0.8 m, 0.8 m, and 0.3 m,
respectively. With regard to the useful energy, Alcaraz et al. [15] obtained a useful energy of 13.3MJ per
124th International Conference on Engineering Sciences (ICES 2020) IOP Publishing
IOP Conf. Series: Materials Science and Engineering 1067 (2021) 012098 doi:10.1088/1757-899X/1067/1/012098
hour, while in the current work, the obtained useful energy was 28.2 MJ for one hour. The area of the pond
used in Spain was 500 m2 and the thickness of the lower layer was 0.6 m, as shown in table 2.
Table 1. Comparison of maximum thermal efficiency and thickness of solar pond storage layer for the
highest brine concentration of NaCl salt .
Study Year Efficiency Thickness LCZ Country
(%) (m)
Renuka [13] 2016 11.2 0.8 India
Kasaeian et al. [14] 2017 9.68 0.8 Turkey
Current work 2020 11.6 0.3 Iraq
Table 2. Comparison of useful energy with area and thickness of solar pond for the highest brine
concentration of NaCl salt.
Search number Year Useful Energy Thickness LCZ Area of Solar Country
(MJ) for one (m) Pond (m2)
hour
Alcaraz [15] 2015 13.3 0.6 500 Spain
Current work 2020 28.2 0.3 7.29 Iraq
5. Conclusion
Within the experimental work carried out over a period of three months, two types of salts and reflective
mirrors with a tracking system for solar energy. The conclusions below were thus drawn:
1. When sodium chloride salt with a concentration of 25.4% was used, the temperature of the deepest layer
of the pond reached 44 °C; it reached 40 °C when potassium chloride salt was used.
2. The calculated useful energy and efficiency of the solar pond were higher when sodium chloride salt was
used as compared to the use of potassium chloride salt; the results were 28.2 MJ and 11.6% for NaCl salt
and 19.8 MJ and 7.3% for KCl, respectively.
3. Sodium chloride salt was the best salt for solar pond applications in terms of temperature and cost.
4. The experimental results also showed that the beneficial energy and thermal efficiency increased with
increasing salt concentrations in the pond and higher temperatures within the pond layers. The results also
showed that the sodium chloride salt improved the performance of the solar pond.
134th International Conference on Engineering Sciences (ICES 2020) IOP Publishing
IOP Conf. Series: Materials Science and Engineering 1067 (2021) 012098 doi:10.1088/1757-899X/1067/1/012098
Nomenclature
Symbol Description Unit
SGSP Salinity Gradient Solar Pond ---
UCZ Upper Convective Zone ---
NCZ Non-Convective Zone ---
LCZ Lower Convective Zone ---
NaCl Sodium Chloride ---
KCl Potassium chloride ---
TDS Total Dissolved Solids Mscm-1
Qu Useful energy w
I Solar energy incident wm-2
Ƞ Efficiency %
Ho Solar irradiance wm-2
A Area of pond m2
C Salt concentration in water %
Ms Mass of brine kg
Cps Specific heat of brine KJKg-1K-1
CPw Specific heat of water KJKg-1K-1
CPsalt Specific heat of salt KJKg-1K-1
Vlcz Volume of LCZ m3
ρs Density of brine Kgm-3
ρw Density of water Kgm-3
ρsalt Density of salt Kgm-3
ΔT Temperature difference o
C
References
[1] Karakavalasa G, Chukka S K 2013, Solar Pond Technology , International Journal Of Engineering
Research, Vol 1, Issue 2.
[2] Aiman A 2014, Performance Of Solar Pond Greenhouse Heating System In Jordan, Jordan. Iosr
Journal Vol. 11, Issue 5 Ver. Ii ,Pp 30-35.
[3] Amal W Q 2016, Using Solar Evaporation Ponds For The Treatment Of The Desalination Plants Brine,
Islamic University – Gaza, Palestine, http://hdl.handle.net/20.500.12358/19373 .
[4] Mohammad R A, Hassan B T , Ali K N , Mohsen P 2015, Experimental Investigation Of Heat
Absorption Of Different Solar Pond Shapes Covered With Glazing Plastic, Iran, Solar Energy 122,569-578
[5] Balaji B 2016 Experimental Investigation On A Mixed Salt Salinity Gradient Solar Pond, International
Journal Vol 8. No.1 – Pp.252-261.
[6] Khaldoon A Mohammad A Raed B and Hisham B 2017, Establishing Small-Scale Salt Gradient Solar
Pond Experiment, Sustainable Resources Management Journal , 2(4), 01-10.
144th International Conference on Engineering Sciences (ICES 2020) IOP Publishing
IOP Conf. Series: Materials Science and Engineering 1067 (2021) 012098 doi:10.1088/1757-899X/1067/1/012098
[7] Sathish1 D, Veeramanikandan M., Thirunavukkarasu R., Tamilselvan R. and Karthickmunisamy T.
2018, Thermal Performance On Portable Mini Solar Pond Using NaCl And Coal Cinder, Vol. 877, Pp 430-
435.
[8] Ito M and Azam S 2019, Feasibility of Saline Gradient Solar Ponds as Thermal Energy Sources in
Saskatchewan, Canada, Canada, Journal of Environmental Informatics Letters 1(2) 72-80.
[9] Sogukpinar H 2020, Numerical study for estimation of temperature distribution in solar pond in diverse
climatic conditions for all cities of Turkey, Turkey, Environ Prog Sustainable Energy. 39:e13255.
[10] Osamah A H A, Anees A K, Hammed B M and Mustafa S M 2020), Solar pond as a low grade
energy source for water desalination and power generation, Renew. Energy Environ. Sustain. 5, 4,
https://doi.org/10.1051/rees/2019008.
[11] Rohan V V 2015, Design of a Solar Pond as an Energy Storage System for the Pasteurization process
in Dairy ,Sweden, International Journal of Science and Research (IJSR)
ISSN 2319-7064.
[12] Theodore L B, Adrienne S L, Incropera F, Dewitt D P 2011 Introduction to heat transfer, sixth edition,
Chapter 2, Introduction to Conduction, p (78).
[13] Renuka A P 2016 , Efficiency And Thermal Analysis Of A Salinity Gradient Solar Pond, India,
IJSRSET Vol. 2 | Issue 4 | Print Issn: 2395-1990 | Online Issn : 2394-4099.
[14] Alibakhsh K, Mohamad A, Fathollah P D 2017, Energy Analysis And Shadow Modeling Of A
Rectangular Type Salt Gradient Solar Pond , Iran, Solar Energy 146. Pp. 161-171. Issn 0038-092x.
[15] Alcaraz A, Valderrama C, Cortina J., Akbarzadeh A., Farran A 2018 Thermal Performance Of 500m2
Salinity Gradient Solar Pond In Granada, Spain Under Strong Weather Conditions, Spain, solar energy 171,
223-228.
[16] Duffie J A, Beckman W A 2013 Beckman. Solar Engineering of Thermal Processes. Fourth Edition.
Chapter 1. P(37).
15You can also read