The application of Mike Urban model in drainage and waterlogging in Lincheng county, China - PIAHS
←
→
Page content transcription
If your browser does not render page correctly, please read the page content below
Innovative water resources management – understanding and balancing interactions between humankind and nature
Proc. IAHS, 379, 381–386, 2018
https://doi.org/10.5194/piahs-379-381-2018                                                                          Open Access
© Author(s) 2018. This work is distributed under
the Creative Commons Attribution 4.0 License.

           The application of Mike Urban model in drainage and
                 waterlogging in Lincheng county, China
                      Qinghua Luan1,2 , Kun Zhang1,3 , Jiahong Liu1,3 , Dong Wang1,3 , and Jun Ma1,2
                 1 School   of Water Conservancy and Hydroelectric Power, Hebei University of Engineering,
                                                 Handan 056021, Hebei, China
                  2 Hebei Provincial Research Center of Water Ecological Civilization & Social Governance,

                                                 Handan 056038, Hebei, China
                 3 Institute of Water Resource, China Institute of Water Resources and Hydropower Research,

                                                     Beijing 100038, China
                                Correspondence: Qinghua Luan (carol97011202@163.com)

                         Received: 31 December 2017 – Accepted: 10 February 2018 – Published: 5 June 2018

       Abstract. Recently, the water disaster in cities especially in Chinese mountainous cities is more serious, due to
       the coupling influences of waterlogging and regional floods. It is necessary to study the surface runoff process
       of mountainous cities and examine the regional drainage pipeline network. In this study, the runoff processes of
       Lincheng county (located in Hebei province, China) in different scenarios were simulated through Mike Urban
       model. The results show that all of the runoff process of the old town and the new residential area with larger
       slope, is significant and full flow of these above zones exists in the part of the drainage pipeline network; and
       the overflow exists in part of the drainage pipeline network when the return period is ten years or twenty years,
       which illuminates that the waterlogging risk in this zone of Lincheng is higher. Therefore, remodeling drainage
       pipeline network in the old town of Lincheng and adding water storage ponds in the new residential areas were
       suggested. This research provides both technical support and decision-making reference to local storm flood
       management, also give the experiences for the study on the runoff process of similar cities.

1   Introduction                                                      Several studies on urban waterlogging have been carried
                                                                   out in China and abroad, and many digital hydrological mod-
                                                                   els have been applied to simulate the process of urban sur-
In the developing countries, the rapid development of econ-        face runoff and the running situation of drainage pipeline
omy, industrialization and urbanization have changed the           network (Zhou, 2014). Because Mike Urban model has com-
state of climate and underlying surface, and resulted in fre-      plete urban drainage pipeline system, a friendly version, a
quent extreme events such as rainstorms and droughts (Tu,          good linking with GIS and has been widely used for types
2014), which is especially significant in China. Furthermore,      of fields, this model was chosen by many researchers. Hlod-
in China, most of urban drainage pipeline network in the           versdottir et al. (2015) built the surface runoff and drainage
counties have not been constructed, the designed standard of       network model of the coastal area based on Mike Urban,
pipeline is low, the standards of municipal are unreasonable       and evaluated the risk of waterlogging and the net load of
and are not uniform with that of water authority (Xie et al.,      drainage pipeline in the central of the Reykjavík. Bouchenafa
2016; EWRI of ASCE, 2017), which also resulted in the in-          et al. (2014) built regional Mike Urban model of the urban
crease of urban flood disasters, especially in typical moun-       underground transportation network, simulated the water dy-
tainous cities. Therefore, it is crucial to study the mechanism    namic processes of urban subway network and improved the
of runoff generation and forecast the evolution road of urban      scheme of urban flood control.
waterlogging, especially in the typical developing mountain
cities.

Published by Copernicus Publications on behalf of the International Association of Hydrological Sciences.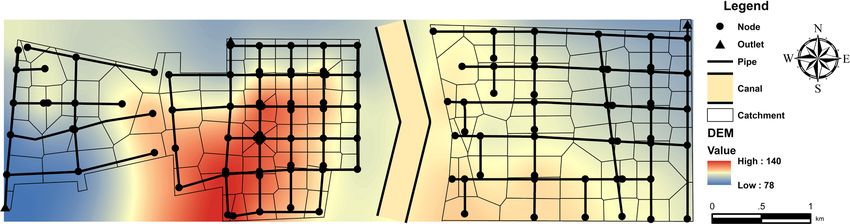
382 Q. Luan et al.: Analysis on waterlogging in Typical Mountain City
Table 1. The characteristics of designed rainfall processes.
Return Three Five Ten Twenty
period years years years years
Rainfall peak 2.42 2.70 4.00 4.56
(mm min−1 )
Total 99.60 122.60 158.20 195.60
(mm)
2.2 Drainage pipeline network
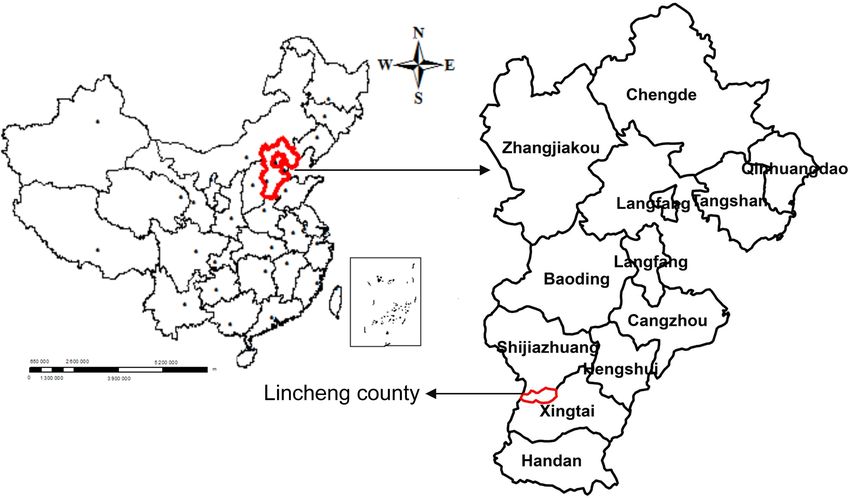
Figure 1. Study area location.
The drainage pipeline networks combining of western part
and central part is an independent system and that of eastern
part is also independent. The lengths of the drainage pipes
However, the researches on Mike Urban model in the and the elevations of the drainage wells can be got through
mountain city of semi-arid area is relatively few. So the pro- the regional construction planning. Then, through ArcGIS,
cess study of surface runoff and drainage network in moun- the drainage pipeline network was successfully digitized and
tainous area is necessary. In this study, the drainage water- the corresponding properties of the confluence nodes were
logging situation in Lincheng County in different scenar- got. In order to reduce the simulation error, the topologic re-
ios would be illustrated through Mike Urban model, which lation of the pipeline network was checked. The detailed in-
not only can illuminate the regional situation of drainage formation and data of pipeline nodes and drainage pipeline
pipeline networks under different rainwater, but also can pro- network were got through the information database of Mike
vide technology for the urban floods forecast and future wa- Urban model (Yao, 2012). Eventually, there are 120 conflu-
terlogging control. Moreover, the related results also provide ence nodes and three drainage outlets in the study area. Ac-
decision-making reference for the planning and construction cording to the statistic results, there are 121 concrete round
of drainage pipelines network in typical semi-arid mountain- pipes in total, of which the total length is about 47 738.6 m,
ous cities. and the main diameter of the pipe is 0.6, 0.8 and 1.2 m. The
elevation range of inner base of the pipeline network node is
between 77 to 133.8 m (Fig. 2).
2 Study area and data collection
2.1 Study area 2.3 Rainfall data
Lincheng County as a mountainous county is located in 2.3.1 Observed rainfall data
Hebei Province, China and in the eastern foot of Taihang The observed rainfall processes were based on the gauge
Mountain (Fig. 1). There are there geomorphic types: moun- monitoring in study area and supplied by Hebei Hydrology
tainous in the west, hilly in the middle and plain in the east, and Water Resources Investigation Bureau. Two typical pre-
with the proportions of 35, 50 and 15 % respectively. This cipitation processes (Fig. 3) were selected for model cali-
study area is the downtown of Lincheng County, covering bration and validation, which is “7.19” (19 July 2016) and
an area of about 14 km2 , has no hydraulic connection with “7.06” (6 July 2017) respectively.
the surrounding rivers. The south-north water diversion canal
through the eastern region and also has no hydraulic con-
nection with the drainage networks. The study area consists 2.3.2 Designed rainfall data
of three major parts (NORENDAR International Ltd., 2016): Due to the lack of detailed observed rainfall data, the de-
the western part is the old town, the drainage infrastructures signed rainfall processes in 24 h of three years, five years,
are old and the pipeline network is complicated; the central ten years and twenty years were calculated according to the
part is a new residential area nearby the mountain; the eastern local storm intensity formula in this research (Viglione and
part as the new urban area is the education land and industrial Blöschl, 2009; Han, 2015). In order to shorten the rain-
park under development, the green area of this part is large fall interval, the last processes of different return periods
and fields and ravines are on both sides of the road. were computed through the coupling of 24 h processes and
Chicago rainstorm formula (Cen, 1998). The rainfall peak
and total volume of the different scenarios are shown in Ta-
ble 1.
Proc. IAHS, 379, 381–386, 2018 proc-iahs.net/379/381/2018/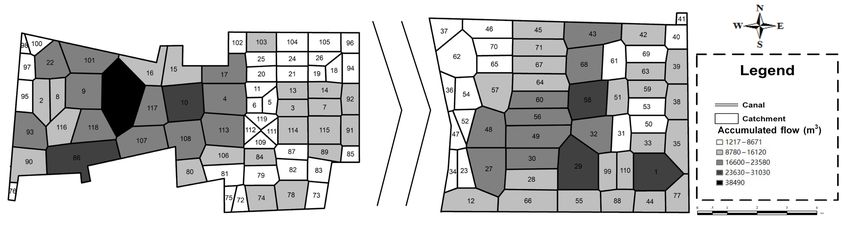
Q. Luan et al.: Analysis on waterlogging in Typical Mountain City                                                             383

Figure 2. The drainage pipeline networks of the study area.

                                                                   Table 2. The empirical parameters of Mike21.

                                                                         Parameter     Time       Drying     Flooding   Manning
                                                                                     step (s)   depth (m)   depth (m)    number
                                                                         Value             1       0.002        0.003      0.03

                                                                   spectively 20, 90, 80 and 50 % according to the local plan-
                                                                   ning (Kim et al., 2005). Secondly, the corresponding imper-
                                                                   vious percentages of each layer were set and input to the
                                                                   model. Lastly, the initial impervious percentages of each sub-
                                                                   catchment were automatically calculated through the model.
                                                                   The other model parameters were set according to the recom-
                                                                   mendation value of the model handbook and the empirical
                                                                   range of actual situation (Son et al., 2016) (Table 4).
Figure 3. “7.19” and “7.06” typical precipitation processes.
                                                                   3.3     Model calibration and verification
                                                                   In this paper, the Mike flood model coupled Mike21 and
3     Model construction                                           Mike Urban was used to simulate the surface overflowing
                                                                   process and the waterlogging situation of drainage pipeline
3.1    Sub-catchments division
                                                                   networks (DHI, 2012). The properties of buildings and roads
The sub-catchment division is based on the digitized results       and DEM were pretreated through ArcGIS and the basic
of drainage pipeline network. In Mike urban model system,          Mike21 files were completed through Mike Zero after the
the confluence node is set as the central of the sub-catchment,    basic files superposition. Through Mike model, the elevation
and the sub-catchments of study area can be automatically          of the buildings and roads were revised and the land values
divided according to Theisen polygons (USEPA, 1999; Ah-            were set in order to ensure the study area is close. The pa-
madi, 2012). Because the elevation of underlying surface in        rameters of Mike21 is empirical (Table 2) due to their insen-
the study area has significant distribution change in the space,   sitivity. Mike21 was coupled with Mike Urban through Mike
the automatic division results were checked and manually ad-       flood platform. Then, the urban pipe drainage networks were
justed according to the actual confluence situation, in order      linked with two-dimensional surface flow, which is applied
to improve the simulation accuracy. At last, the study area        for the overflow simulation. The “7.19” and “7.06” rainfall
was divided into 122 sub-catchments (Fig. 2).                      processes were chosen for model calibration and validation,
                                                                   respectively. The parameters were calibrated and validated
                                                                   through comparing with the measured water depth (MWD)
3.2    Initial value of model parameter
                                                                   and the simulated water depth (SWD) of typical runoff pro-
The parameters of the sub-catchment area were set after the        cesses. The relative error (RE) between the MWD and the
division was completed. Firstly, the underlying surface lay-       SWD was adopted as the statistical index and the simulated
ers with different land use types were loaded into the model;      results are shown that all of the REs conform with the re-
there are four types of land use in Lincheng: green area,          lated regulation (Rong et al., 2017) (Table 3). The calibrated
building area, transportation area and integrated land use,        parameters are listed in Table 4.
of which the corresponding impervious percentages are re-

proc-iahs.net/379/381/2018/                                                                      Proc. IAHS, 379, 381–386, 2018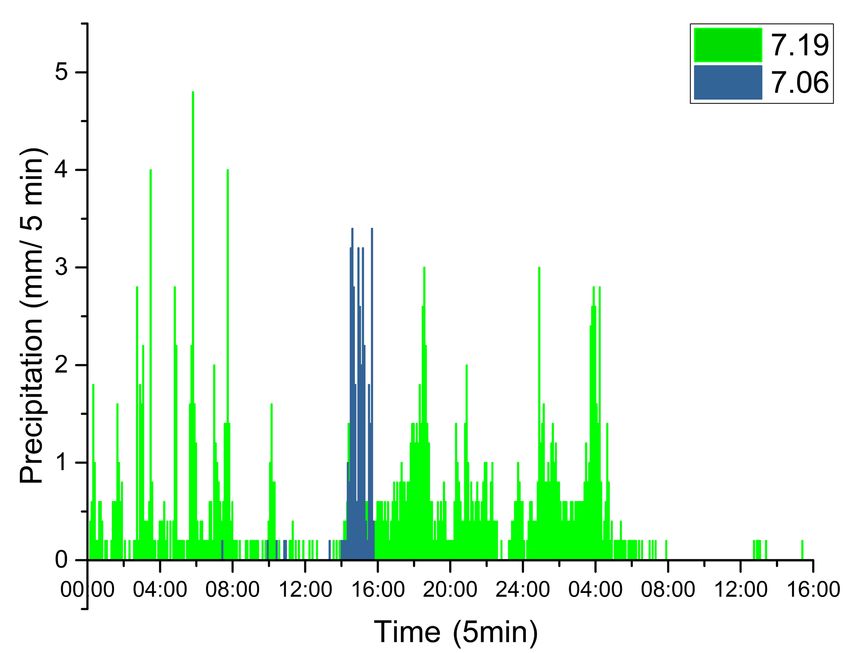
384                                                                  Q. Luan et al.: Analysis on waterlogging in Typical Mountain City

Figure 4. The regional distribution of surface accumulated flow in different sub-catchments.

Table 3. Simulated results of calibration and validation.

                      Typical process                       7.19                                   7.06
                      Node No             MWD (cm)       SWD (cm)         RE (%)    MWD (cm)      SWD (cm)       RE (%)
                      5                            10               9.3      −7             10             9.5      −5
                      62                           13              13.4      3.1             7             7.5      7.1
                      92                            8               8.9     11.3             6             6.4      6.7
                      107                          15              15.6        4            10            10.8        8

Table 4. Calibrated results of Mike urban parameters.                       ent return period appeared at 18:30. When the return period
                                                                            is twenty years, the comprehensive runoff coefficient is the
      Parameter                 Initial value   Calibrated value            largest, the value is 0.658 at 18:30. The waterlogged area in-
      Average velocity of               0.30                 0.20
                                                                            cludes 6 sub-catchments, and the surface runoff of the No. 99
      surface confluence                                                    sub-catchment in the old town area is the largest, and the peak
      Hydrological reduction             0.9                  0.9           runoff and accumulated flow of runoff during different return
      factor                                                                periods in this typical sub-catchment are shown in Table 5.
      Initial water loss             0.0006              0.0015                The regional situation of infrastructure construction com-
      Manning coefficient of          0.015               0.013             bining the distribution of surface accumulated flow in
      pipeline                                                              twenty-year return periods (Fig. 4) illustrates that the water-
                                                                            logging frequents of the old town and the joint zone between
                                                                            the old town and the new residential area are higher, because
4     Results and analysis                                                  the corresponding elevation is low, thus the confluence speed
                                                                            is fast and the surface flow duration is short. In addition, the
The designed rainfall processes in different return periods                 lack of drainage capacity in the old town and the improper
were input and then the corresponding runoff processes were                 joint between the new and old urban areas also cause severe
calculated through the calibrated model. In this study, the                 waterlogging. Although the surface runoff in some eastern
analysis of the different flood processes contains three as-                sub-catchments is large (Fig. 4), the related waterlogging sit-
pects: typical waterlogging area, pipeline network load and                 uation is better, due to the large water permeability based on
typical overflow point (SAC, 2008). Detailed analysis in                    the large green area.
different aspects can indicates the surface runoff processes
and the running state of the drainage pipeline network more                 4.2    Pipeline network load
clearly and be convenient for government to manage urban
waterlogging and drainage network construction.                             The simulated results show that in three-year return period,
                                                                            there are 17 pressured pipelines in the drainage networks,
4.1    Typical waterlogging area
                                                                            of which 3 and 14 pipelines are under full pressure and par-
                                                                            tial pressure respectively; while in twenty-year return period,
According to the simulated results, the peak runoff, accu-                  4 and 20 pipelines are under full pressure and partial pres-
mulated flow and comprehensive runoff coefficient of sub-                   sure, respectively. With the increase of the return period, the
catchment area increased slowly with the increase of rain-                  number of the pressured pipelines increases evidently, and
fall. The peak of surface runoff in the study area in differ-               the pressure and pressured duration also increase in the same

Proc. IAHS, 379, 381–386, 2018                                                                               proc-iahs.net/379/381/2018/
Q. Luan et al.: Analysis on waterlogging in Typical Mountain City 385
Table 5. Runoff characteristics in different return periods in No. 99 sub-catchment.
Return period Three years Five years Ten years Twenty years
Peak runoff (m3 s−1 ) 3.92 4.36 5.20 5.94
Maximum cumulative quantity (m3 ) 19 520.9 24 057.1 31 106.9 384 892
Comprehensive runoff coefficient 0.655 0.656 0.657 0.658
Table 6. Total numbers of pressure pipeline in different return peri- With the increase of return period, the overflow nodes
ods. number of drainage pipeline network increases, the overflow
appears earlier and the overflow duration increases. Addi-
Pressure state Three Five Ten Twenty tionally, the overflow nodes with high water level are mainly
(bar) years years years years located in the western old town due to the poor drainage ca-
Fully 3 4 4 4 pacity and low elevation; while some overflow nodes with
Partial 14 16 17 20 low water level are located in the central and eastern urban
areas. These results and analysis are both consistent with the
Total 17 20 21 24
simulated results and the corresponding analysis of waterlog-
ging and pipeline network load.
Table 7. Total overflow nodes numbers of each district in different
return periods. 5 Conclusions
Return Three Five Ten Twenty In this research, the Mike urban in Lincheng city was suc-
period years years years years cessfully constructed. The waterlogging situation of differ-
Old town 5 5 5 6 ent surface runoff processes and running state of drainage
New district 4 4 5 6 pipeline network in the study area were illuminated. The sim-
Industrial zone 3 3 4 5 ulated results show that the water logging pressure in typical
mountain part and the old town is greater than that of the
plain part and the new area. With the increase of the return
pressured pipeline. In No. 98 and No. 107 sub-catchment of period, the accumulated flow, the pressured pipeline number
the old town, their pipelines are pressured at first and un- and the overflow nodes number accordingly increase.
der pressure until the runoff ends. The pressured pipelines in The related analysis provides technical support for the
the old town account for the main of the total ones, which is early warning of urban waterlogging and construction of
consistent with the simulated waterlogging situation and the drainage infrastructures of study area, and gives references
related analysis. The pipelines nearby the outlet are also eas- for the simulation of surface runoff process in mountainous
ily pressured, due to the runoff confluence. With the duration cities.
of rainfall, the pipelines in the other areas are gradually pres-
sured. The number of pressured pipelines in different return
periods are shown in Table 6. Data availability. The data of this study came from the con-
struction planning of lincheng County. We cooperated with the
NORENDAR International Ltd. to complete the program. The
4.3 Typical overflow point content of urban planning and design is open and public in the
followed URL: http://www.lincheng.gov.cn/index.aspx?lanmuid=
The simulated results also show that the overflow firstly oc- 46&sublanmuid=539&id=642. However, the urban drainage net-
curred at the 96th node in any return period; the overflow work data involved in this study is not publicly available. In ad-
appeared earlier (about 01:00), and existed until the rainfall dition, Lincheng County is a typical mountainous city with three
ended in twenty-year return period. Both the water level and different types of urban areas, and the urban drainage networks of
the discharge of overflow in the 102th node are largest in any each type are independent. Therefore, we chose Lincheng County
return period. There are 12 overflow nodes in the study area, as the research area.
of which 5 nodes are located in the old town; and the over-
flow duration of the 96th node is about 20 h, in three-year
return period. While, there are 17 overflow nodes, of which 6 Competing interests. The authors declare that they have no con-
overflow nodes are located in the old town, and the overflow flict of interest.
duration of the 96th node is about 23 h, in twenty- year re-
turn period. The overflow nodes numbers of each district in
different return period are listed in Table 7.
proc-iahs.net/379/381/2018/ Proc. IAHS, 379, 381–386, 2018386 Q. Luan et al.: Analysis on waterlogging in Typical Mountain City
Special issue statement. This article is part of the special issue Kim, J. S., Ahn, J. H., Oh, T. S., and Moon, Y. I.: Runoff
“Innovative water resources management – understanding and bal- analysis of urban watershed using MIKE SWMM
ancing interactions between humankind and nature”. It is a result of model, J. Korea Water Resour Assoc., 38, 907–916,
the 8th International Water Resources Management Conference of https://doi.org/10.3741/JKWRA.2005.38.11.907, 2005.
ICWRS, Beijing, China, 13–15 June 2018. NORENDAR International Ltd.: Control detailed control planning
in Lincheng County, http://www.lincheng.gov.cn/index.aspx?
lanmuid=46&sublanmuid=539&id=642 (last access: 21 Febru-
Acknowledgements. We are grateful to the NSF of Hebei, China ary 2018), 2016.
(No. E2017402178), the NSFC (No. 51739011) and the NSF of Rong, M. A., Bai, T., Huang, Q., and Yang, W.: MIKE 21 model and
Hebei Education, China (No. ZD2014020). its application on urban waterlogging simulation, J. Nat. Disast.,
26, 172–179, https://doi.org/10.13577/j.jnd.2017.0420, 2017.
Edited by: Dingzhi Peng Son, A. L., Kim, B., and Han, K. Y.: A Simple and robust
Reviewed by: Meifang Ren and one anonymous referee method for simultaneous consideration of overland and un-
derground space in urban flood modeling, Water, 8, 494,
https://doi.org/10.3390/w8110494, 2016.
Standardization administration of PRC (SAC): Standard for hydro-
References logical information and hydrological forecasting (GB/T 22482-
2008), Standards Press of China, Beijing, China 11 pp., 2008.
Ahmadi, Z.: Investigation of adequacy of Masal city drainage net-
Tu, C.: Application of computer simulation of urban stormwater:
work and suggestions for improvement by using MIKE SWMM
take Seongbuk of Dayu County as an example, M.A. thesis, Nan-
model, Iranian Water Res. J., 6, 93–103, 2012.
chang University, China, 2014.
Bouchenafa, W., Mouhous-Voyneau, N., Sergent, P., and Brochet,
USEPA (United States Environmental Protection Agency): Prelimi-
J.: Study of flow in a staircase at subway station. Advances in
nary data summary of urban storm water best management prac-
Hydroinformatics, Springer, Singapore, 171–183, 2014.
tices, EPA, Washington, 214 pp., 1999.
Cen, G.: Research on rainfall pattern of urban design storm, Adv. in
Viglione, A. and Blöschl, G.: On the role of storm duration in
Water Sci., 1, 42–47, 1998.
the mapping of rainfall to flood return periods, Hydrol. Earth
DHI (Danish Hydraulic Institute): MIKE Urban User Manual, Den-
Syst. Sci., 13, 205–216, https://doi.org/10.5194/hess-13-205-
mark, 240 pp., 2012.
2009, 2009.
EWRI of ASCE: Standard guidelines for the drainage of urban
Xie, J. Q., Liao, Z. L., and Gu, X. Y.: Prediction and eval-
stormwater systems, ASCE/EWRI45-05, Reston, Va: American
uation of waterlogging in highly urbanized areas based on
Society of Civil Engineers, 60 pp., 2017.
Mike Urban: demonstrated on the example of Huoshan-Huimin
Han, J. L.: Drainage waterlogging planning of small city based on
drainage system in Shanghai, Energy Environ. Prot., 30, 44–49,
Mike Urban, M.A. thesis, Zhejiang University of Technology,
https://doi.org/10.3969/j.issn.1006-8759.2016.05.010, 2016.
China, 2015.
Yao, S. L.: Urban Drainage Systerm Modeling Research Based
Hlodversdottir, A. O., Bjornsson, B., Andradottir, H. O., Eliasson,
on Mike Flood, Ph.D. thesis, Beijing University of Technology,
J., and Crochet, P.: Assessment of flood hazard in a combined
China, 2012.
sewer system in Reykjavik city centre, Water Sci. Technol., 71,
Zhou, Q.: A Review of sustainable urban drainage systems con-
1471–1477, https://doi.org/10.2166/wst.2015.119, 2015.
sidering the climate change and urbanization impacts, Water, 6,
976–992, https://doi.org/10.3390/w6040976, 2014.
Proc. IAHS, 379, 381–386, 2018 proc-iahs.net/379/381/2018/You can also read