Mapping and Monitoring of Slum Development in Abuja, Nigeria with Satelite Remote Sensing and Geographical Information System
←
→
Page content transcription
If your browser does not render page correctly, please read the page content below

Mapping and Monitoring of Slum Development in Abuja, Nigeria with
      Satelite Remote Sensing and Geographical Information System

                    1               1                 1                          1                           1            1
   Dr. Adepoju M.O , Dr. Halilu S.A , Dr. Ozigis S.M , Dr. Mohammed S.O ., Dr. Idris I, Adeluyi S.A , Dr. Eta, J .
             1 National Space Research and Development Agency, Abuja, Nigeria, Abuja, Nigeria,

KEYWORDS: Slum, Change Detection, Remote Sensing, GIS, City Management, Classification

ABSTRACT

This paper explored the applications of an                        agencies to map Nigerian cities and evirons so as
Integrated Remote Sensing and Geographic                          to detect slum development early, rapidity of
Information Systems to efficiently map, monitor,                  growth of slum as well as providing accurate
and provide spatial intelligence to effectively                   spatial information on regular bases for planners
manage slum development in Nigeria. This will end                 to guide and manage city growth effectively
the continuos environmental degradation and
human disasters that is associated with Nigerian
settlements evolution. Abuja is one of the fastest                INTRODUCTION
growing cities in the sub-Sahara Africa. The city
lacks the modern management techniques to meet                    Rapid urban development and increasing land use
the requirement of a modern city. The city is                     changes due to government policies, increasing
known as one of the hotspot of demolition of                      population and economic growth is being
buildings in the last decade amongst the                          witnessed in Federal Capital Territory, Abuja. The
international community. Hence, the need to                       measurement and monitoring of these land use
rethink the planning approaches adopted so far. A                 changes are crucial to understand land-use and
review of urban growth in Nigeria revealed that                   land-cover dynamics over different spatial and
development is well ahead of planning leading to                  temporal time scales for effective land
ineffectiveness of planning policies and strategies.              management. Slums are neglected parts of cities
This is more prevalent in Abuja with rapid growth                 where housing and living conditions are appallingly
of shanties within and around the capital city                    lacking in basic amenities like portable drinking
which eventually led to slum clearance by total                   water, good sanitary, proper solid and liquid waste
demolition. The advances in geospatial                            disposal method, poor or total lack of accessible
technologies is aiding global efforts at mapping                  roads and many more. Slums range from high
and monitoring slum development through the use                   density, squalid central city tenements to
of improved spatial, temporal and radiometric                     spontaneous squatter settlements without legal
resolution of satellite images to achieve a                       recognition or rights, sprawling at the edge of
remarkeable success in steming the devastating                    cities. The inner city slums are usually older than
effects of demolition world-wide. The availability                the cities while the peripheral ones are fall out of
of very high resolution images provided by the                    urbanization and failure of effective planning.
new generation of satellites has made the                         This paper explored the applications of an
integration of GIS/RS for urban slum mapping and                  Integrated Remote Sensing and Geographic
monitoring not only possible but as a tool for an                 Information Systems to efficiently map, monitor,
effective management of many aspects of city life.                and to provide spatial intelligence to effectively
The NigeriaSat-2 and Ortho-rectified Spot-5 images                manage slum development in Nigeria. The
were used for identifying, mapping and monitoring                 recommendation will assist to end the continuos
of Abuja slum development. The research further                   environmental degradation and human disasters
ascertains the spatial extent of the slum                         that is associated with Nigerian settlements
settlements and compared the results obtained                     evolution. Abuja is one of the fastest growing cities
from the image. It is recommended that an                         in the sub-Sahara Africa. The city lacks the modern
integrated geospatial approach as demonstrated                    management techniques to meet the requirement
with this research is used by town planning                       of a modern city (Adepoju et al. 2006). The city is

__________________________________________________________________________
Page 69                                 International Journal of Geosciences and Geomatics, Vol. 1, Issue 2, 2013,ISSN:2052-5591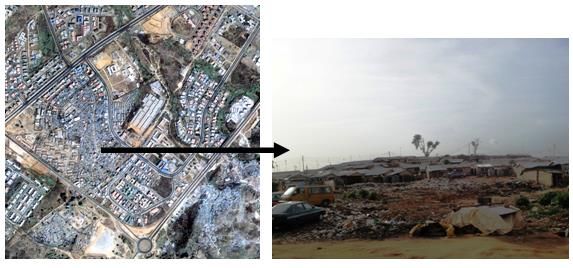
known as one of the hotspot of demolition of                    of shanties and slum both within and around the
buildings in the last decade amongst the                        capital city.
international community.
                                                                The FCC Phase 1 comprises of five (5) districts
Hence, the need to rethink the planning                         (Central, Garki, Wuse, Maitama, and Asokoro).
approaches adopted so far. A review of urban                    While Phases 2 and 3 comprises of Gudu, Wuye,
growth in Nigeria revealed that development is                  Gwarimpa, Life Camp, Utako, Jabi, Jahi district,
well ahead of planning leading to ineffectiveness               Kafe district, Gaduwa district, Dakwo district and
of planning policies and strategies. This is more               few others. These phases have experienced more
prevalent in Abuja with rapid growth of shanties                than 100% change in the last 10 years thereby
around the capital city which eventually leads to               changing the physical outlook of the Greater Abuja
slum clearance by total demolition to keep within               Metropolis. Figures 1 to 3 refers. Figures 4 and 5
the Abuja Master Plan. The advances in geospatial               shows the squalid state of one of the slum within
technologies is aiding global efforts at mapping                the metropolitan Abuja city with wide spread
and monitoring slum development through the use                 indiscriminate dumping of refuse and lack of
of improved spatial, temporal and radiometric                   essential amenities for a livable environment. The
resolution of satellite images to achieve a                     organic nature of development of Gudu village
remarkeable success in steming the devastating                  provided the impetus for the clustering of shanty
effects of demolition world-wide.                               houses that has now assume a town-size urban
                                                                slum reminiscence of all slums within the Abuja
Urban remote sensing has long been a niche                      metropolis.
aspect of modern remote sensing (Patrick Hostert,
2007) with it inherent limitations due to the
heterogenity nature of urban features such as
buildings, roads, water chanels, cars, parks and
gardens and many more. This has placed problems
and limitations to the usage of satellite imagery in
an urban areas. However, the advent of new series
of sensors technologies with tremendous
improvement on the spatial, radiometric, and
spectral resolutions in the last decade. This has
opened up many research and applications of
urban remote sensing.

STUDY AREA

Abuja is the capital of Nigeria and located on
Latitude 9° 12' North, Longitude 7° 11' East of the
Equator. Abuja has a landmass of approximately
7,330 km², of which the actual city occupies 275.3
km2. Abuja in particular and the Federal Capital
Territory in general have experienced a huge
                                                                Figure 1: Map of Abuja F.C.C overlaid with Quickbird Image
population growth within the last 3 decades. The
city has a population of about 1.5 million (NPC,
2006) currently estimated at 2.2 million in 2012.
The huge population growth is followed with
massive spatial expansion of the city in all
direction. It has been reported that some areas
around Abuja have been growing at 20 – 30% from
the 2006 population census. This study is limited
to the phase 1, 2 and 3 of the Federal Capital City
(FCC) which have witnessed a lot of developmental
activities in recent times leading to development

__________________________________________________________________________
Page 70                               International Journal of Geosciences and Geomatics, Vol. 1, Issue 2, 2013,ISSN:2052-5591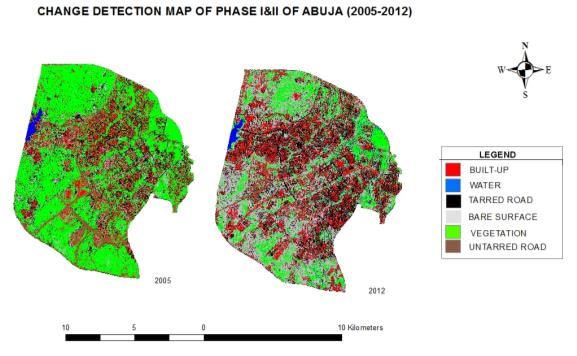
Figure 2: (right) Quickbird image of Gudu Slum (left)                      correction, geometric rectification, radiometric
Photograph of Gudu village, Abuja
                                                                           correction.
DATA                                                                       Image Co-registration
The datasets used for this research were acquired                          The image pre-processing operation is an integral
from both primary and secondary sources. The                               aspect of this study as it sought to harmonize the
primary datasets was obtained during the field                             characteristics of the images. Although both the
work exercise which includes the photographs,                              NigeriaSat-2 and Spots-5 images used in this study
GPS Coordinates, update of existing slum                                   have the same spatial resolution of 5 meters,
settlements within Abuja phase 1, 2 and 3. The                             however further efforts was made to carry out co-
ground truthing exercise was also carried out for                          registration of the images to ensure that such
accuracy assessment of the classified images of the                        characteristics like the image projection, geo-
study area. The secondary dataset used in this                             referencing and pixel size are unified to ensure
study are NigeriaSat-2 and Spot 5 high resolution                          that the final classified images conform within the
satellite imagery.                                                         same spatial extent without error to ensure
                                                                           accurate change detection of slum development.
                                                                           This operation was carried out using image to
                                                                           image correction technique in ENVI 3.2, which
                                                                           typically involve taking distinct control points from
                                                                           the two satellite images. This process ensured that
                                                                           the projection surface of the source image
                                                                           (NigeriaSat-2 image) equals areas in the output
                                                                           image (Spots 5 image). Thus a total of five (5)
                                                                           control points were taking for the rectification
Figure 3: (Left) NigeriaSat 2 Image of Abuja Phase 1 and 2                 operation and a total of 0.27 RMS error was
(Right) Spot 5 image of Abuja Phase 1 and 2                                obtained as the residual error. Figure 6 is a
                                                                           detailed flow chart used for the study.
The NigerianSat-2 image was captured November,
2012 and has a spatial resolution of 5m while the
Spot 5 has a spatial resolution of 5 meter and was
captured October 2005. Several image pre-
processing operation such as geometric
corrections through image co-registration were
carried out on the images before the supervised
classification exercise to distinguish between
planned settlement and slum settlement.

METHODOLLOGY

Maps have been used throughout the ages to aid
our visual and spatial understanding of the real
world. The advent of computer application to
mapping have grown from stages to stages, this
work adopted the most suitable methods to                                  Figure 4: Study Flowchart
achieve the study objectives using ArcGIS 10.0 and
ENVI 3.2.                                                                  Image classification

This ranges from data conversion, manipulation,                            The selection of a suitable method for
analysis and generation of other geospatial                                classification over another is not easy and this
datasets. The processing of satellite imagery was                          would ideally depend on data availability and the
semi-automated due to the advances in software                             study objectives to be pursued. In the context of
and new methodologies in image processing and                              detecting the slums, some studies have used aerial
interpretations. The acquired satellite images were                        photographs (Hurskainen and Pellikka, 2004),
pre-processed with data calibration, topographic                           semi-automatic (Stasolla and Gamba, 2007) or

__________________________________________________________________________
Page 71                                          International Journal of Geosciences and Geomatics, Vol. 1, Issue 2, 2013,ISSN:2052-5591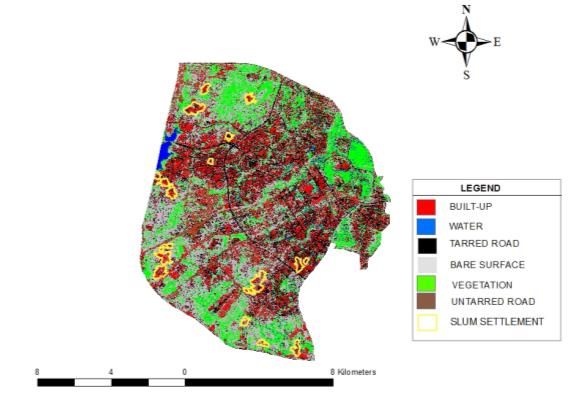
supervised classification by maximum likelihood                 which increased in 2012 to 24 km². The built-up
(Skupinski et al., 2009) as well as object based                area was further divided into two sub-classes:
approach (Rhinane, et al., 2011). For the purpose               Planned and slum, for further analysis to
of this study the supervised image classification               determine the split between these sub-divisions.
technique using the maximum likelihood algorithm
was chosen for the image classification operation
as this give the opportunity of selecting sample
sets of features used to explore the potentials of
pixel based approach on high resolution imagery.

However, a total of six (6) land cover classes were
identified and selected for the pixel training. The
rationale for this selection was based on visual
interpretation of the image, the spectral signatures
of features, reconnaissance survey carried out and
lastly the spatial coverage of features of interest
                                                                Figure 5a: Area coverage of land cover classes (2005)
on the satellite images. However, training site
selection was obtained for Built-up areas, Water
body, Tarred road, Un-tarred road, Bare surface
and Vegetation for analysis. (See figures 6a and
6b). The Image classification operation carried out
to ascertain the various land cover classes gave an
overall accuracy for the two images used in the
study.

In other to ensure that the objectives of this study
are fully met, several criteria were streamlined for
the identification and differentiation of slum
                                                                Figure 5b: Area coverage of land cover classes (2012)
settlements from planned settlement base on the
contextual and pattern depiction characteristics of
                                                                The planned area makes up the majority of the
the image. The assertion made involve the
                                                                built up area in both scenarios, in 2005, the
mediation of the characteristics that are peculiar
                                                                surface area of the planned settlements was
to both planned and slum settlement, for example
                                                                approximately 9 km² making up 57% of the total
it is a well-known fact that most planned
                                                                built-up area while in 2012 it made up 84% of the
settlements have tarred road while slum
                                                                total built-up area and had an area coverage of
settlements rarely have tarred road.
                                                                approximately 21 km².
Slum settlement are also known to be a cluster of
haphazard development while planned settlement
are areas with an organize pattern of
development. The SPOT 5 (2005) image recorded a
total of 85.1% with a Kappa coefficient of 0.80,
however, for the NigeriaSat-2 (2012) image; the
overall accuracy was 67.7% with a Kappa
coefficient of 0.62.

ANALYSIS AND RESULTS

The result of the analysis carried out to ascertain
the spatial extent of the various land cover
features and slum settlements shows that the
entire study area (Phase 1 and Phase 2 of Abuja)
covers a total area of approximately 151 km². The
built up area covers approximately 15 km² in 2005
__________________________________________________________________________
Page 72                               International Journal of Geosciences and Geomatics, Vol. 1, Issue 2, 2013,ISSN:2052-5591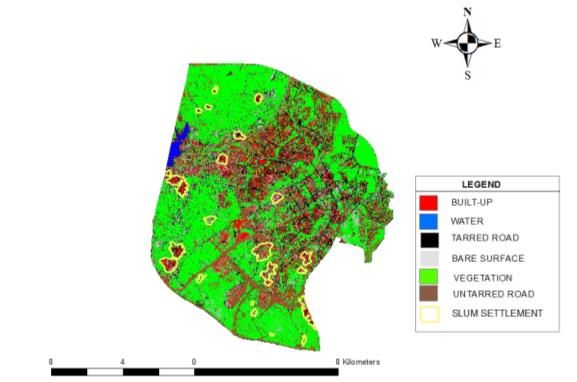
4000000
                                                                                        3000000

                                                                              Meters²
                                                                                        2000000
                                                                                        1000000
                                                                                             0
                                                                                                     PHASE 1            PHASE 2
                                                                                          AREA
                                                                                                     571502             3371490
                                                                                        COVERAGE
Figure 6a: Abuja built up area: planned and slum (2005)                   Figure 7b: Slum area coverage phase I and Phase II (2012)

                                                                          Figures 7a and 7b are bar graphs depicting the
                                                                          differences in the surface area covered by slums in
                                                                          Phase I compared to slums identified in Phase II.
                                                                          Basically, it shows that at very point in time during
                                                                          the study period, the size of the slum surface area
                                                                          in Phase I has always been small compared to the
                                                                          size of the surface area in Phase II. This trend is
                                                                          unvarying in 2005 through to 2012.

Figure 6b: Abuja Built up area: planned and slum (2012)

Figures 6a and 6b show a comparison of how
slums fared against planned settlements 2005 and
2012 respectively, as expected, the planned
settlements cover majority of the built-up land
cover class on both occasions even though in 2005,
the difference was minimal. Result showed that
planned areas made up 57% of the built-up area
and slums making up 43%. And in 2012, of the                                 Figure 8a: Slum area coverage: Phase I and Phase II (2005)
built up area, planned settlements significantly
increased to 84% while slums made up the
remaining 16% covering a surface area of
approximately 4 km². 4 km² of slums to a large
extent is a welcome development considering the
fact that in 2005, slums covered a surface area of
almost 7 km² in Abuja Phase I and II, this shows
that there has been a reduction in the slum growth
between 2005 -2012 within the study area.

                                                                             Figure 8b: Slum area coverage: Phase I and Phase II (2012)

                                                                          Furthermore, the figures show that there has been
                                                                          a decrease in the sizes of slums in both phases of
                                                                          Abuja between 2005 and 2012. In 2005, the total
                                                                          surface area of slums were approximately 0.85
                                                                          km² and 4.6 km² in Phase I and Phase II
                                                                          respectively while in 2012 phase one has had a
                                                                          reduction in size of about 0.3 km² and phase II had
                                                                          an area of approximately 3.4 km² compared to the
Figure 7a: slum area coverage phase I vs Phase II (2005)                  4.6 km² it once covered. Figures 4a and 4b show
                                                                          the comparison of the area coverage of Phase I
__________________________________________________________________________
Page 73                                         International Journal of Geosciences and Geomatics, Vol. 1, Issue 2, 2013,ISSN:2052-5591
and Phase II slums in percentages; with slums in
Phase I atoning for 16% and 14% in 2005 and 2012                          The change detection map generated (see figure
respectively while in Phase II was 84% in 2005 and                        11) shows that there has been an increase in the
86% in 2012.                                                              built up area between 2005 and 2012 which is
                                                                          largely expected in a city that is still a work in
Change Detection Analysis from 2005 – 2012                                progress. The analysis showed that 36% of the
                                                                          built-up area in 2005 remained the same in 2012
Table 1 shows the distribution of slums that were                         while 64% of it was lost to other land cover
identified within the various districts that fall                         classes; this loss was predominantly claimed by
within Phase 1 and Phase 2 of Abuja. In                                   development, with tarred and un-tarred roads
comparison, a total of 23 slums were identified in                        accounting for above 35% of the change. Most of
2005 and as at 2012 the total number of slums has                         the areas identified from the reconnaissance
reduced to 17 within the study area.                                      survey coincided with the results obtained from
                                                                          the classified image. Precision accuracy of 76% was
S/N       PHASE 1           NUMBER              NUMBER                    achieved from the classification making this
o.          &2                 OF                  OF                     method a more than recommendable approach in
          DISTRIC           IDENTIFI            IDENTIFI                  the identification of settlements (planned or
             TS                ED                  ED                     unplanned) in the urban environment.
                             SLUMS               SLUMS
                              2005                2012
1       ASOKOR                  3                   1
           O
2       DURUMI                     2                   1
3        GARKI                     2                   1
4         JABI                     4                   3
5       KATAMP                     4                   3
           E
6       KAURA                     10                   6
7      MABUSH                      1                   1                  Figure 9: Change Detection Map for Abuja Phase I & Phase II
                                                                          from 2005 -2012
            I
8       UTAKO                      1                   1
      TOTAL                       26                   17
Table 1 Slum distribution in Phase I and Phase II of Abuja (2005
& 2012)

The slums identified in 2005 show that Kaura
district has the highest number of identified slums
which amounts to 10 in total, Katampe and Jabi
come in next with 4 slums each, Durumi and and
Garki both have a total of 2 slums each, Mabushi
and Utako all house 1 slum each, while Asokoro
has 3 slums. Similarly in 2012, the number of
identified slums was noticed to have reduced in                             Figure 10a: Slum Settlement Map from SPOT 5 Image (2005)
some of the renowned district. Kaura district was
noticed to have a total of 6 identified slums; Jabi
and Katampe both have 3 slums each, while
Asokoro, Durumi, Garki, Mabushi and Utako
District all housed 1 slum each. The spatial
distribution of the slums to a large extent is
influenced greatly by the amount of planned
development that has taken place over time
thereby reducing the incidence of unplanned
development within the federal capital city (FCC)
__________________________________________________________________________
Page 74                                         International Journal of Geosciences and Geomatics, Vol. 1, Issue 2, 2013,ISSN:2052-5591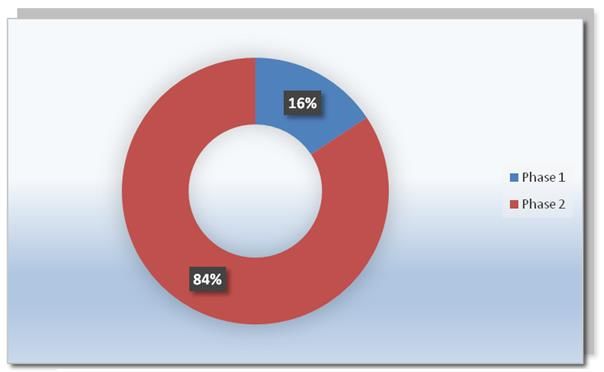
In conclusion, the information derived would be
                                                                       useful to urban planners and policy makers in the
                                                                       management of the city. It is however
                                                                       recommended that similar studies should be
                                                                       carried out nation-wide to establish the true state
                                                                       of slum development to explore the potentials of
                                                                       RS/GIS techniques in depicting the prevailing
                                                                       trends within Nigerian urban centers. The
                                                                       methodology applied in this research will be used
                                                                       in subsequent studies when socio-economic and
                                                                       other ancillary data are available.

Figure 10b: Slum Settlement Map from NigeriaSat 2 Image
(2013)                                                                 REFERENCE:

DISCUSSION AND CONCLUSION                                              Andreas Faludi, 2010. The Performance of Spatial
                                                                       Planning. Routledge Publishers. England.
The phenomenon slum is a complex issue and
poses a major challenge in many cities in                              C. Grodach and A. Loukaitou – Sideris, 2007.
developing countries. This study focused on                            Cultural Development Strategies and Urban
identifying and mapping of informal (slum)                             Revitaliztion: A survey of US cities. International
settlements in Federal capital city, Abuja, Nigeria                    Journal Of Cultural Policy. Vol. 13 Issue 4.
using RS and GIS and has demonstrated as an
effective tool in slum identification, mapping and                     D.C Okpala, 2010. Upgrading slum and squatter
monitoring. The slums settlements were identified                      settlements in developing countries: Is there a
based on the geospatial techniques as well as                          cost-effective alternative. Third World Planning
ground verification. The NigeriaSat-2 and Spot 5                       Review. Vol 2. Liverpool University Press.
imageries were utilized to detect, identify and
delineate the majority of slum settlements in the                      Kathy Arthurson, 2004. From stigma to demolition:
study area. The pixel-based classification                             Austrilian debates about housing and social
technique that was applied to locate the spatial                       exclusion. Journal of Housing and Built
spread of the slums, effectively revealed through                      environment.19: 255 – 270. Kluwer Academic
parameters such as irregular street patterns that                      Publishers. Netherlands
are mostly unpaved or absence of roads, small size
structures with high densities, less vegetation,                       Ottensmann,J.R.,1977. Urban Sprawl, Land Values
tone difference due to roof covers amongst others.                     and the Density of Development, Land Economics,
It was however found that informal settlements                         53(4):389-400.
(slum) occupied a total of 340 hectares and were
mostly found within the phase 2. This result clearly                   Mesev, T. V., P. A. Longley, Batty, M., and Y. Sie,
shows the spatial spread and the magnitude of the                      1995. Morphology from Imagery: Detecting and
problems that is associated with its monitoring,                       Measuring the Density of Urban Land Use,
management of the challenges that comes with it.                       Environment and planning A, 27:759-780.
It is obvious that Abuja slum development has
continuously re-evolves despite government                             P. Hurskainen and P. Pellikka., 2004. “Change
concerted effort at its total elimination through                      Detection Of Informal Settlements Using Multi-
demolition. It is therefore, requires a paradigm                       Temporal Aerial Pho-tographs—The Case of Voi,
shift in approach whereby slum becomes an                              SE-Kenya,” Proceedings of the 5th AARSE
integrated part of city development through the                        Conference, 18-21 October 2004, Nairobi, pp
provision of basic socio-economic amenities to
upgrade and integrated them with the main city                         G. Skupinski, D. BinhTran and C. Weber, 2009.
since it has become practically impossible to                          “Lesimages Satellites Spot Multi-Dates et la
eliminated nor even reduce the growth and spatial                      Métrique Spatiale dans L’etude du Changement
spread of the slums.                                                   Urbain Et Suburbain—Le Cas de la Basse Vallée de
                                                                       la Bruche (Bas-Rhin, France),” Cybergeo: European
                                                                       Journal of Geography, Systèmes, Modélisation,

__________________________________________________________________________
Page 75                                      International Journal of Geosciences and Geomatics, Vol. 1, Issue 2, 2013,ISSN:2052-5591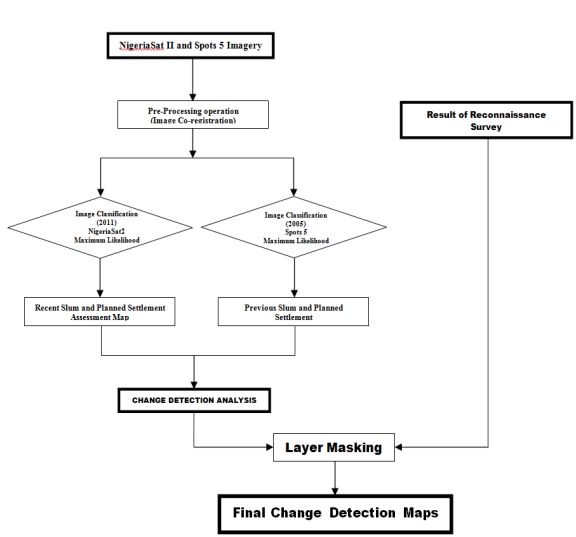
Géostatistiques, article 439, mis en ligne le 12
mars 2009, modifié le 03 juin 2009.
http://cybergeo.revues.org/index21995.html.

Bhaskaran, S., Paramananda, S., and Ramnarayan,
M. 2010. Per-pixel and object oriented
classification methods for mapping urban features
using Ikonos satellite data. Applied Geography,
30(4), 650e665

Rhinane, H., Hilali, A., Berradal, A. and Hakdaoui,
M., 2011. Detecting Slums from SPOT Data in
Casablanca Morocco Using an Object Based
Approach. Journal of Geographic Information
System,          2011,           3,        217-224
(http://www.SciRP.org/journal/jgis)

T.G Stockham, 1972. Image Processing in the
context of a visual model. IEEE Xplore Digital
Library. Vol.9, Issue 8.

M. Stasolla and P. Gamba., 2007. “Exploiting
Spatial Patterns For Informal Settlement Detection
Inarid Environments Using Optical Spaceborne
Data,” International Archives of Photogrammetry,
Remote Sensing and Spatial Infor-mation Sciences,
Vol. 36, 2007, pp.

__________________________________________________________________________
Page 76                               International Journal of Geosciences and Geomatics, Vol. 1, Issue 2, 2013,ISSN:2052-5591
You can also read