Spatial Changes in Wetland Configuration of Akure South Local Government Area of Ondo State, Nigeria
←
→
Page content transcription
If your browser does not render page correctly, please read the page content below
Urban and Regional Planning
2021; 6(3): 87-92
http://www.sciencepublishinggroup.com/j/urp
doi: 10.11648/j.urp.20210603.11
ISSN: 2575-1689 (Print); ISSN: 2575-1697 (Online)

Spatial Changes in Wetland Configuration of Akure South
Local Government Area of Ondo State, Nigeria
Omodehin Adenike Oluwakemisoye*, Basorun Joseph Omoniyi, Oyinloye Michael Ajide
Department of Urban and Regional Planning, Federal University of Technology, Akure, Nigeria

Email address:
*
    Corresponding author

To cite this article:
Omodehin Adenike Oluwakemisoye, Basorun, Joseph Omoniyi, Oyinloye Michael Ajide. Spatial Changes in Wetland Configuration of
Akure South Local Government Area of Ondo State, Nigeria. Urban and Regional Planning. Vol. 6, No. 3, 2021, pp. 87-92.
doi: 10.11648/j.urp.20210603.11

Received: June 22, 2021; Accepted: July 20, 2021; Published: July 29, 2021

Abstract: Wetlands are not wastelands as believed in time past but areas of land that play important roles in climate change
mitigation through conservation and preservation; poverty alleviation through job creation; as well as food security through
sustainable wetland agriculture. The importance of wetlands cannot be overemphasized, hence the need to use them wisely and
sustainably. However, despite the important roles played by wetlands, wetland resources are still endangered by increase in
population, rapid urbanization, mining and pollution among others. This study is aimed at examining the spatial changes in
wetland configuration in Akure with a view to providing information that will enhance sustainable development of wetlands in
the city. Remote Sensing and Geographic Information System (RS & GIS) techniques was used to do a land use classification
of the study area to determine the extent of the change in the spatial configuration of wetlands over a period of 33 years using
1986 as the base year; 1999, 2009 and 2019 as the cardinal years. The study revealed a rapid increase in built up throughout the
study period, a decline in vegetation and rock outcrop and both increase and decline of wetlands at varying times. During the
2009-2019 periods, wetlands increased substantially to 106.16 km2 which is a significant portion of the study area but with
clear indications of possible encroachment and degradation in the future if developments are not controlled. The study
therefore recommends proper monitoring and control of developments in the study area and suggests the use of wetland zones
as green belts in form of wetlands vegetation or agriculture.
Keywords: Wetlands, Sustainable Development, Wise Use, Spatial Changes, GIS

                                                                        The importance of wetlands cannot be overemphasized
1. Introduction                                                      especially in the wake of climate change; Gannaway posited
   Wetlands are marshy areas made of soil and water. They            that wetlands are vital parts of a watershed whose loss and
are places where water meets land; found from the coast to           degradation will not only affect the existence and health of an
the mountains [22], covering about 7% of the earth’s surface         individual wetland and cause local suffering, but also affects
[1]. They are not wastelands as believed in time past; but           the ecosystem as a whole and can contribute to regional and
wealth lands that play a significant role in poverty alleviation     even global environmental problems [3]. Xu, et. al
[6]. Wetland ecosystems, including rivers, lakes, floodplains        maintained that wetlands play an irreplaceable role in
and marshes provide many services that contribute to human           regulating the global climate, maintaining the global
wellbeing and poverty alleviation [5]. WWT Consulting                hydrological cycle, protecting the ecosystem diversity, and
opines that wetlands are essential for human health and              safeguarding human welfare and bringing direct economic
prosperity providing us with fresh water, ensuring our food          values to human beings [23]. Loss of wetlands will therefore
supply, sustaining biodiversity, protecting against flooding,        contribute to regional and even global environmental
and storing carbon dioxide [22]. Mohammed sees wetlands              problems. Strengthening of efforts to protect and safeguard
as the life wires to many economic activities such as crop           the world’s cultural and natural heritage is one of the targets
cultivation, fishing, livestock rearing etc [6].                     of the Sustainable Development Goal (SDG) 11 which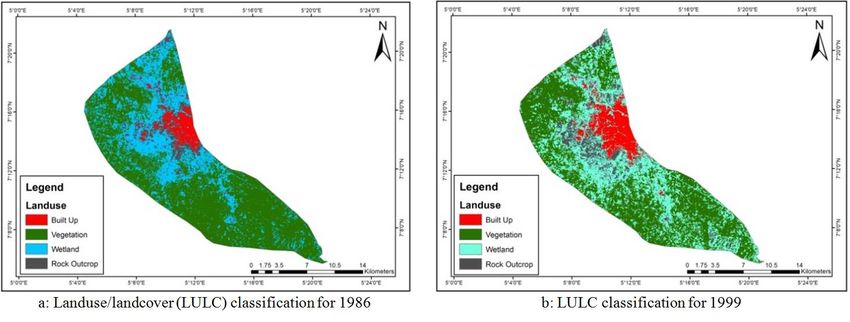
88       Omodehin Adenike Oluwakemisoye et al.: Spatial Changes in Wetland Configuration of Akure South Local Government
                                                  Area of Ondo State, Nigeria

focuses on cities with the goal that by 2030 cities and human       rivers, ponds, lakes, marshes and heavy rainfall as well as the
settlements are inclusive, safe, resilient and sustainable [19].    presence of Mangroves, salt marshes and coral reefs which
Wetlands which are natural heritage therefore need to be            form buffers that protect coastal cities during storms surges
protected, safeguarded and utilized sustainably.                    [16]. A study by Narayan, et. al. revealed that flood damages
   Wetlands can be found in strips and in large quantities all      from Hurricane Sandy worth more than $625 million was
over the earth surface covering about 28000 km2 which is            avoided because of the coastal wetlands along the east coast
about 3% of the 923,768 km2 land surface area of Nigeria [2;        of the United States (US) [8; 14].
18]. This submission is in line with that of Orimoogunje and           The ability of wetlands to hold water and nutrients makes
Tijani, et. al. on how richly endowed Nigeria is, both with         it function as a water filter that absorbs harmful toxins,
coastal and inland wetlands [12; 17]. They however went             pesticides and industrial waste from water thereby filtering
further to say that these wetlands resources are currently          the water that goes into ground water aquifers, replenishing it
being threatened by anthropogenic and bio-geophysical               and improving water quality [16]. The presence of abundant
factors such as increased population pressure, rapid                water and rich plants makes wetlands produce moist air
urbanization, mining and pollution among others. Numbere            which naturally provides a cool atmosphere and helps to
maintained that globally, more than half of the swhart of           bring relief to tropical and extremely arid regions hence
mangroves and swamps have been lost [9].                            improving urban air quality.
   In Akure, Wetlands are scattered across the town along              Ramsar opined that urban wetlands are natural green
rivers Ala and Elegbin, the two major rivers passing through        spaces where city residents can relax and enjoy access to
the city. Being an administrative city and the seat for many        nature which has the ability to improve their physical and
governmental organizations and industries in Ondo state, it is      emotional health so wetlands can be said to promote human
fast becoming urbanized and has experienced rapid increase          well-being [16]. Wetlands also attracts tourists to swim or
in its population from 71,106 in 1963 to 360, 268 in 2006 as        bird watch and serves as a source of income for wetland
recorded in the 1963 and 2006 Population Census Reports of          farmers, provides wood for building, reeds for weaving,
the National Population Commission (NPC) respectively.              plants and fruits for medicinal purposes [16].
This increasing population puts tremendous pressure on land            Ramsar states that the many benefits and services provided
availability as well as food and other social amenities in the      by wetlands are essential if the Sustainable Development
city with priority given to developers for buildings rather         Goals (SDGs) would be achieved and suggests the wise and
than for conservation or for agriculture thereby leading to         sustainable use of wetlands as critical tools for countries to
encroachment of the wetlands and consequently degradation.          achieve their SDG targets [14]. Wetlands International
   Olajuyigbe, et. al observed that quite a substantial             reported that all major global policy agreements conclude
proportion of wetlands in Akure have been committed into            that wetlands are vital ecosystems in the landscape and are
various uses including dumpsites and housing construction           indispensable to achieve a sustainable and secure world [21].
with little or no plans for conservation [10]. This                 The Ramsar’s 4th Strategic Plan (2016-2021) presents a
encroachment of wetlands could bring about environmental            vision that wetlands are conserved, wisely used, restored and
problems such as climate change, flooding, spread of                their benefits are recognized and valued by all [15].
diseases through insects breeding and various forms of                 Incorporation of wetlands in urban planning,
environmental pollution within the city. This study examines        minimising encroachment on wetlands and rehabilitating
the spatial changes in the configuration of wetlands in Akure       wetlands in cities and their surrounding landscapes
South Local Government Area of Ondo State using Remote              reduces water risks and safeguards valuable wetland
Sensing and Geographic Information System (RS & GIS)                services [21]. Ramsar recognizes that wetlands in all parts
techniques to do a land use classification of the study area to     of the world play an important role in disaster risk
determine the extent of the change in the spatial                   reduction if the wetlands are effectively managed and
configuration of wetlands over a period of 33 years using           restored where necessary [15]. Several studies have been
1986 as the base year; 1999, 2009 and 2019 as the cardinal          done on land use land cover change in Akure but only a
years, with a view to providing information that will enhance       few streamlined to the importance of conservation and
sustainable development of wetlands in Akure.                       preservation of wetlands in Akure South Local
   Literature Review                                                Government Area of Ondo State to ensure sustainability,
   Wetlands as defined by the United States Environmental           this study therefore seeks to fill in this gap.
Protection Agency (USEPA) are areas where water covers
the soil, or is present either at or near the surface of the soil   2. Method
all year or for varying periods of time during the year,
including during the growing season [20]. Wetlands can be             Being a trend analysis study, Geographic Information
coastal wetlands or inland wetlands; they include rivers,           System and Remote Sensing (GIS & RS) techniques was
lakes, floodplains and marshes and provide many services            used to do a land use classification of the study area to
that contribute to human wellbeing and poverty alleviation          determine the extent of the change in the spatial
[5]. Wetlands are found in and around cities making cities          configuration of wetlands over a period of 33 years using
liveable by their ability to absorb flood waters from storms,       1986 as the base year; 1999, 2009 and 2019 as the cardinal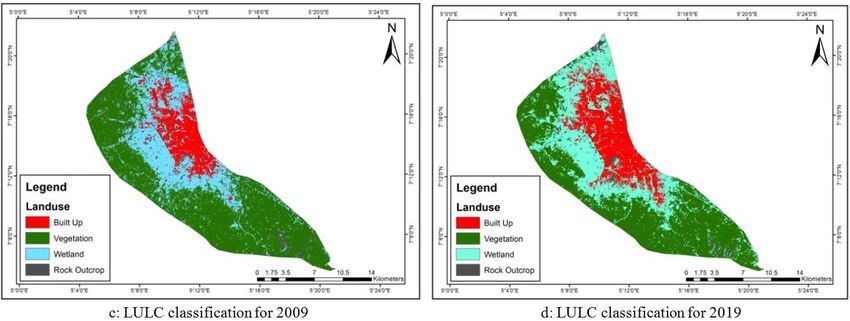
Urban and Regional Planning 2021; 6(3): 87-92                                                  89

years. The rate of change in wetlands was determined using                  3. Result
ArcGIS 10.5. The satellite imagery of the study area which is
Akure South local government area of Ondo state was                            The study revealed as shown in table 1, figures 1a, b, c, d
obtained and delineated using Google Earth Imagery, it was                  and 2 that spatial configuration of wetlands in the study area
thereafter digitized into a polygon feature class using ArcGIS              varies for the different years examined. In 1986, which is the
10.5. Landsat satellite images of the study area were acquired              base year, wetlands in the study area had a land area of 98.90
for four (4) years: Thematic Mapper (™) of 1986 and 1999;                   km2 representing 30.13% of the total land area, in 1999,
Enhanced Thematic Mapper (ETM) of 2009 and 2019. The                        wetlands configuration increased to 120.32 km2 (36.65%) and
images were made to pass through processes of image                         decreased to 90.33 km2 in 2009 (27.52%); in 2019, there was
enhancement,       geo-referencing,     re-sampling,     image              an increase to 106.16 km2 representing 32.34%. Built up had a
classification and digitization and then overlaid on the                    steady increase from 14.06 km2 (4.28%) in 1986 to 27.01 km2
spatially disaggregated land cover dataset and on the                       (8.23%) 36.78 km2 (11.20%) and 63.28 km2 (19.28%) in 1999,
historical Landsat datasets for the four (4) years with 1986 as             2009 and 2019 respectively. Rock outcrop initially had an
the base year and 1999, 2009 and 2019 as the reference years.               increase from 18.91 km2 (5.76%) in 1986 to 27.61 km2 in 1999
A supervised classification was performed on false colour                   and then experienced decrease to 15.09 km2 and 11.43 km2
composites (band 4, 5 and 7) into the four (4) land use/land                (3.48%) in 2009 and 2019 respectively. There was reduction in
cover classes which are: built-up area, vegetation, wetland                 the vegetation from 196.40 km2 (59.83%) in 1986 to 153.33
and rock outcrop.                                                           km2 in 2009, a decrease to 186.07 km2 and 147.40 km2
                                                                            (44.90%) in 2009 and 2019 respectively.

                                 Table 1. Statistical Result of Landuse/Landcover classification from 1986 to 2019.

                   1986                             1999                              2009                            2019
 Landuse/Landcover
                                                                    Percentage
 Type              Area (Km2) Percentage (%)        Area (Km ) 2
                                                                                      Area (Km ) 2
                                                                                                     Percentage (%)   Area (km2) Percentage (%)
                                                                    (%)
 Built Up               14.06    4.28               27.01           8.23              36.78          11.20            63.28      19.28
 Vegetation             196.40   59.83              153.33          46.71             186.07         56.69            147.40     44.90
 Wetland                98.90    30.13              120.32          36.65             90.33          27.52            106.16     32.34
 Rock outcrop           18.91    5.76               27.61           8.41              15.09          4.59             11.43      3.48
                        328.27   100.00             328.27          100.00            328.27         100.00           328.27     100.00

Author’s field work, 2021.

                                                             Author’s fieldwork, 2021.
                                       Figure 1. Land use land cover maps for 1986, 1999, 2009 and 2019.
90 Omodehin Adenike Oluwakemisoye et al.: Spatial Changes in Wetland Configuration of Akure South Local Government
Area of Ondo State, Nigeria
Author’s field work, 2021.
Figure 2. Statistical Result of Landuse/Landcover classification from 1986 to 2019.
all through the study years. Vegetation, Wetlands and Rock
4. Discussion outcrop had both increases and decreases in their spatial
configuration. Table 2 shows the details of the changes that
It is evident from the maps and statistical results that Built occurred within the study years which was grouped into 3
Up is the only one out of the four dominant land use and land periods; these are 1986-1999, 1999-2009 and 2009-2019
cover types examined in the study that experienced increase periods.
Table 2. Changes in area statistics of Landuse/landcover classifications from 1986 to 2019.
1986-1999 Period 1999-2009 Period 2009-2019 Period
Landuse/Land
1986 1999 Change 2009 Change 2019 Change
cover Type
Area (Km2) Area (Km2) (Km2) (%) Area (Km2) (Km2) (%) Area (Km2) (Km2) (%)
Built Up 14.06 27.01 12.95 92.11 36.78 9.77 36.17 63.28 26.5 72.05
Vegetation 196.40 153.33 -43.07 21.93 186.07 32.74 21.35 147.40 -38.67 -20.78
Wetland 98.90 120.32 21.42 21.66 90.33 -29.99 -29.99 106.16 15.83 17.52
Rock outcrop 18.91 27.61 8.7 46.01 15.09 -12.52 -45.35 11.43 -3.66 -24.25
Author’s field work, 2021.
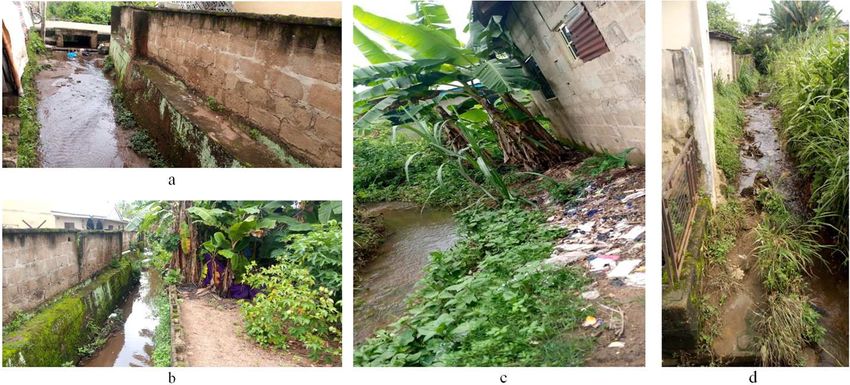
During the 1986-1999 period, built up, wetlands and rock up during the study periods.
outcrop had increase of 12.95 Km2, 21.42 Km2 and 8.7 Km2 Figures 3a, b, c and d shows as revealed from the study
respectively while vegetation had a decline of 43.07 Km2. In evidence of developments along river banks, figure 3c
the 1999-2009 period, built up and vegetation gained 9.77 shows some refuse dumped on the set back to the river.
Km2 and 32.74 Km2 respectively while wetlands and rock This shows that wetlands in the study area are being
outcrop experienced decline of 29.99 Km2 and 12.52 Km2 encroached upon.
respectively. During the 2009-2019 period, built up increased The implication of this is that when there is heavy rainfall,
again by 26.5 Km2, wetlands gained 17.52 Km2 while the water levels will rise and flow to the river banks where
vegetation and rock outcrop reduced by 38.67 Km2 and 3.66 these developments are sited leading to problems such as
Km2 respectively. flooding which could bring with it loss of lives and properties
Increase in wetlands and rock outcrop during the 1986- depending on its intensity, structural damages and loss of
1999 may be as a result of land gain from expansion of the habitat for wetland animals among others; environmental
city, while the increase in wetlands during the 2009-2019 degradation, air and water pollution. Development along the
period can be attributed to the loss of vegetation and rock river banks also implies loss of green areas in the form of
outcrop during that period especially with blasting of rocks vegetation which plays important roles in climate change
which can open up more water channels, lead to increase in mitigation, urban storm water runoff and ecosystem services
its volume and more spread to other parts. Loss of wetlands as a whole among others; cultivation of crops which can help
in the 1999-2009 period, rock outcrop in the 1999-2009 and provide food and income for the increasing population in the
2009-2019 periods and that of vegetation in the 1986-1999 study area. There is therefore a need to monitor
and 2009-2019 periods can be attributed to increase in built developments along the river banks in the area.Urban and Regional Planning 2021; 6(3): 87-92 91
Author’s field work, 2021.
Figure 3. a, b, c, d: Pictures showing development along river banks in the study area.
5. Conclusion
References
The study revealed a rapid increase in built up areas in
Akure South Local Government Area of Ondo State from [1] Cassidy, E. (2019). Map of the month: where are the world’s
wetlands? Resource watch Blog.
14.06 in 1986 to 63.28 in 2019 and gives a clear indication https://blog.resourcewatch.org/2019/04/17/map-of-the-month-
that the activities of man on the environment has brought where-are-the-worlds-wetlands/
about in the area which has led to changes in the spatial
configuration of landuse/landcover types. This expansion if [2] Dauda, A. B. (2014). Salvaging wetland ecosystem in Nigeria:
Towards ensuring sustainable fish production. Journal of
not properly monitored and controlled will lead to more Nature and Science 12 (9), 61-67.
changes through encroachment of other land uses especially
wetlands which becomes degraded thereby affecting the [3] Gannaway, N. (1995). Sustainable wetlands development.
quality of the environment. This assertion is supported by [11] Adapted from an article by Dr Sansanee Choowaew of
Mahidol University, Thailand. Tiempo 18.
who stated that the disappearance of arable lands, bare lands,
water bodies and forest reserves have impacts on [4] International Training of Trainers on Wetland Management,
environmental and landscape attributes such as the quality of (2009). Wageningen, Netherlands: Author.
air, land and water resources, poverty, access to food and [5] Millennium Ecosystem Assessment, (2005). Ecosystems and
ecosystems processes and functions. [10] also affirmed that human well-being: Current state and trends. Island Press.
wetland degradation in Akure is as a result of Urban sprawl,
expansion of roads, growth of informal settlements and non- [6] Mohammed, G. B. (2013). Living on the edge, Nigeria. World
Wetland Day (WWD) celebration organized by the Nigerian
compliance with planning regulations. Conservation Foundation Living on the Edge Project (LotE)
sponsored by Aage Jensen Charity Foundation in partnership
6. Recommendation with Birdlife International under the Wildlife Club of Africa
Phase II Project.
The study recommends that policies which will guide [7] National Population Commission of Nigeria (2006). The 1991
development of wetlands in the study area should be formed Census: Federal Republic of Nigeria.
while the Ministry of Urban and Regional Planning should
monitor and control developments enforcing strict [8] Narayan, S., Beck, M. W., Wilson, P. et al. (2017). The Value
of Coastal Wetlands for Flood Damage Reduction in the
compliance to the policies. Enlightenment programs that Northeastern USA. Sci Rep (7) 9463.
border on topics like the dangers of wetlands encroachment https://doi.org/10.1038/s41598-017-09269-z
and degradation and benefits of wetlands should be organized
for the residents. The study also recommends that wetland [9] Numbere, A. O. (2020). The impact of landscape reclamation
on mangrove forest and coastal areas in the Niger Delta,
areas be turned to green belts where there can be wetlands Nigeria in L. Loures (ed.), Landscape reclamation- Rising
vegetation or wetlands agriculture to improve the quality of from what’s left. https://doi.org/10.5772/intechopen.82053
the environment and livelihoods of the people.92 Omodehin Adenike Oluwakemisoye et al.: Spatial Changes in Wetland Configuration of Akure South Local Government
Area of Ondo State, Nigeria
[10] Olajuyigbe, A. E., Adegboyega, S. A., Popoola, O. O. & [16] Ramsar Convention Secretariat, (2018). Wetlands: Essential
Olalekan, O. A. (2016). Assessment of rapidly changing urban for a sustainable urban future. Author, accessed from
land use and environmental degradation in Akure, Nigeria www.ramsar.org/library.
using satellite imagery and GIS techniques. Journal of
Geography and Development 6 (1), 660-681. [17] Tijani, M. N., Olaleye, A. O. & Olubanjo, O. O. (2011).
Impact of urbanization on wetland degradation: A case study
[11] Omodehin, A. O. (2018). Urbanization and changes in of Eleyele wetland, Ibadan, South West, Nigeria, Proceedings
landuse/landcover patterns in Akure, Nigeria. In cities of of the Environmental Management Conference, Federal
developing nations: the Akure example. In O. B. Akinbamijo, University of Agriculture, Abeokuta, Nigeria. (pp. 438-457).
E. E. Okoko, F. K. Omole & O. O. Popoola (eds.), The Just
City: Poverty, deprivation and alleviation strategies. 218-228. [18] Uluocha, N. O. & Okeke, I. C. (2004). Implications of
YEMPET Prints Ltd. wetlands degradation for water resources management:
Lessons from Nigeria. Geojournal 16, 151-154.
[12] Orimoogunje, O., Oyinloye, R. & Soumah, M. (2009).
Geospatial mapping of wetlands potential in Ilesa, [19] United Nations (2015). Transforming our world: The 2030
Southwestern Nigeria. In Municipality and Natural Resources Agenda for Sustainable Development. A/RES/70/1.
Management working week, 2009, Surveyors key role in https://www.sustainabledevelopment.un.org
accelerated development. Eilat, Israel.
[20] United States Environmental Protection Agency (2018).
[13] Ramsar Convention Bureau, (2002). Cultural aspects of Wetlands. https://www.epa.gov/wetlands/what-wetland
wetland.
http://www.ramsar.org/sites/default/files/documents/library/co [21] Wetlands International (2020).
p10_culture_group_e.pdf. [22] WWT Consulting (2018). Good Practices Handbook for
[14] Ramsar Convention on Wetlands. (2018). Global Wetland Integrating Urban Development and Wetland Conservation.
Outlook: State of the World’s Wetlands and their Services to Slimbridge.
People. Ramsar Convention Secretariat. [23] Xu, T., Weng, B., Yan, D., Wang, K., Li, X., et al. (2019).
[15] Ramsar Convention Secretariat (2016). An Introduction to the wetlands of importance: Status, threats and future protection.
Ramsar Convention on Wetlands, 7th Ed. (previously The International Journal of Environmental Response and Public
Ramsar Convention Manual). Author. Health 16 (10): 1818. https://doi.org/10.3390/ijerph16101818You can also read