Shared electric scooter injuries admitted to Auckland City Hospital: a comparative review one year after their
←
→
Page content transcription
If your browser does not render page correctly, please read the page content below
article

   Shared electric scooter
    injuries admitted to
  Auckland City Hospital:
 a comparative review one
year after their introduction
            Matthew J McGuinness, Yvonne Tiong, Savitha Bhagvan

                                             ABSTRACT
  AIM: E-scooters were introduced to New Zealand in 2018 as a means of city transport. Since their
  introduction, their use has resulted in high injury rates. No studies have directly compared e-scooters
  to other forms of transport.
  METHOD: The Auckland City Hospital trauma registry was retrospectively searched for patients
  admitted with an e-scooter injury. A comparison group of patients admitted with an injury secondary
  to cycling during the same period was collected.
  RESULTS: 178 patients were identified: 69 with e-scooter injuries and 109 with injuries sustained while
  cycling. The hospitalisation rate for e-scooter injuries was 326 hospitalisations per million hours.
  There was a significant difference found in blood ethanol levels (18.6 vs 6.4% positive, p-value=0.01),
  mechanism of injury (isolated falls: 87 vs 60.6%), time of injury (55.1 vs 40.4% between 5pm–8am)
  and protective gear use (worn in 10.1 vs 78.9%). No differences were found in injury severity, ICU
  admissions, length of stay or mortality.
  CONCLUSION: This study demonstrates a concerningly high e-scooter-related hospitalisation rate
  and suggests e-scooters are currently not as safe as cycling. Strategies to improve e-scooter safety are
  needed and could include zero tolerance for alcohol, mandatory protective gear, restricted operating
  times and changes in road laws.

A
         n electric scooter (e-scooter) is a mi-         Multiple Auckland-based studies have
         cro-mobility device with a small elec-        investigated e-scooter-related injuries.
         tric-powered motor allowing speeds            The studies have included analysis of the
exceeding 25km/hr. E-scooter popularity has            pattern of injuries sustained, the impact
increased worldwide following the intro-               on emergency department imaging, the
duction of shared e-scooter systems in the             regional healthcare cost and the burden
US in 2017. The shared e-scooter system was            of injury.3–6 Because transport types have
first introduced to Auckland in October 2018           not been compared directly, it is currently
following the decision by the Auckland City            unclear whether e-scooters pose a higher
Council to grant a three-month trial period.1          risk of injury when compared to similar,
  Since their launch, there has been signif-           low-velocity methods of transport. The
icant media attention covering the high                aim of this study is firstly to compare
rates of accidental injuries and fatalities            e-scooter- and bicycle-related injuries
associated with their use.2 The Auckland               admitted to ACH, to determine whether
City Hospital (ACH) trauma department has              the hospitalisation rate is truly higher,
noticed a corresponding increase in admis-             and secondly to compare injury factors,
sions related to e-scooter use, and concern            injury severity and hospital-specific
has been raised accordingly.                           factors.

                                                  21
                                                                                       NZMJ 19 February 2021, Vol 134 No 1530
                                                                                       ISSN 1175-8716           © NZMA
                                                                                       www.nzma.org.nz/journal
article
Methodology gear was worn, time of injury, mode of
transport to hospital, whether an ED trauma
Study design call was placed, patient disposition, blood
A retrospective analysis of patients alcohol level, whether an operation or a
admitted between 15 October 2018 and 15 radiological intervention was required,
October 2019 (the study period) was under- discharge destination and mortality. Para-
taken. Two groups, an e-scooter group metric data, including age, were analysed
and comparison group, were defined. using a Student t-test. Non-parametric data,
The e-scooter group included any patient including ISS, TRISS and length of hospital
admitted with an injury caused while and ICU stay, were analysed using Mann–
riding an e-scooter. The comparison group Whitney U test. The null hypothesis was
included patients admitted with an injury rejected when the p-value was less than
sustained while riding a bicycle in the same 0.05.
time period.
Data collection Results
The ACH trauma registry was retrospec- The ACH trauma registry contained 178
tively searched for injuries in the two groups patients injured while riding e-scooters or
defined above. The ACH trauma registry is a bicycles during the study period. Of these,
database that was established in 1994. The 69 were admitted with e-scooter related
trauma department collects data prospec- injuries and 109 were admitted with injuries
tively on all admitted trauma patients. As sustained while riding a bicycle. 60 e-scooter
of 31 December 2019, there were 35,821 injuries (87%) were confirmed to have
patients in this database. Additional data occurred while on a ride-share e-scooter and
was collected from clinical notes, discharge in 9 (13%) patients it was unclear if this was
summaries and electronic records. This data a ride-share or personal e-scooter.
included patient demographics, mechanism
of injury, use of protective gear, time of
Group demographics
Table 1 shows a breakdown of demo-
injury, mode of transport to hospital, emer-
graphic by group. There was no significant
gency department (ED) management, patient
difference found for sex between groups.
disposition, Injury Severity Score (ISS),
71.3% of the study population were male,
Trauma and Injury Severity Score (TRISS),
and a similar male predominance was seen
blood alcohol level, treatment details, length
in both groups: 69.6% of the e-scooter group
of hospital and intensive care unit (ICU) stay,
and 73.4% of the cyclists. The median age
discharge destination and mortality.
of each group was significantly different:
Auckland Transport was contacted to the median age of the e-scooter group was
provide data regarding the number of 31, and the median age for cyclists was
e-scooter trips during the study period. 47 (p-value 0.002). A significant ethnicity
During the study period, Auckland Transport difference was found (p-value 0.001).
were evaluating the licencing of e-scooter
rentals and therefore were collecting data Injury factors
from the three operational shared e-scooter The mechanism of injury was significantly
services: Lime, Flamingo and WAVE. different between the two groups (p-value
Auckland Transport provided the data used 0.002), as seen in Table 2. There were more
as the denominator to calculate the hospital- isolated falls in e-scooter riders (87 vs 60.6%
isation rate. for cyclists) and less collisions (11.6 vs 35.8%
for cyclists). Protective gear was seldom
Data analysis worn in the e-scooter group (10 vs 78.9%
Data was coded and entered into IBM SPSS for cyclists, p-valuearticle
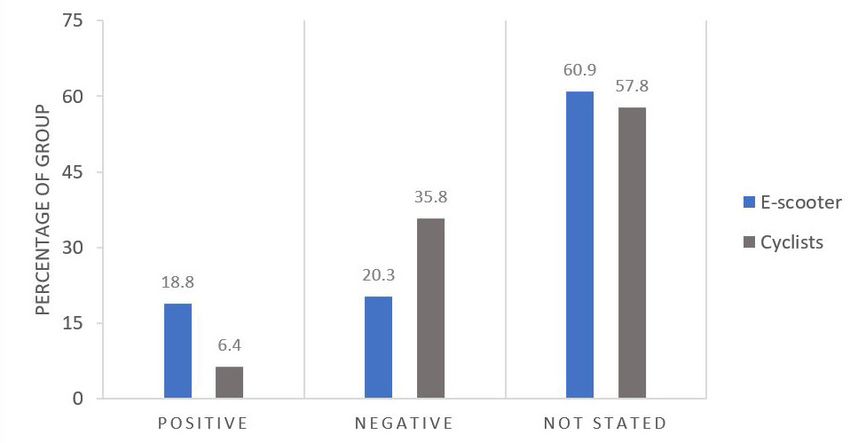
patients and 44.2% of cyclists. Of those group, with one death in the e-scooter
tested, there was a significant difference in group and two in the cyclist group (p-value
the number of patients who were positive 0.846). The need for operative intervention
for any detectable level of alcohol on testing: was similar in the two groups: intervention
48.1% in the e-scooter group and 15.2% in was required in 62.3% of patients in the
cyclists. (p-value 0.01). As seen in Figure e-scooter group and 48.6% in the cyclist
1, 18.8% of the e-scooter group and 6.4% group (p-value 0.074).
of cyclist tested positive for ethanol. All
Hospital-specific factors
those who tested positive in the e-scooter
Similar modes of transport to hospital
group were over the legal driving limit of
were seen between the two groups. There
50mg/100ml of ethanol, and all but one in
was no difference in the rate of ambu-
the cyclist group who tested positive were
lance transfer for e-scooter riders (65.2
over the same legal limit for driving. In both
vs 64.2% for cyclists) or rate of private
groups, alcohol-related injuries predomi-
vehicle transfer (24.6 vs 21.1% for cyclists).
nantly happened between the hours of 5pm
There was a significant difference in the
and 8am: 76.9% in the e-scooter group and
number of hospital emergency trauma calls
85.7% in cyclists.
placed (10.1 vs 26.6% for cyclists, p-value
Injury severity and inpatient care 0.025). The admitting team was signifi-
As seen in Table 3, there were no statisti- cantly different between the two groups,
cally significant differences found between with more e-scooter riders admitted under
the two groups in any of the outcomes orthopaedics (73.9 vs 62.4% of cyclists),
collected to measure injury severity. The and more cyclists admitted under the
median ISS was 5 in the e-scooter group trauma service at 28.4% compared with
and 9 in cyclists (p-value 0.097) and median 13% of the e-scooter group (p-value 0.021).
TRISS was 0.994 in both groups (p-value No difference in discharge destination
0.130). There was no difference in median or planned patient follow-up (including
inpatient length of stay or intensive general practice, orthopaedics, hands
care unit admission rate. There was no service, neurosurgery, concussion clinic or
difference in number of deaths in each other) was found.
Table 1: Group demographics.
E-scooter (%) Cyclists (%) Total (%) p-value
69 109 127
Age 0.002
Median 31 47 42.5
IQR 23 23 26
Sex 0.675
Male 48 (69.6%) 79 (72.5%) 127 (71.3%)
Female 21 (30.4%) 30 (27.5%) 51 (27.8%)
Ethnicity 0.001
Caucasian 39 (56.5%) 90 (82.6%) 129 (72.5%)
Māori 4 (5.8%) 3(2.8%) 7 (3.9%)
Pacific Island 2 (2.9%) 3 (2.8%) 5 (2.8%)
Asian 20 (29%) 8 (7.3%) 28 (15.7%)
Other 4 (5.8%) 5 (4.6%) 9 (5.1%)
23
NZMJ 19 February 2021, Vol 134 No 1530
ISSN 1175-8716 © NZMA
www.nzma.org.nz/journalarticle
Figure 1: Blood alcohol test results by group.
Table 2: Injury factors by group.
E-scooter (%) Cyclists (%) Total (%) p-value
Mechanism of injury 0.002
Isolated falls 60 (87%) 66 (60.6%) 126 (70.8 %)
Collisions 8(11.6%) 39 (35.8%) 47 (26.4%)
Other 1 (1.4%) 4 (3.7%) 5 (2.8%)
Protective geararticle
Figure 2: Trend in number of admissions in 3-month time periods.
Table 3: Injury severity and inpatient care by group.
E-scooter (%) Cyclists (%) p-value
Injury severity score 0.097
Median 5 9
IQR 5 8
Trauma and injury severity score 0.130
Median 0.994 0.994
IQR 0.012 0.026
Length of ward stay 0.556
Median 3 3
ICU admission 0.296
Number of admissions 2 (2.9%) 7 (6.4%)
Number of deaths 0.846
Fatality 1 (1.4%) 2 (1.8%)
Number of operations 0.074
Operation 43 (62.3%) 53 (48.6%)
25
NZMJ 19 February 2021, Vol 134 No 1530
ISSN 1175-8716 © NZMA
www.nzma.org.nz/journalarticle
Hospitalisation trend Studies published locally and around
As seen in Figure 2, the study period was the world have consistently found a lack
divided into four quarters. A decreasing of protective gear in hospitalised e-scooter
number of admissions in both groups was patients.3,13–15 This study supports these
seen over the study period. findings, with only 10.1% of the patients
found to have been wearing protective
Hospitalisation rate gear. Comparatively, 78.9% of cyclists
The hospital-admission rate for e-scooter wore protective gear. It is a legislative
accidents during the study period was calcu- requirement for a cyclist in New Zealand
lated as 326 hospitalisations per million to wear a helmet—a requirement that is
hours spent on an e-scooter and 115.5 supported by literature that show wearing
hospitalisations per million e-scooter trips. a helmet significantly reduces the severity
This was calculated using data provided by of injuries.16,17 Although no study to date
Auckland Transport (1,674,575 shared-use has looked at the use of protective gear and
e-scooter trips recorded during the study its impact on injury severity in e-scooters,
period, with an average trip length of 455 it is conceivable the results would mirror
seconds).7,8 Unfortunately, similar data were the reduction in severity seen in injuries
not available for the cyclists, so we were sustained while cycling. This is especially
unable to calculate the hospitalisation rate pertinent given craniofacial injuries are
for cyclists. common in e-scooter accidents and carry
significant morbidity.15
Discussion The blood alcohol levels of patients
E-scooters are a cheap and environmen- admitted to ACH are only routinely tested if
tally friendly way to travel short distances a trauma call is activated. Otherwise, blood
in cities. However, the high reported crash alcohol levels are tested at the discretion
rates and the absence of relevant transport of the treating physician. Less than half
laws, have raised major concerns for the of patients admitted in both groups were
safety of the general public. Although the tested for blood alcohol, which has likely
majority of the e-scooter injuries are treated resulted in an underrepresentation of the
and discharged from ED, patients admitted true percentage of alcohol-related injuries
for e-scooter injuries add a burden to our in the data. Despite this, there were almost
public health system.9 Becker et al estimated twice as many alcohol related injuries in the
that, following the introduction of a shared e-scooter group. The association between
e-scooter system to Auckland, the cost of e-scooter injuries and alcohol has been seen
the first seven months was approximately in national and international studies, and
$1,303,155.5 this association may in part account for
The hospitalisation rate for e-scooter the high hospitalisation rate.3,14 Toxicology
injuries was calculated as 326 hospitalisa- results were not examined, but illicit drugs
tions per million hours spent on an may be a factor leading to injury. Kobayashi
e-scooter and 115.5 hospitalisations per et al found positive urine toxicology in 31%
million e-scooter trips. Tin et al found of their US e-scooter cohort.18
that, for cyclists in the Northland–Auckland E-scooter injuries were more likely to
region between 2003 and 2007, the hospital- happen between the hours of 5pm and 8am,
isation rate was 78 per million hours whereas cyclists were more likely to be
spent cycling.10 This comparison suggests injured between 8am and 5pm. Variation
a greater than four-fold higher risk of by weekday was not examined in our study;
injury from e-scooters in the Auckland however, a peak in the time of injury—5pm
region. Only two additional studies were on Friday to Sunday night—was noted by
identified that reported a hospitalisation Vernon et al.19 This peak in presentations, at
rate with a trip denominator for cyclists. a time when ED is already busy, may place
Teschke et al reported a hospitalisation additional strain on the hospital. Given the
rate of 6.22 per million trips for cyclists in novelty of e-scooters in Auckland, e-scooters
Canada, and Blaizot et al reported a rate of are likely more often used for recreation
4.43 per million trips for cyclists than for commuting, and vice versa in the
in France.11,12 comparison group.
26
NZMJ 19 February 2021, Vol 134 No 1530
ISSN 1175-8716 © NZMA
www.nzma.org.nz/journalarticle
The lack of protective gear and higher ACH is one of the four hospitals servicing
positive blood ethanol rates in e-scooter Auckland City. The hospital covers the
riders was not reflected in a higher ISS or central business district and almost all areas
TRISS on comparison, as would be expected. where e-scooters were available for public
This is possibly due to the significant use. However, patients presenting to the
difference in mechanism of injury between other Auckland hospitals are not captured in
the two groups, with more isolated falls the data. Therefore, this study likely under-
in e-scooter riders and more collisions in estimates the hospitalisation rate, as the data
cyclists. Collisions, compared with isolated only includes injured patients presenting to
falls, are associated with an increased blunt ACH. Auckland’s paediatric hospital was not
force and injury severity and, in this study, included in this study, because e-scooters
were predominantly cyclists traveling at are prohibited for use by persons under the
high speeds.20 The over representation of age of 18. Despite this, paediatric injuries
isolated falls is possibly due to the inexpe- should be investigated in the future because
rience of e-scooter riders and the influence paediatric injuries have been observed in
of alcohol. A study from the Austin Public areas with similar prohibitions.24 This study
Health Department after the introduction only evaluates patients admitted with an
of a shared e-scooter system found that 33% injury while operating an e-scooter and does
of people in their study group were injured not include non-rider injuries. Blomberg
on their first time riding an e-scooter.21 The et al found 17% of patients presenting to
trend of decreasing admission rates over hospital with an e-scooter related injury
the study period is expected and coincides were non-riders. This group, who were
with the change of season from summer to often elderly patients sustaining moderate
winter.22 The decrease in admissions in the to severe injuries, are not captured in this
e-scooter group may in part be due to people dataset.25
gaining more experience and, subsequently, In conclusion, this study demonstrates a
becoming less prone to injury. However, this concerningly high e-scooter-related hospital-
will need further investigation. isation rate, compared to the hospitalisation
The limitations of this study include the rate for cyclists. The high hospitalisation
inability to directly compare the hospital- rate found in this study suggests e-scooter
isation rate between the two groups, because transport is currently not as safe as cycling.
a cyclist group denominator (million hours Shared e-scooter systems are becoming
spent or number of trips on a bicycle) commonplace in many cities across New
could not be collected. Tin et al’s study used Zealand, and therefore investigation is
to provide a comparison hospitalisation required to understand this difference.
rate for cyclist sets only an estimate of the Strategies to improve e-scooter safety are
current injury rate per million hours spent needed and could include zero tolerance
cycling. It studied Auckland and Northland for alcohol consumption, laws regarding
together and the data was gathered between protective gear, restrictions on using
2003 and 2007. Between 2015 and 2018, e-scooters after 5pm and changes in road
Auckland City Council invested $200 million laws.
in cycle lanes and road safety campaigns,
which likely resulted in a lower injury rate
than previously reported.23
27
NZMJ 19 February 2021, Vol 134 No 1530
ISSN 1175-8716 © NZMA
www.nzma.org.nz/journalarticle
Competing interests:
Nil.
Author information:
Matthew J McGuinness: General Surgical Registrar,
Auckland City Hospital, New Zealand.
Yvonne Tiong: Trauma Fellow, Trauma Service,
Auckland City Hospital, New Zealand.
Savitha Bhagvan: General and Trauma Surgeon, Trauma Service,
Auckland City Hospital, New Zealand.
Corresponding author:
Matthew J McGuinness, General Surgical Registrar, Auckland City Hospital. New Zealand,
+64 21 038 5481, Auckland City Hospital, 2 Park road, Grafton, Auckland, New Zealand, 1023
Matt@McGuinness.net.nz
URL:
www.nzma.org.nz/journal-articles/shared-electric-scooter-injuries-at-auckland-city-hospi-
tal-a-comparative-review-one-year-after-their-introduction
REFERENCES
1. Rental e-scooter trial, related orthopaedic Bicycling injury hospital-
Provisional Strategic surgery. NZMJ 30 August isation rates in Canadian
Evaluation. Auckland 2019, Vol 132 No 1501. jurisdictions: analyses
City Council. Available at: ISSN 1175-8716 examining associations
aucklandcouncil.govt.nz. 7. Rental e-scooter trial with helmet legislation
[Accessed 6 April 2020] 2.0 Results, evaluation and mode share. BMJ
2. Williams C. 23-year-old and recommendations. Open. 2015;5(11):e008052.
man dies after being Auckland City Council. Published 2015
injured in lime e-scooter Available at: https://www. Nov 2. doi:10.1136/
accident. 2019; Available aucklandcouncil.govt. bmjopen-2015-008052
at: https://www.stuff.co.nz/ nz/licences-regulations/ 12. Blaizot S, Papon F, Haddak
auckland/115979599/ report/rental-e-scooter-tri- MM, Amoros E. Injury
23yearold-man-dies-af- al-2.0-evaluation-report. incidence rates of cyclists
ter-being-in- pdf [Accessed 6 April 2020] compared to pedestrians,
jured-in-escooter-accident. 8. Sim P, Martin L, Palalagi car occupants and powered
[Accessed 6 April 2020] M. Auckland Transport. two-wheeler riders, using a
3. Brownson AB, Fagan PV, [email communication] medical registry and mobil-
Dickson S, Civil ID. Electric Re: E-scooter and cycle ity data, Rhône County,
scooter injuries at Auck- data request. [received France. Accid Anal Prev.
land City Hospital. N Z Med 12 May 2020] 2013;58:35-45. doi:10.1016/j.
J. 2019;132(1505):62-72. aap.2013.04.018
9. Campbell A, Wong
Published 2019 Nov 8. N, Monk P, Munro J, 13. Trivedi TK, Liu C, Antonio
4. Mayhew L, Bergin C, IMpae Bahho Z. The cost of ALM, et al. Injuries Associ-
of e-scooter injuries on electric-scooter related ated With Standing Electric
Emergency Department orthopaedic surgery. N Z Scooter Use. JAMA Netw
imaging. Journal of Medical Med J. 2019;132(1501):57- Open. 2019;2(1):e187381.
imaging and radiation 63. Published 2019 Aug 30. Published 2019 Jan 4.
Oncology. 63 (2019) 461-466 doi:10.1001/jamanet-
10. Tin ST, Woodward A,
workopen.2018.7381
5. M.N.Z Bekhit , J. Le Fevre , Thornley S, Ameratunga
C. Bergin . Regional health- S. Regional variations 14. Puzio TJ, Murphy PB,
care costs and burden of in pedal cyclist inju- Gazzetta J, et al. The
injury associated with ries in New Zealand: electric scooter: A surging
electric scooters. Injury, safety in numbers or new mode of transporta-
https://doi.org/10.1016/j. risk in scarcity?. Aust tion that comes with risk
injury.2019.10.026 N Z J Public Health. to riders. Traffic Inj Prev.
2011;35(4):357-363.doi:10.1111/ 2020;21(2):175-178. doi:10.1
6. Alex Campbell, Nicole
j.1753-6405.2011.00731.x 080/15389588.2019.1709176
Wong, Paul Monk, Jacob
Munro, Zaid Bahho. The 11. Teschke K, Koehoorn 15. Trivedi B, Kesterke MJ,
cost of electric-scooters M, Shen H, Dennis J. Bhattacharjee R, Weber
28
NZMJ 19 February 2021, Vol 134 No 1530
ISSN 1175-8716 © NZMA
www.nzma.org.nz/journalarticle
W, Mynar K, Reddy LV. 2020;10.1007/s10140- Auckland plan 2050.
Craniofacial Injuries Seen 020-01783-4. doi:10.1007/ available at: https://www.
With the Introduction s10140-020-01783-4 aucklandcouncil.govt.
of Bicycle-Share Electric 20. Cripton PA, Shen H, nz/plans-projects-pol-
Scooters in an Urban Brubacher JR, et al. icies-reports-bylaws/
Setting. J Oral Maxillofac Severity of urban cycling our-plans-strategies/auck-
Surg. 2019;77(11):2292- injuries and the relation- land-plan/Pages/default.
2297. doi:10.1016/j. ship with personal, trip, aspx [accessed 6 April 2020]
joms.2019.07.014 route and crash charac- 24. Ishmael CR, Hsiue PP, Zoller
16. Land Transport (Road teristics: analyses using SD, et al. An Early Look
User) Rules 2004, rule four severity metrics. BMJ at Operative Orthopaedic
11.8 [New Zealand] Open. 2015;5(1):e006654. Injuries Associated with
17. Olivier J, Creighton P. Published 2015 Electric Scooter Accidents:
Bicycle injuries and Jan 5. doi:10.1136/ Bringing High-Energy
helmet use: a systematic bmjopen-2014-006654 Trauma to a Wider
review and meta-analysis 21. Austin Public Health. Audience. J Bone Joint
[published correction Dockless electric scoot- Surg Am. 2020;102(5):e18.
appears in Int J Epidemiol. er-related injuries study. doi:10.2106/JBJS.19.00390
2017 Feb 1;46(1):372]. Int J Epidemiology and disease 25. Blomberg SNF, Rosenkrantz
Epidemiol. 2017;46(1):278- surveillance unit. April OCM, Lippert F, Collatz
292. doi:10.1093/ije/dyw153 2019 [online] Available at: Christensen H. Injury
18. Kobayashi LM, Williams https://www.austintexas. from electric scooters in
E, Brown CV, et al. The gov/sites/default/files/files/ Copenhagen: a retrospec-
e-merging e-pidemic Health/Epidemiology/ tive cohort study. BMJ
of e-scooters. Trauma APH_Dockless_Electric_ Open. 2019;9(12):e033988.
Surg Acute Care Open. Scooter_Study_5-2-19.pdf Published 2019 Dec
2019;4(1):e000337. [accessed 6 April 2020] 22. doi:10.1136/
Published 2019 Aug 22. Tin Tin S, Woodward bmjopen-2019-0339886
29. doi:10.1136/ A, Robinson E, Amer-
tsaco-2019-000337 atunga S. Temporal,
19. Vernon N, Maddu K, Hanna seasonal and weather
TN, Chahine A, Leonard effects on cycle volume:
CE, Johnson JO. Emergency an ecological study. Envi-
department visits resulting ron Health. 2012;11:12.
from electric scooter use in Published 2012 Mar 8.
a major southeast metro- doi:10.1186/1476-069X-11-12
politan area [published 23. Auckland City Council.
online ahead of print, 2020 Making Auckland more
May 5]. Emerg Radiol. cycle friendly. The
29
NZMJ 19 February 2021, Vol 134 No 1530
ISSN 1175-8716 © NZMA
www.nzma.org.nz/journalYou can also read