The economic impact of air taxes in Europe - European Economic Area - www.pwc.co.uk - Airlines for Europe
←
→
Page content transcription
If your browser does not render page correctly, please read the page content below
www.pwc.co.uk

               The economic
               impact of air
               taxes in Europe
               European
October 2017
               Economic Area
The economic impact of air taxes in Europe: European Economic Area
Contents
Executive Summary 3
Background to the study 4
Background 4
Air passenger taxes in the European Economic Area 4
Modelling Approach 6
Results 8
Impact on regional real GDP 8
Impact on employment 9
Impact on regional aviation sector GVA 10
Impacts on passenger numbers 11
Impact on national tax income 11
Appendix 1: Economic theory of indirect taxes 14
Appendix 2: Aviation tax rates in the European Economic Area 16
Glossary 17
2The economic impact of air taxes in Europe: European Economic Area
Executive Summary
This report is part of a broader set of reports commissioned by Airlines for
Europe in which PricewaterhouseCoopers LLP (PwC) provide an
independent overview of the current air passenger taxes in Europe and an
assessment of their economic impact. In this report we simulate the
scenario of abolishing air passenger taxes across the European Economic
Area (EEA) using a Computable General Equilibrium model.
45.3 million
additional arrivals by 2020
25 million
extra inbound tourist arrivals by 2020
€12.5 billion
additional tourism expenditure by 2020
€25 billion €4.3 billion 110,000
higher GDP across the EEA larger air sector per year by additional jobs across the
per year by 2030, rising from 2030, rising from €3.5 billion EEA economy in 2030, rising
€12 billion per year in 2020. per year in 2020. from 47,000 in 2020
Nearly full fiscal return
We estimate that total passenger taxes will raise €6 billion in 2017. Following the
abolition of all taxes, our analysis suggests that for every 97% of this will be recouped in
indirect tax income. This result is higher than we generally found when modelling
unilateral reductions in passenger tax, and will induce significant other benefits to the
economies of countries in the EEA. This is in line with the aims of the European
Commission’s Aviation Strategy for Europe, which aims to use aviation to stimulate
economic growth and connectivity.
3The economic impact of air taxes in Europe: European Economic Area
Background to the study
Background
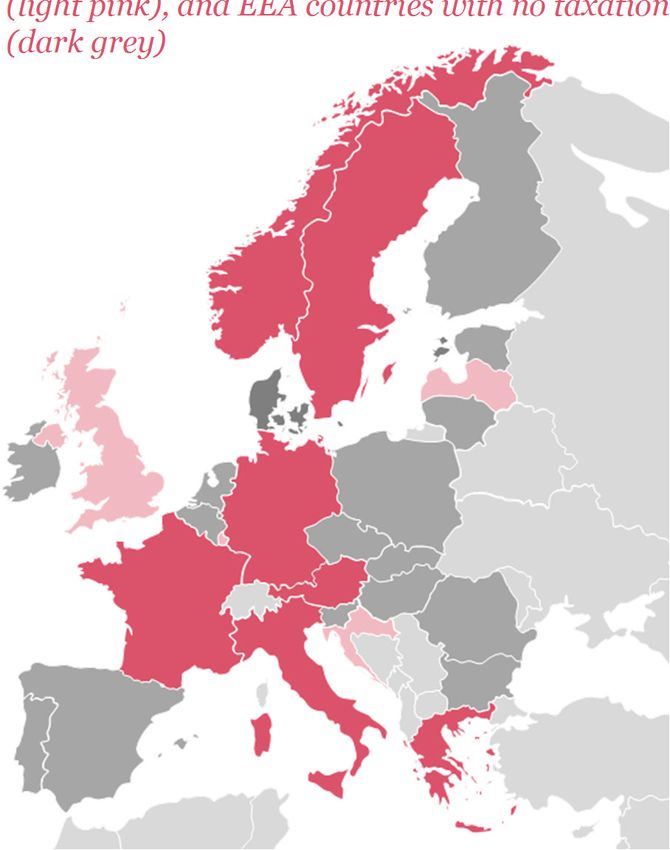
PwC have been commissioned by Airlines for Europe, the Figure 2 Location of the 7 country reports (dark
representative body of various European airlines, to pink), countries with taxes but not under analysis
provide an overview of the current aviation taxes in Europe (light pink), and EEA countries with no taxation
and an assessment of their economic impact. Whilst the (dark grey)
consortium commissioned and financed the work, and
commented on draft reports, the final reports represent the
independent analysis of PwC.
We have produced 7 country reports which summarise the
economic impact of a change in the level of air passenger
tax, as projected by our multi-regional CGE model. This
includes reports on the effect of reducing passenger tax in
6 countries (Austria, France, Germany, Greece, Italy and
Norway) and a report on the effect of introducing
passenger tax in Sweden in line with the proposal due to
be implemented in 2018.
In addition to this we are producing a Europe level report,
for which we model the effect of a multilateral abolition of
air passenger tax in the 7 countries analysed in country-
level reports, as well as Latvia, Croatia, and Luxembourg.
This forward-looking analysis is complemented by 3 case
studies (Ireland, Netherlands and Italy) in which we
analyse the effects of historic changes in passenger tax.
This analysis builds upon analysis undertaken by PwC in
2013 to assess the economic impact of Air Passenger Duty
(APD) on the UK.1 This analysis considered the potential positive impact of abolition of APD in order to aid an
evidence-based assessment of the policy, and its contribution to UK public finances. This report found that
abolishing APD would lead to a net positive gain to public finances through the economic activity it would
stimulate, and accordingly concluded that such a tax cut would pay for itself.
Air passenger taxes in the European Economic Area
Air passenger taxation varies across Europe, in both the level and method of application. For the purpose of this
study we have defined a passenger tax as one which is paid to federal government for revenue-raising purposes,
as opposed to offsetting the cost of a service provided, as aligned to the IATA List of Ticket and Airport Taxes
and Fees. The 10 countries in the EU/EEA with some form of passenger tax are as follows: 2
Austria – Air Transport Levy
Croatia – Civil Aviation Authority Tax
France – Civil Aviation Tax, Solidarity Tax, Fiscal Tax (Corsica)
Germany – Air Transport Tax
1 PwC 2013, The Economic Impact of Air Passenger Duty. The analysis was subsequently updated in 2015.
2 Latvia, Luxembourg, Croatia and the United Kingdom are included in our model but will not have country-level reports.
4The economic impact of air taxes in Europe: European Economic Area
Greece – Airport Development Charge
Italy – Council City Tax
Latvia – Passenger Service Charge
Luxembourg – Passenger Service Charge
Norway – Air Passenger Tax
UK – Air Passenger Duty
The taxes are not easily compared between countries, as some taxes vary by destination country, others vary by
airport, and some include transfers as well as departures. Nevertheless, Figure 3 benchmarks the rates across
the European Economic Area against each other by including all different rates, regardless of how the taxes are
banded. The dark grey dashes pick out the tax rates payable in each country, while the light grey bars show the
range. The full breakdown of taxes in each country can be found in Appendix 2. The graph shows how both the
range and level of taxation varies across these countries, but it is important to note that many charge no taxes
and so do not feature in the diagram.
Figure 3: Benchmarking analysis of air passenger tax rates in the European Economic Area
€180
€160
€140
€120
€100
€80
€60
€40
€20
€0
Range of tax rates Tax rates
Source: IATA, PwC analysis
In this report we take a holistic view of European passenger taxes. We model the case in which passenger taxes
are abolished across all 10 of the above countries. Our estimates suggest that these taxes will raise around €6
billion in 2017 combined for the 10 countries in our assessment. Our simulations start in January 2017 and
model the economic impacts out to 2030, with the abolition taking effect in January 2018.
We recognise that the multilateral abolition of air passenger tax across EEA in 2018 is not a realistic scenario.
However, in the context of the European Commission’s Aviation Strategy for Europe, we believe it is fruitful to
understand the maximum economic benefit which could be unlocked through the removal of the tax. For
example, the modelling helps illuminate how the benefit of a harmonised tax system would be distributed. This
5The economic impact of air taxes in Europe: European Economic Area
is important in light of the European Commission’s strategic priorities: tapping into growth markets and
tackling limits to growth in the air and on the ground.3
Modelling Approach
To assess the economic impact of passenger taxes in Europe, we have built a multi-regional Computable
General Equilibrium (CGE) model which captures the net economic impact of policy changes. This net analysis
accounts for changes and displacements in the economy as it moves to a new equilibrium following the policy
intervention.
CGE models are used by institutions such as the IMF, World Bank, OECD and several national governments to
quantify the economic impact of policy changes. In essence, a CGE model captures the economic behaviours
and interactions of all agents (consumers, producers, government, investors, etc.) in the economy. After a policy
change (such as the abolition of air passenger taxes), these economic agents adjust to price changes until
equilibrium is restored. A CGE model can be used to compare the differences between the baseline and policy
shock scenarios to evaluate the economic impact.
Figure 4: High level structure of our multi-regional CGE model
Global level
We have developed a multi-regional, dynamic CGE model
for Europe. Each country of interest is captured individually
within the model, with all other countries combined into
“Rest of Europe” and “Rest of EEA” regions.
Country level
Within each country there is a Government sector, a
household sector, and an industry sector. In CGE models,
Government, households and businesses engage in repeated
local microeconomic interactions. These in turn give rise to
macroeconomic relationships affecting variables such as
employment, investment and GDP growth.
Industry level
In order to apply a tax change to the aviation specifically,
we have separated this sector from the general Trade &
Transport sector. The sectors we have chosen to model for
these preliminary results are listed to the right. Underlying
each sector is GTAP data regarding the extent to which each
sector in each country trades with each other sector.
3 European Commission 2015, An Aviation Strategy for Europe
6The economic impact of air taxes in Europe: European Economic Area
Table 1: Types of impact captured by the CGE model
Impact type Description
Direct GVA and employment directly attributable to changes in output in the aviation sector
GVA and employment contribution attributable to any upstream business activities directly
Indirect
associated with the aviation sector
GVA generated through consumer spending by those directly or indirectly employed by the
Induced
aviation sector and connected businesses.
The broader economic contribution of the aviation sector through stimulating changes in tourism
Catalytic
expenditure and international connectivity
The model allows us to capture different types of impact. As the CGE model captures all changes in the
economy simultaneously, these impact types cannot be broken out individually. We refer to economic impacts
through changes in the level of Gross Value Added (GVA) at both a sectoral and national level. GVA is a
measure of the value of goods and services produced which, at a national level, is broadly comparable to GDP.
The model has been calibrated with Eurostat data to create a baseline view of the European economy.
7The economic impact of air taxes in Europe: European Economic Area
Results
We have modelled the impact of our two scenarios on key macroeconomic indicators, the results of which are
outlined in this section. This section is intended to provide an overview of the key results from our analysis. For
a deeper look into the mechanisms driving the results we refer the reader to PwC’s UK APD study.4
Our results are underpinned by a number of assumptions, and rely upon a long run growth rate in the European
Economic Area of 2%. A growth rate lower than this could lead to different results in absolute or cash terms, but
we would not expect the overall conclusions of the study to be materially affected.
Impact on regional real GDP
Following the abolition of all taxes in the EEA, real GDP increases by 0.07% in 2018, equal to around €10.5
billion. This uplift over the baseline is sustained in both relative and absolute terms over the following years,
growing to 0.13% or €24.9 billion per year by 2030.
Figure 5: Impact on real GDP compared to base level from the abolition of air taxes in the European
Economic Area (percent change from the base case on right-hand axis, and impact in € on left-hand axis)
€30bn 0.14%
0.12%
€25bn
GDP will be
0.10%
€20bn
0.08%
€24.9bn
€15bn larger per year
0.06% by 2030 by
€10bn abolishing all air
0.04%
passenger taxes
€5bn 0.02%
€0bn 0.00%
2017 2018 2019 2020 2021 2022 2023 2024 2025 2026 2027 2028 2029 2030
Full (€) Full (%)
This increase in GDP is reflected across all sectors of the EEA economy, with all experiencing a positive impact
as a result of the tax abolition. The aviation sector experiences the most pronounced uplift in output, growing
0.87% (over €4.3 billion) larger than our forecast baseline in the full abolition scenario in 2020.
All other sectors of the economy are positively impacted by the abolition of the tax, with the improvement over
the annual baseline in 2030 presented in Table 2.Table 2: Impact on real GDP by sector compared to base level
from the full abolition of air taxes in the European Economic Area (change from the base case) The level of
change over the baseline varies between sectors, for example, increases in output range from 0.06% in the
utilities and construction sector to 1.40% in the tourism sector. Typically, the sectors which benefit most
substantially from the tax cut, beyond those directly affected, will be those which are the biggest consumers of
air transport as a share of their total purchases. Following the tax change, one would typically expect the market
price of air transport to fall, and hence those businesses for whom air transport makes up a substantial share of
their spending will stand to benefit most materially.
4 PwC 2013, The Economic Impact of Air Passenger Duty
8The economic impact of air taxes in Europe: European Economic Area
Table 2: Impact on real GDP by sector compared to base level from the full abolition of air taxes in the
European Economic Area (change from the base case)
Full 2030
Agriculture &
0.09% €4,390m
manufacturing
Utilities & construction 0.06% €470m
Transport 0.10% €3,719m
Aviation 0.87% €4,302m
Financial Services 0.07% €866m
Tourism 1.40% €5,400m
Other services 0.05% €5,714m
Total €24,862m
The change in GDP presented above is driven by changes in income for both capital and households (i.e.
increased profits and wages). Household income increases more than capital initially as labour moves into the
aviation sector to support its growth, before capital is accumulated over the medium term. In this context,
capital’s contribution to GDP rises from 21% of the total change in GDP in 2018 to 43% in 2030.
Figure 6: Impact on capital and labour income compared to base level from the full abolition of air taxes in
the European Economic Area (absolute change from the base case)
€30bn
€25bn
€20bn
€15bn
€10bn
€5bn
€0bn
2017 2018 2019 2020 2021 2022 2023 2024 2025 2026 2027 2028 2029 2030
Capital - Full (€) Labour - Full (€)
The additional household income is either saved or consumed. In 2020 we estimate that consumption will
increase by €7.1 billion, implying a marginal propensity to consume of 0.8.
Impact on employment
Under the scenario that air passenger taxes across the EEA are fully abolished, around 40,000 jobs will be
created in the year following the implementation, and a total of 110,000 jobs will be created by 2030. These
jobs are spread across sectors and countries, though the majority of the increases will be found in sectors
related to tourism and in the countries that abolish their taxes.
9The economic impact of air taxes in Europe: European Economic Area
Figure 7: Impact on total national employment compared to base level from the abolition of air taxes in the
European Economic Area (change from the base case)
120,000 0.04%
0.04%
47,000
100,000
0.03%
80,000
0.03% additional jobs
will be created
60,000 0.02%
within two years
0.02% of abolishing all
40,000
air passenger
0.01%
20,000
taxes
0.01%
0 0.00%
2017 2018 2019 2020 2021 2022 2023 2024 2025 2026 2027 2028 2029 2030
Full Full (%)
Impact on regional aviation sector GVA
The value of goods and services produced in the EEA’s aviation industry is forecast to be 0.87% larger than the
baseline forecast in 2018 if all air passenger duties were to be abolished, adding more than €3.4 billion to the
sector. The relative size of the uplift is maintained over the period under analysis, and GVA is €4.3 billion larger
per year than the baseline by 2030.
Figure 8: Impact on aviation GVA compared to base level from the abolition of air taxes in the European
Economic Area (percent change from the base case on right-hand axis, and impact in € on left-hand axis)
€5bn 1.0%
0.9%
€4bn 0.8%
The aviation sector
0.7%
would grow
€3bn 0.6%
€2bn
0.5%
0.4%
0.87%
0.3% following the
€1bn 0.2% abolition of all air
0.1% passenger taxes
€0bn 0.0%
2017 2018 2019 2020 2021 2022 2023 2024 2025 2026 2027 2028 2029 2030
Full (€) Full (%)
10The economic impact of air taxes in Europe: European Economic Area
Impacts on passenger numbers
The CGE modelling approach captures the wider macroeconomic effects of the
changes in tax rate. It is not able to provide a route-level analysis of the aviation
sector, and accordingly it captures demand and capacity constraints only at an
industry-wide level. However, if it is assumed that an increase in economic output of
45m
the aviation sector manifests itself in an increase in passenger numbers, then full additional
abolition of all air passenger taxes could add around 16.1 million arrivals per year in arrivals by 2020
2020 over a baseline of 674 million (an increase of 2.5%). This would mean an by abolishing all
additional 45 million arrivals over the three years following the abolition (i.e. by
2020). air passenger
taxes
Of these passengers, we estimate that there will be an additional 9 million tourists
who fly per year in 2020, totalling 25.4 million passengers in the period to 2020.
These additional passengers will originate from both outside the EEA and within, affecting the economy
differently. Passengers from outside the EEA will inject money into the region’s economy that would otherwise
have been spent elsewhere, contributing to its GDP across all sectors and supporting an increase in
employment. We estimate that these passengers will spend a total of €3.5 billion in the three years to 2020, and
the total effect on the economy will be a multiplier of this due to catalytic and indirect effects. Lower prices will
also increase intra-EEA travel, which may increase consumer expenditure, further improve connectivity and the
flow of knowledge within the region, and support trade. We forecast that these passengers will increase tourism
expenditure by around €8.9 billion by 2020, raising the total additional expenditure to €12.5 billion, although
this calculation includes tourists that may have otherwise used other means of transport to travel. However,
lower prices may also lead to some citizens of the EEA taking trips outside of the region, leading to money
flowing out of the economy which will offset some of the benefits that arise from the increase in arrivals.
These results are supported by the analysis in the case studies on Ireland, Italy, and the Netherlands. The case
studies showed that growth in passenger numbers slowed following the introduction of a tax, and increased
once it had been abolished. The case studies also emphasise the flexibility with which low-cost airlines relocate
their routes around the European aviation market and the relevance of supply-side as well as demand-side
factors in driving passenger numbers.
Impact on national tax income
Whilst countries will no longer receive tax revenue from air passenger taxes after it is abolished, the tax cut will
stimulate wider improvements in macroeconomic performance, including in employment, productivity, wages,
and consumption. This will lead to an increase in revenue from labour taxes, social security contributions,
product taxes, and profit taxes, offsetting the loss in direct tax revenue. According to our analysis, all of these
tax revenues will increase as a result of the abolition, with labour taxes increasing the most, followed by social
security contributions and product taxes, while profit taxes will rise the least.
11The economic impact of air taxes in Europe: European Economic Area
Figure 9: Impact on tax income compared to base level from the full abolition of air taxes in the European
Economic Area (absolute change from the base case)
€12bn
€10bn
€8bn
€6bn
€4bn
€2bn
€0bn
2017 2018 2019 2020 2021 2022 2023 2024 2025 2026 2027 2028 2029 2030
Labour Taxes Social security contributions Product taxes (exc. Imports) Profit taxes
97% of tax cut is recouped, mainly from labour taxes, social security & product taxes
Of the €6.36 billion that the EEA would have received in air passenger taxes in 2020, €6.2 billion is recouped in
indirect tax revenue.5 The implied fiscal return on air passenger tax in the region is 0.97, meaning that a €1.00
cut results in a €0.97 increase in indirect tax income. This result is higher than we generally found when
modelling unilateral reductions in passenger tax, as seen in Table 3.
Table 3: Fiscal return from a unilateral abolition of air passenger tax in each of the countries analysed
Country Fiscal return
Austria 0.80
France 1.00
Germany 1.08
Greece 0.97
Italy 0.80
Norway 0.77
United Kingdom 1.10
The fact that the fiscal return is higher in the case of a multilateral shock implies that the total net economic
spill overs within the EEA are positive. On a national level, spill overs will affect the size of the fiscal return, and
may have a positive or negative impact on any specific country. For example, fewer German citizens would use
5 It is important to note that this is our central case and is subject to a number of assumptions around the impact of tax on
the wider economy. As such it is possible that the abolition of the aviation tax may have a differing impact on productivity,
trade, and tourism than our analysis suggests, which would result in a different level of recuperation and economic impact.
12The economic impact of air taxes in Europe: European Economic Area
Austrian airports if both Germany and Austria abolished their aviation taxes than if only Austria abolish its tax.
Spill overs would also impact the economies of countries that did not have a passenger tax to abolish. For
example, more people may choose to fly to Ireland from Germany as a result of a tax cut in Germany, which
would create jobs in Ireland and ultimately increase Irish tax revenue.
It is not possible to determine the exact distribution of the spill overs on each country in EEA. In the individual
country reports we argued that the domestic impact of abolishing passenger tax is large and positive. Above we
have argued above that the total net spill over effects are positive, therefore there is reason to favour a
multilateral approach to reducing air passenger taxes in the EEA.
13The economic impact of air taxes in Europe: European Economic Area
Appendix 1: Economic theory of
indirect taxes
The tax system plays a crucial role in influencing the rate of short and long-term economic growth in the
economy. In aggregate, the amount of tax raised, the type of tax raised, and its interaction with public spending
will affect the long-term growth rate of the economy. However, individual tax policy measures are less likely to
augment the rate of economic growth for any sustained period as they are smaller in scale, but they can affect
the level of GDP.
Indirect taxes, such as air passenger taxes, create distortions in the market by increasing the price of the good
or service to which the tax is charged (in this case, flights), leading businesses and households to adjust their
behaviour to avoid paying the tax, resulting in a lower quantity sold. By reducing the amount purchased,
consumers are worse off – the extent to which is defined as a deadweight loss of taxation6. We explain this
concept with use of a supply and demand curve framework (see Figure 10 below).
The equilibrium price and quantity that prevails in the market for the product or service in question (i.e. a flight
ticket) is determined by the intersection of the market demand and supply curves. However, with the
application of an indirect tax (i.e. the respective air passenger tax), the quantity consumed in the market is
represented by point Q1 in Figure 10: Deadweight loss (as marked in yellow) caused through application of
indirect tax. Once the tax is removed, the market supply curve shifts downwards by the amount of the tax. The
equilibrium price for consumers is now lower (P0), so they demand more of the product and as a result, the
consumer surplus (a measure of consumer welfare) grows from Area 1 to Areas 1, 2 and 3. At the same time, the
price received by the producer rises to P0 from P1-tax and the producer surplus (a measure of producer welfare)
increases from Area 6 to Areas 4, 5 and 6. The Government loses some revenue as its portion of the consumer
and producer surplus is removed (Areas 2 and 3), however the overall level of welfare in the economy grows –
represented by Areas 3 and 5 and known as the deadweight loss.
Figure 10: Deadweight loss (as marked in yellow) caused through application of indirect tax
Supply curve (with tax)
Supply curve (no tax)
1
P1
2 3
Po
5
4
P1 - Tax
6
Demand curve
Q1 Q0 Quantity consumed
6 ‘Intermediate Microeconomics: A Modern Approach’, 8th Edition, Hal. R. Varian (2010).
14The economic impact of air taxes in Europe: European Economic Area
A common measure of the deadweight loss is the amount of GDP forgone per unit of revenue raised. As an
example, if the deadweight loss were to be 0.5, this would be as 50 cents of GDP lost per €1 of tax revenue
raised. Governments set tax policy to balance the need to minimize the deadweight loss to society with the
imperative to use the proceeds of taxation to provide goods that would otherwise be underprovided by a free
market and to correct other market failures.
The size of this deadweight loss is determined by both static and dynamics factors. In terms of static
determinants, the absolute level of the tax imposed and the steepness of the supply and demand curves. In the
case of the former, the higher the tax rate the further the supply curve shifts up in response and the associated
deadweight loss becomes larger. For the latter, a steeper demand or supply curve reflects more inelastic supply
and demand conditions in the market, and means that supply or demand is relatively insensitive to changes in
price. Dynamic determinants include the extent to which air passenger tax acts as a tax on business inputs and
the extent to which improving business air usage has a positive impact on GDP by boosting productivity.
15The economic impact of air taxes in Europe: European Economic Area
Appendix 2: Aviation tax rates in the European
Economic Area
Country Tax Rate Notes for Figure 3
Short haul €7
Austria Air Transport Levy Medium haul €15
Long haul €35
EU €4.48
Civil Aviation Tax
Non-EU €8.06 Pink dashes within Figure 3 are
Economy: €1.13 shown as the sum of the Civil
EU
France Business: €11.27 Aviation Tax and Solidarity Tax.
Solidarity Tax
Economy: €4.51 Fiscal Tax (Corsica) is excluded from
Non - EU
Business: €45.07 Figure 3.
Fiscal Tax (Corsica) €4.57
EU and EFTA €7.47
Countries not included in the EU and
Germany German Air Transport Tax with a distance of not more than €23.32
6,000km
Other countries €41.99
Greece Airport Development Charge € 12 to Hellenic Civil Aviation Authority
Rome airport €7.50
Italy Council City Tax
Other airports €6.50
Latvia Passenger Service Charge €3.10
Luxembourg Passenger Service Charge €3.79
Norway Air Passenger Tax NOK 82
Within EU SEK 60 Figure 3 shows the proposed rates
Sweden N/A Less than 6000km SEK 250 from January 2018.
More than 6000km SEK 400
Economy: £13
Less than 2000 miles
United Business: £26
Air Passenger Duty
Kingdom Economy: £73
More than 2000 miles
Business: £146
16The economic impact of air taxes in Europe: European Economic Area
Glossary
Computable General Equilibrium A model used by governments and international organisations to
model simulate the effect of changes in policy or other external factors.
Gross Value Added The total value of goods and services produced in a specific sector
or area of the economy
Deadweight Loss The loss in the level of welfare/efficiency in the economy when the
equilibrium for a good or service is not achieved.
Passenger tax We have defined a passenger tax, as opposed to a charge, as being
raised by a government body for the purpose of raising revenue,
rather than covering a specific cost
Passenger charge A charge is a fee levied by a private body and charged on a per
passenger basis
Producer Surplus The difference in the price between the amount a producer is
willing to receive for a unit (e.g. a seat on a plane) and the amount
the producer does in fact receive
Consumer Surplus The difference between a consumer’s willingness to pay and the
amount the consumer actually paid
17You can also read