Halcón Resources Investor Presentation
February 28, 2018
←
→
Page content transcription
If your browser does not render page correctly, please read the page content below
Halcón Resources Investor Presentation February 28, 2018
Forward‐Looking Statements
This communication contains forward‐looking information regarding Halcón Resources that is
intended to be covered by the safe harbor for "forward‐looking statements" provided by the
Private Securities Litigation Reform Act of 1995. Forward‐looking statements are based on
Halcón Resources’ current expectations beliefs, plans, objectives, assumptions and strategies.
Forward‐looking statements often, but not always, can be identified by words such as
"expects", "anticipates", "plans", “forecasts,” “guidance”, "estimates", "potential", "possible",
"probable", or "intends", or where Halcón Resources states that certain actions, events or
results "may", "will", "should", or "could" be taken, occur or be achieved. Statements
concerning oil, natural gas liquids and gas reserves also may be deemed to be forward‐
looking in that they reflect estimates based on certain assumptions, including that the
reserves involved can be economically exploited. Statements regarding pending acquisitions
and dispositions or possible acquisitions and dispositions are forward‐looking statements;
there can be no guarantee that acquisitions or dispositions close on the terms or within the
timeframe described, if at all. Forward‐looking statements are subject to risks and
uncertainties which could cause actual results to differ materially from those reflected in the
statements. These risks include, but are not limited to: operational risks in exploring for,
developing and producing crude oil and natural gas; uncertainties involving geology of oil and
natural gas deposits; the timing and amount of potential proceeds from planned divestitures;
uncertainty of reserve estimates; uncertainty of estimates and projections relating to future
production, costs and expenses; potential delays or changes in plans with respect to
exploration or development projects or capital expenditures; health, safety and
environmental risks and risks related to weather such as hurricanes and other natural
disasters; uncertainties as to the availability and cost of financing; fluctuations in oil and
natural gas prices; risks associated with derivative positions; inability to realize expected
value from acquisitions, inability of our management team to execute our plans to meet our
goals; shortages of drilling equipment, oil field personnel and services; unavailability of
gathering systems, pipelines and processing facilities; and the possibility that laws,
regulations or government policies may change or governmental approvals may be delayed
or withheld.

Additional information on these and other factors which could affect Halcón Resources'
operations or financial results are included in Halcón Resources’ reports on file with the SEC.
Investors are cautioned that any forward‐looking statements are not guarantees of future
performance and actual results or developments may differ materially from those expressed
in forward‐looking statements. Forward‐looking statements are based on assumptions,
estimates and opinions of management at the time the statements are made. Halcón
Resources does not assume any obligation to update forward‐looking statements should
circumstances or such assumptions, estimates or opinions change.

                                                                                                2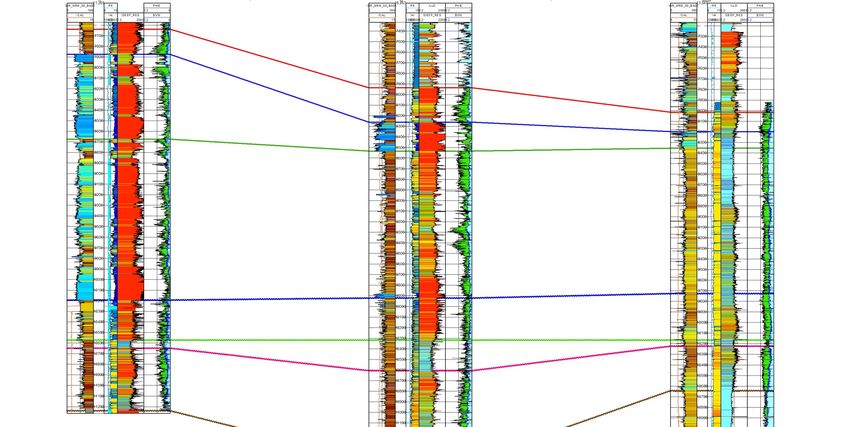
Cautionary Statements
The SEC requires oil and gas companies, in their filings with the SEC, to disclose proved reserves, which are those
quantities of oil and gas, which, by analysis of geoscience and engineering data, can be estimated with reasonable
certainty to be economically producible—from a given date forward, from known reservoirs, and under existing
economic conditions (using unweighted average 12‐month first day of the month prices), operating methods, and
government regulations—prior to the time at which contracts providing the right to operate expire, unless evidence
indicates that renewal is reasonably certain, regardless of whether deterministic or probabilistic methods are used
for the estimation. The SEC also permits the disclosure of separate estimates of probable or possible reserves that
meet SEC definitions for such reserves. These estimates are by their nature more speculative than estimates of
proved reserves and are subject to greater uncertainties and, accordingly, the likelihood of recovering those
reserves is subject to substantially greater risks.
We may use the terms “resource potential” and “EUR” in this presentation to describe estimates of potentially
recoverable hydrocarbons that the SEC rules prohibit from being included in filings with the SEC. These are based on
the Company’s internal estimates of hydrocarbon quantities that may be potentially discovered through exploratory
drilling or recovered with additional drilling or recovery techniques. These quantities do not constitute “reserves”
within the meaning of the Society of Petroleum Engineer’s Petroleum Resource Management System or SEC rules
and are subject to substantially greater uncertainties relating to recovery than reserves. “EUR,” or Estimated
Ultimate Recovery, refers to our management’s internal estimates of per well hydrocarbon quantities that may be
potentially recovered from a hypothetical future well completed as a producer in the area. For areas where the
Company has no or very limited operating history, EURs are based on publicly available information on operations of
producers operating in such areas. For areas where the Company has sufficient operating data to make its own
estimates, EURs are based on internal estimates by the Company’s management and reserve engineers.
“Drilling locations” represent the number of locations that we currently estimate could potentially be drilled in a
particular area using well spacing assumptions applicable to that area. The actual number of locations drilled and
quantities that may be ultimately recovered from the Company’s interests will differ substantially. There is no
commitment by the Company to drill the drilling locations which have been attributed to any area.
We may use the term “de‐risked” in this presentation to refer to certain acreage and well locations where we
believe the relative geological risks related to recovery have been reduced as a result of drilling operations to date.
However, only a small portion of such acreage and locations may have been attributed proved undeveloped
reserves and ultimate recovery from such acreage and locations remains subject to all of the recovery risks
applicable to unproved acreage.
Factors affecting ultimate recovery include: (1) the scope of our on‐going drilling program, which will be directly
affected by factors that include the availability of capital, drilling and production costs, availability of drilling services
and equipment, drilling results, lease expirations, transportation constraints, regulatory approvals and other factors;
and (2) actual drilling results, including geological and mechanical factors affecting recovery rates. In addition, our
production forecasts and expectations for future periods are dependent upon many assumptions, including
estimates of production decline rates from existing wells and the undertaking and outcome of future drilling activity,
which will be affected by changes in commodity prices and costs.
This presentation includes the financial measure “Adjusted EBITDA”, which is not in accordance with generally
accepted accounting principles (“GAAP”). While management believes that this measure is useful to investors, it
should not be used as a replacement for financial measures that are in accordance with GAAP. For additional
information, including a reconciliation of Adjusted EBITDA to the nearest comparable measure in accordance with
GAAP, please see the appendix.

                                                                                                                             3
Pro Forma Halcón Resources Overview
Over the past twelve months, Halcón has built a premier ~67,000 acre
position in the Delaware Basin for ~$17,701/net acre (1)
Delaware Basin Overview Total Company Acreage Position
Monument Draw (Ward County)
• Net Acreage: ~29,359 with ~97% average W.I.
Includes 7,680 net acres on eastern edge under option agreement
for $10K/acre exercisable by 3/31/18
West Quito
• 655 gross potential operated drilling locations(2) Draw
• Wolfcamp EURs of ~1.9 MMBoe (~80% oil) assuming 10K’ laterals
Monument
Draw
West Quito Draw (Ward County)
• Net Acreage: ~10,524 with ~72% average W.I.
Total Company
• 383 gross potential operated drilling locations(2)
~66,918 Net Acres
• Wolfcamp EURs of ~2.2 MMBoe (~50% oil) assuming 10K’ laterals 2,183 Drilling Locations (2)
Current Production of
Hackberry Draw (Pecos County) >12,000 Net Boe/d
• Net Acreage: ~27,035 with ~74% average W.I.
• 1,145 gross potential operated drilling locations(2)
• Wolfcamp EURs of ~1.5 MMBoe (~75% oil) assuming 10K’ laterals Hackberry
Draw
Halcón’s initial wells results across its
position have been strong and
consistent with expectations
Note: See “Cautionary Statements” on page 3 for a discussion on risks associated with drilling locations and EURs.
(1) Values production acquired at $35,000 per boe/d; assumes $59 MM of value attributed to infrastructure assets purchased in Hackberry Draw. Assumes Monument Draw East Option is exercised. 4
(2) Excludes non‐operated locations.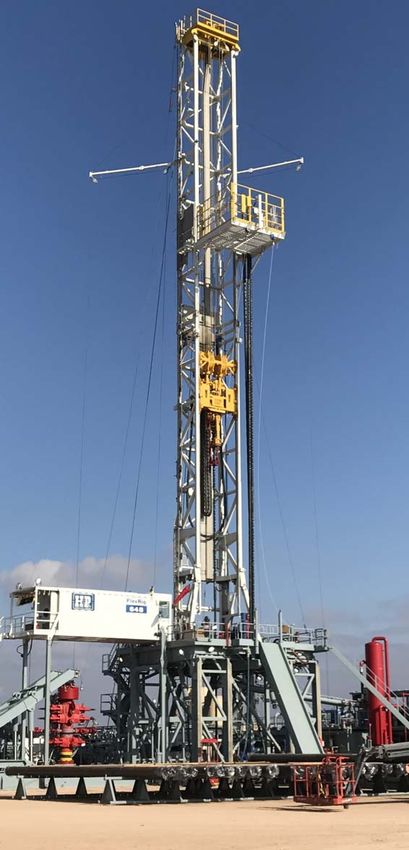
What a Difference A Year Makes
       HK’s Transition into a High Growth Delaware Basin Operator

     2017 Strategic Focus                                  2017 Execution                                 Outcome
‐ Improve asset quality /                    ‐ Sold Williston and EF for ~$2 BN                   ‐ Rapidly growing
  inventory depth                            ‐ Acquired Delaware assets for ~$1.4 BN                production profile
‐ Maintain strong balance sheet              ‐ Raised ~$1.1 BN in debt and equity capital         ‐ HK is a more attractive to
                                                                                                    a buyer (significant
‐ Operate effectively                        ‐ Operated 3 rigs with 15 quality wells POL
                                                                                                    inventory of high return
                                             ‐ Improved leverage and liquidity outlook              drilling locations)
‐ Focus on efficiency
                                             ‐ Reduced headcount and overhead

                        Assets           Rigs & Growth         Balance Sheet           Cost Structure         Oil Prices
                  ‐ Mature assets in     ‐ 1 operated rig      ‐ $800+ MM of net      ‐ Higher G&A and     Low $50s/bbl
                    Williston and EF     ‐ 10‐15% annual         debt                   overhead
  HK at           ‐ Limited inventory      growth from 2017    ‐ Moderate             ‐ LOE >$10/Boe
12/31/16            (~200 remaining        to 2019               leverage
                    core locations)                            ‐ Decent liquidity

                  ‐ Single basin focus   ‐ 3 rigs growing to   ‐ ~$300 MM of net      ‐ Lower G&A and      > $60/bbl
                  ‐ Decades of             4                     debt                   overhead
                    inventory (1000+     ‐ 75%+ growth         ‐ Low leverage &       ‐ LOE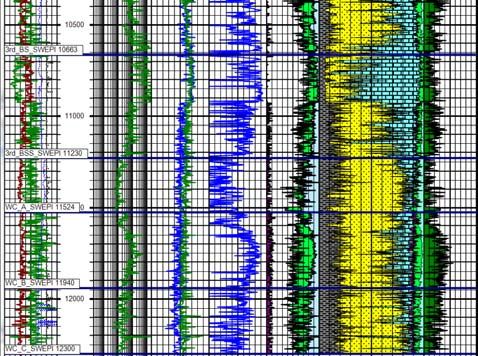
Recent Ward County Acquisitions
Acquisitions Overview Ward County Acreage Position
• Three transactions for $381 MM in cash consideration:
West Quito Draw
10,524 net acres
Current production of ~1,100 boe/d
91% operated / 47% HBP / 72% avg. W.I.
251 base case operated drilling locations across three zones(1)
7,300 ft. avg. lateral length
10K ft. lateral EURs: 2.2 MMboe
Monument Draw Tack‐On
4,413 net acres
Current production of ~225 boe/d
96% operated / 99% HBP / 88% avg. W.I.
48 base case operated drilling locations across three zones(2)
10,833 ft. avg. lateral length HK Legacy Acreage
10K ft. lateral EURs: 1.9 MMboe
West Quito Draw Acquisition
Monument Draw East Option
7,680 net acres Monument Draw Tack‐On
$77 MM purchase price (due at HK’s option by 3/31/18) Monument Draw East Option
100% operated / 100% W.I.
72 base case operated drilling locations across two zones(3) Through 3 transactions HK will have added
All 10,000 ft. laterals ~22,617 net acres in Ward County at a cost of
~$14,674/net acre(4)
Note: See “Cautionary Statements” on page 3 for a discussion on risks associated with drilling locations and EURs.
(1) Excludes an additional 132 gross locations in upside zones. Excludes non‐operated locations.
(2) Up to an additional 90 gross locations in upside zones. Excludes non‐operated locations.
(3) Up to an additional 72 gross locations in upside zones. Excludes non‐operated locations. 6
(4) Assumes Monument Draw East Option is exercised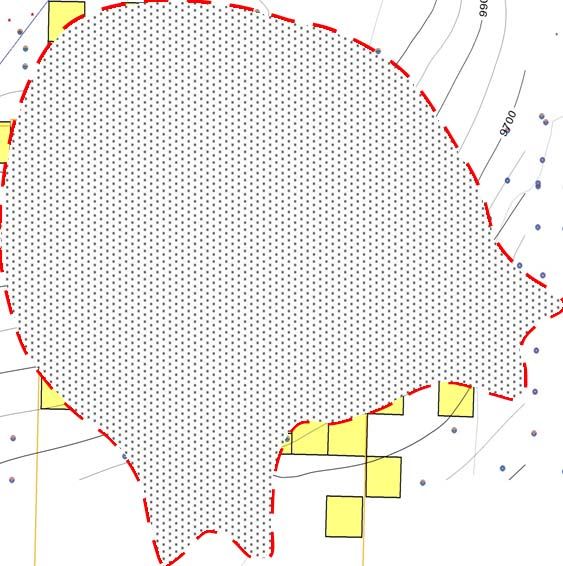
Ward County – A Hotbed of Activity in the Delaware Basin

                                     M&A and Well Results                                               Loving

                                                                                                                          Winkler

     •      Notable M&A Activity
              •      Recent Ward County transaction (green highlighted acreage
                     near HK acreage) – Another operator acquired ~20,300 net
                     acres for ~$41k/acre (1)
              •      Halcón Resources (Feb ’18) – Acquired or have option to
                     acquire ~22,600 net acres for ~$14.7k/acre (1)

                                                             Lateral
     Well                                        Target                IP Data                  % Oil
                                                             Length

                       SR 7902H                   WCA        9,267’    24hr IP: 1,655 boe/d     80%                                 Ward

                       SR 7903H                   WCA        9,781’    24hr IP: 1,978 boe/d     83%

                       SR 5902H                   WCA        9,267’    24hr IP: 1,863 boe/d     88%

                       SR 9301H                   WCA        9,912’    24hr IP: 1,700 boe/d     80%

                       Alcatraz State 1H          WCA        9,140’    24hr IP: 5,600 boe/d     70%

                       UTL 4443‐2H                WCA         N/A      24hr IP: 1,726 boe/d     N/A

                       UTL 2932‐17 2H             WCA         N/A      24hr IP: 1,799 boe/d     81%

                       St. Whiskey River 2H       WCA         N/A      24hr IP: 2,174 boe/d     81%

                       Zeman State 10H            WCA        7,654’    30 Day IP: 2,201 boe/d   55%
                                                                                                                 Reeves
                       Sleeping Indian A1         WCA        6,890’    24hr IP: 1,640 boe/d     82%                             Pecos

                          Strong Drilling Results and Increased A&D Activity are Drawing More Focus to Ward County
.
1.   Adjusting for production at approximately $35k/boepd.                                                                                 7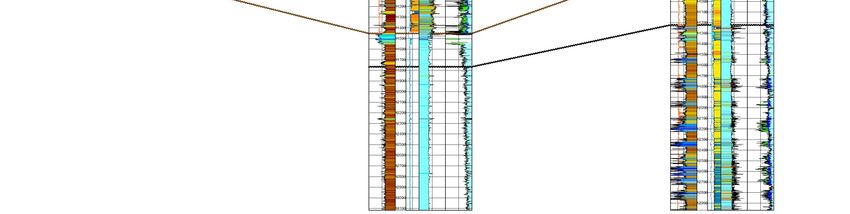
West Quito Draw – Ward County

                             Acreage and Drilling Activity                                                                     Type Log – Univ 19‐28 #1

                                                                                                                                                          OOIP /
                                                                                                                                                          Section

                                                                                                                      1st BS                               58
                                                                                                                                                          MMstb

                                                                                                                                                           100
                                                                                                                     2nd BS                               MMstb

                                                                                                     ~3,500 ft.
                                                                                                       of pay
                                                                                                       across                                              57
                                                                                                                      3rd BS
                                                                                                      multiple                                            MMstb
                                                                                                       target
                                                                                                       zones                                               18
         •      Acreage has been actively developed by offset                                                        3rd BSS                              MMstb
                operators across multiple zones
                                                                                                                                                           66
                                                                                                                      WCA                                 MMstb

                                                                                                                       WCB                                 48
                                                                                                                                                          MMstb

Note: See “Cautionary Statements” on page 3 for a discussion on risks associated with drilling locations and EURs.
                                                                                                                                                            8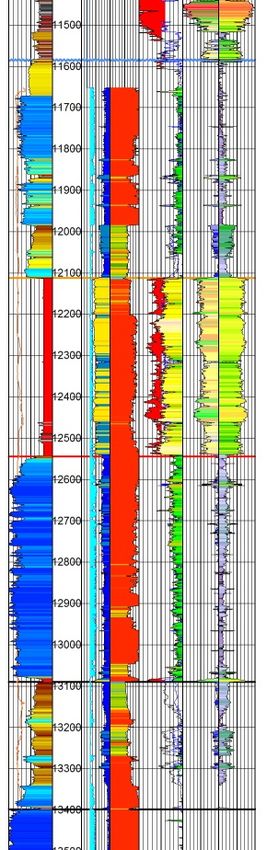
HK’s Avg. Purchase Price of ~$17,701/acre Is Significantly Below the Average
                Price of ~$32,000/acre Paid for Other S. Delaware Basin Transactions

                               Select Southern Delaware Transactions (1)                                                                         $ / Adjusted Net Acre (1)(2)

                                                                                                                                         OXY / J. Cleo                                                 $40,571

                                                                                                                                          OAS / Forge                                                  $40,567
                                                                                                HK – Monument
                                              HK – West Quito                                        Draw
                                                   Draw                                                                        Silver Run / Centennial                                           $34,884

                                                                                                                                      CPE / Ameredev                                         $32,832

                                                                                                                                             PE / APA                                      $32,019

                                                                                                                                            NE / CWEI                                      $31,690

                                                                                                                                         FANG / Luxe                                  $27,372

                                                                                                                                      FANG / Brigham                               $24,845

                                                                                                                                           CRZO / ExL                            $22,319
                                                                                                 HK – Hackberry
                                                                                                      Draw
                                                                                                                                  HK / Various Sellers                      $17,701

                                                                                                                                                                                                                 9
(1)   Transactions since 7/1/16; data per company investor presentations, press releases and public filings.
(2)   Transactions assume $35,000 per boe/d for production value; also adjusted to exclude $59 million of midstream and infrastructure assets. Assumes Monument Draw East Option is exercised.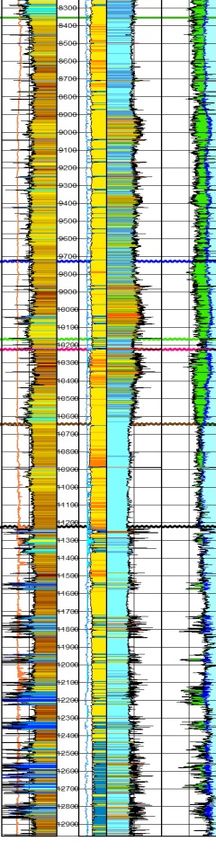
Growth Plan

              Q4 ’17 to Q4 ’18 Estimated Production (Boe/d)                                                                   Annual Estimated Production (Boe/d)

                                                                                          (2)                                                                                 17,000
                                                                              ~ 23,000

                                         ~340%

                                                                                                                                                 ~350%

                                             ~ 11,000

             ~ 5,200                                                                                                         3,700

                                   (1)                                                                                                 (1)                                               (2)
            Q4 2017 PF                        Q1 2018E                         Q4 2018E                                      2017 PF                                           2018E

Note: See “Cautionary Statements” on page 3 for a discussion related to Non‐GAAP financial measures.
(1) Q4 2017 reflects estimated Delaware Basin production of ~5,200 boe/d, 2017 is pro forma to reflect Delaware Basin assets only.
                                                                                                                                                                                                      10
(2) 2018 is based on midpoint of guidance range of 15,000 to 19,000 boe/d assuming 3 rigs running and excludes the impact of West Quito Draw acquisition. Guidance range assumes achievement of the
     Company’s current type curves for the various areas on average.
Multiple Targets Across All Acreage
Monument Draw Type Log West Quito Draw Type Log Hackberry Draw Type Log
3,600’
1st & 2nd BS
2,630’
Shale
Top Seal
3,520’
3rd BS Shale
3rd BS Sand
Deep
Woodford
Deep
Wolfcamp
Base Case Target (Already De‐Risked) Sands
Upside Target (To Be De‐Risked)
11Decades of Drilling Inventory
Gross Remaining Operated Locations (1)(2)
De‐risked base case drilling inventory Additional targets
1,008
50 2,183
201
117
440 1,175
187
180
2 WC Zones 3rd BS 2 WC Zones 3rd BS 2 WC Zones (West 3BS (West Quito) Total Base Case Additional Locations Total Potential
(Monument) (Monument) (Hackberry) (Hackberry) Quito) Locations (Monument, Locations
Hackberry & West
Quito)
Locations by Area Inventory Length (Years)(3)
Gross Locations Net Locations
Years Inventory
60
653 860 632
40 55
1145 41
383 285 20 33
27 24
Monument Draw Hackberry Draw West Quito Draw 0
Note: See “Cautionary Statements” on page 3 for a discussion on risks associated with drilling locations.
3 4 5 6 7
12
(1) Gross Operated Locations per Halcón’s internal estimates. Operated Rigs Running
(2) Excludes non‐operated locations.
(3) Assumes a rig can drill 12 wells per year.Recent Drilling Results – Monument Draw Area
1: HK SR 7901H (5,305’) Vertical Frac in 3rd BS with 117
‐ 24HR IP: 1,659 Boe/d boe/d 24 Hr. IP Rate (61% oil)
‐ 30D IP: 1,343 Boe/d 82% oil
2: HK SR 7902H (9,267’) 4
‐ 24HR IP: 1,655 Boe/d
‐ 20D IP: 1,498 Boe/d 80% oil
3: HK SR 7903H (9,781’)
‐ 24HR IP: 1,978 Boe/d HK’s Wells Have
‐ 20D IP: 1,722 Boe/d 82% oil
Continued to be
4: HK SR 9301H (9,912’) Very Strong
‐ 24HR IP: 1,700 Boe/d
‐ 30D IP: 1,489 Boe/d 80% oil
5
3
5: HK SR 5902H (9,267’) 1
2
‐ 24HR IP: 1,863 Boe/d
‐ 10D IP: 1,095 Boe/d 87% oil
Vertical Frac in 2nd BS with 115
boe/d 24 Hr. IP Rate (41% oil)
Wolfcamp Well
Bone Spring Well
Note: See “Cautionary Statements” on page 3 for a discussion related to Non‐GAAP financial measures. 13Recent Drilling Results – Hackberry Draw
1: HK Lindsey 1H (9,616’) 660’Lower 4: HK Jose Katie West 1H (9,705’)
3 2
‐ 24HR IP: 1,190 Boe/d WC Spacing ‐ 24HR IP: 1,342 Boe/d
‐ 30D IP: 973 Boe/d 83% oil Test ‐ 10D IP: 1,205 Boe/d 84% oil
2: HK Belle Alexandra 1H (9,694’) 5: HK Jose Katie East 1H (9,929’)
‐ 24HR IP: 1,396 Boe/d 4 5 ‐ 24HR IP: 1,340 Boe/d
‐ 30D IP: 1,014 Boe/d 84% oil ‐ 10D IP: 1,135 Boe/d 84% oil
1
330’ Horizontal
3: HK Belle Alexandra A2H (9,701’) and 300’ vertical
‐ 24HR IP: 967 Boe/d spacing test
‐ 30D IP: 733 Boe/d 84% oil from upper WC
to 3BS
Wolfcamp Well
Bone Spring Well
HK’s Latest 4 WC Wells Have Exceeded Expectations (1,317 boe/d 24 Hr IP)
Note: See “Cautionary Statements” on page 3 for a discussion related to Non‐GAAP financial measures. 14Monument Draw (Ward County)
Type Curve (10,000’ Lateral)
Wolfcamp Type Well (2‐Stream Gross Production)
2,000
1,800 D&C: ~$11.5 MM
Normalized Rate (Boe/d)
1,600 2‐Stream EUR: 1.9 Mmboe (80% Oil, 20% Gas)
1,400 2‐Stream 30‐Day Peak IP: ~1,434 boe/d
1,200 2‐Stream 30‐Day Peak IP per 1000’: 143
1,000
800
600
400
200
0
1 2 3 4 5 6 7 8 9 10 11 12 13 14 15 16
Normalized Time (Months)
Economics at Flat WTI Pricing (1)
$30.0 240%
$25.3
$25.0 200%
$19.6
PV‐10 ($MM)
$20.0 160%
IRR (%)
$13.9
$15.0 120%
$8.2 117%
$10.0 80%
86%
$5.0 58% 40%
$0.0 36% 0%
$40 $50 $60 $70
NYMEX Oil ($/bbl)
WC PV‐10 WC IRR
15
Note: See “Cautionary Statements” on page 3 for a discussion on risks associated with EURs.
(1) Assumes a $3.00/MMBtu gas price and NGL pricing of ~44% of NYMEX oil and current D&C costs.West Quito Draw (Ward County)
Type Curve (10,000’ Lateral)
Wolfcamp Type Well (2‐Stream Gross Production)
2,000
1,800 D&C: ~$11.0 MM
Normalized Rate (Boe/d)
1,600 2‐Stream EUR : 2.2 Mmboe (50% Oil, 50% Gas)
1,400 2‐Stream 30‐Day Peak IP: 2,089 boe/d
1,200 2‐Stream 30‐Day Peak IP per 1000’: 209
1,000
800
600
400
200
0
1 2 3 4 5 6 7 8 9 10 11 12 13 14 15 16
Normalized Time (Months)
Economics at Flat WTI Pricing (1)
$30.0 240%
$25.0 200%
$19.6
PV‐10 ($MM)
$20.0 160%
IRR (%)
$14.7
$15.0 120%
$9.8
$10.0 99% 80%
$4.9
$5.0 71% 40%
46%
$0.0 26% 0%
$40 $50 $60 $70
NYMEX Oil ($/bbl)
WC PV‐10 WC IRR
16
Note: See “Cautionary Statements” on page 3 for a discussion on risks associated with EURs.
(1) Assumes a $3.00/MMBtu gas price and NGL pricing of ~50% of NYMEX oil and current D&C costs.Hackberry Draw (Pecos County)
Type Curve (10,000’ Lateral)
Wolfcamp Type Well (2‐Stream Gross Production)
1,000 D&C: ~$10.5 MM
900 2‐Stream EUR: 1.5 Mmboe (75% Oil, 25% Gas)
Normalized Rate (Boe/d)
800 2‐Stream 30‐Day Peak IP: 942 boe/d
700 2‐Stream 30‐Day Peak IP per 1000’: 94
600
500
400
300
200
100
0
1 2 3 4 5 6 7 8 9 10 11 12 13 14 15 16
Normalized Time (Months)
Economics at Flat WTI Pricing (1)
$30.0 240%
$25.0 200%
PV‐10 ($MM)
$20.0 $16.7 160%
IRR (%)
$15.0 $12.2 120%
$10.0 $7.8 80%
$5.0 $3.4 75% 40%
53%
$0.0 35% 0%
20%
$40 $50 $60 $70
NYMEX Oil ($/bbl)
WC PV‐10 WC IRR
17
Note: See “Cautionary Statements” on page 3 for a discussion on risks associated with EURs.
(1) Assumes a $3.00/MMBtu gas price and NGL pricing of ~44% of NYMEX oil and current D&C costs.Hackberry Draw WC Performance vs. Type Curve
Legacy wells underperformed type curve from ~50 to ~300 days due to timeliness of
artificial lift installations and inefficient gas lift design
Hackberry Wolfcamp Type Curve (1.5 Mmboe EUR)
Legacy Operator Wells
HK Drilled and Completed Wells 18
Note: See “Cautionary Statements” on page 3 for a discussion on risks associated with EURs.First Year Cumulative Oil Production Comparison
419,576
319,999
255,999
232,339
209,788
174,255
Monument Draw WC West Quito Draw WC Hackberry Draw WC
Oil (Bbls) Combined (Boe)
West Quito Draw’s First Year Cumulative Oil is Prolific. Natural Gas and NGLs Will Add to Profitability of
Drilling Here
Note: Based on 2‐stream production and no downtime. 19Deeper Targets
Deep Woodford Prospect in Monument Draw Deep Wolfcamp Sand Prospect in Hackberry Draw
• Deep Woodford present across southern Monument Draw acreage • Present across most of Hackberry Draw acreage
• Recently successfully tested by nearby operator • 500’ to 1,500’ deeper than horizontal Wolfcamp targets
– IP30 of 227 Boe/d per 1000’ • Sandstone = higher porosity and permeability
– 63% oil (2 stream) • Could drill vertically or horizontally
Woodford Deep Wolfcamp
Type Log Sands
Type Log
Lower
Barnett
1st & 2nd BS
Miss Lime
3rd BS Shale
Woodford
Wolfcamp
Top Woodford Target:
12,000’ – 13,000’
Devonian WFD Thickness:
> 450’ Deep
Wolfcamp
Sands
Silurian
20
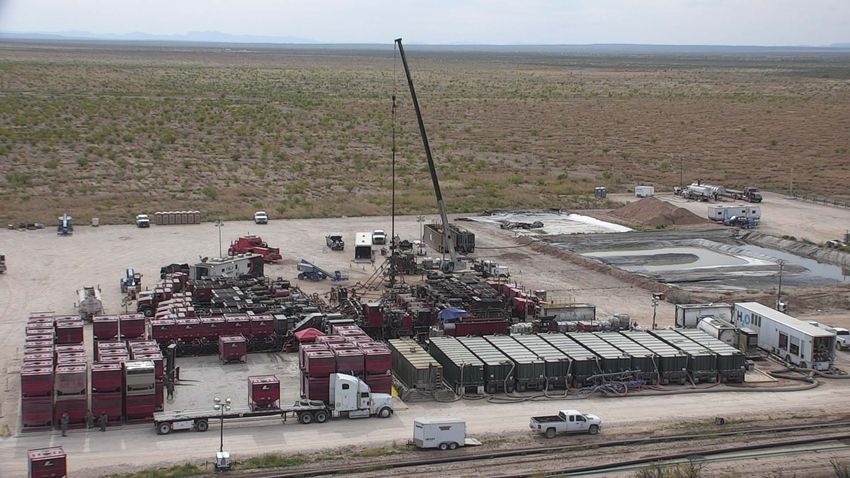
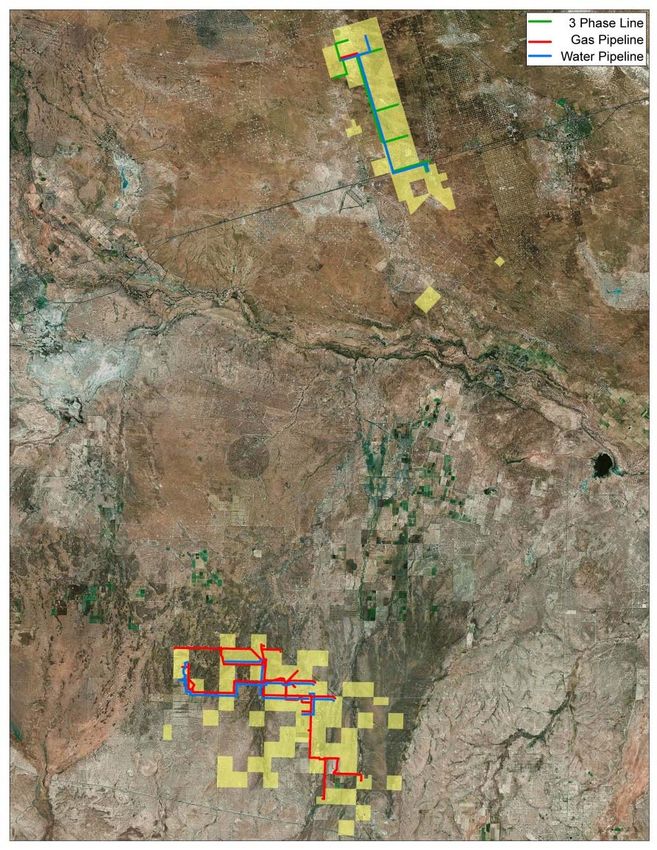
FusselmanHalcón Field Services
Water Management Overview
Key Infrastructure for Operational Development
• 100% HK owned water systems are sufficient to handle all produced water and
provide all water for completions
• Water infrastructure is developed well ahead of the drill bit
• Water sourcing and handling costs average $0.10 – 0.25 /bbl compared to
commercial rates of $0.55 – 1.50 /bbl for disposal and $0.35 – 0.55 /bbl to source
• Water pipelines (1)
• Hackberry Draw – 27 miles
• Monument Draw – 23 miles
• Surface acreage owned (1) for further development
• Hackberry Draw – 3,220 acres
• Monument Draw – 801 acres
Area Produced Water (1) Fresh Water (1) Storage (1)
• 2,700,000 bbls pf
• 45,000 bwpd of injection • 4 wells with 40,000
produced/recycled
Hackberry capacity (3 wells) bwpd of capacity
water storage
Draw • 120,000 bw/d of recycling • Additional capacity
• 1,000,000 bbls of
capacity (3 facilities) available
fresh water storage
• 900,000 bbls of
• 20,000 bwpd of injection • 10 wells with 60,000
produced/recycled
Monument capacity (3 wells) bwpd of capacity
water storage
Draw • 40,000 bwpd of recycling • Additional capacity
• 1,100,000 bbls of
capacity (1 facility) available
fresh water storage
21
(1) As of 12/31/17.Halcón Field Services
Water Management Advantages
Key Infrastructure for Cost Control Hackberry Draw SWD LOE Cost Control Example (1,2,6)
• Operational Advantages $12.00 $11.43
Net SWD LOE / Boe
• Eliminates dependence on 3rd party sources for water $10.00
disposal and completions
$8.00 87% Savings
• Simplifies operations to handle and source all water within
our own field $6.00
• Critical to control own destiny with regards to $4.00
infrastructure, especially water infrastructure
$2.00 $1.43
• Value of these assets growing rapidly as production and
expansion of capacity continues $‐
Commercial Disposal Rate Halcon Operated Cost
Estimated savings of ~$1.7 MM /well during first year of production
Hackberry Draw Water Recycling Facility Water for Completions Cost Control (3,4,5,6)
$4,500 $4,069
Total Cost of Water ($ M)
45% Savings
$3,750
$3,000
$2,231
$2,250
$1,500
$750 $271 $149
$‐
1 Well 15 Wells 1 Well 15 Wells
Commercial Water Rates Halcon Operated Rates
(1) Assumes commercial water disposal costs of $2.00 / bbl of water.
Estimated savings of ~$1.8 MM /rig/year (2)
(2) Assumes Halcon Field Services handles produced water for $0.25 / bbl of water.
(3) Assumes blended water use of 75% recycled produced water and 25% fresh water.
(4) Assumes 1 rig drills and POL’s 15 wells per year.
(5) Assumes commercial water sourcing costs of $0.35 / bbl for produced water and $0.50 / bbl for fresh water.
22
(6) Assumes 100% WI and 75% NRI.Pro Forma Capitalization
Highlights Pro Forma Capitalization
Adjusted HK Assumed
Simple capital Face Value
Exercise of the
Monument Draw 6.75% HY Common Equity
Excluding Future
Acquistions
West
Quito Draw
Exercise of the
Monument Draw Adjusted HK
structure Capitalization ($MM) 12/31/2017 North Option (1) Tack‐on Issuance 12/31/2017 Acquisition East Option 12/31/2017
Cash & Cash Equivalents $ 424 $ (108) $ 203 $ 61 $ 580 $ (200) $ (77) $ 303
No near‐term debt
Senior Secured Revolving Credit Facility ‐ ‐ ‐
maturities 6.75% Senior Unsecured Notes due 2025 425 200 625 625
Total Debt $ 425 $ 625 $ 625
Strong liquidity Total Net Debt / (Cash) $ 1 $ 45 $ 322
Stockholders' Equity 1,072 61 1,133 1,133
‐ $678 MM PF for capital Total Capitalization $ 1,497 $ 1,758 $ 1,758
raise Borrowing Base $ 100 $ 100 $ 100
Less: Borrowings ‐ ‐
‐ $401 MM PF for capital Less: Letters of Credit (2) (2) (2)
Plus: Cash 424 580 303
raise & acquisitions Total Liquidity $ 522 $ 678 $ 401
(1) Exercised option in January 2018.
Halcón has significant liquidity to fund its planned operations without the need for
additional external financing
23Investment Highlights
• ~67,000 net acres in the oily window of the Delaware Basin (70%+ oil)
Significant Inventory • Over 2,000 gross operated locations with an average lateral length of ~9,500 ft.
• Manageable HBP requirements
Excellent • Q4 ’17 to Q4’18 expected production growth in excess of 300%
Growth Profile • Significant long‐term growth potential
• Strong current liquidity of ~$678 MM (~$401 MM PF for West Quito Draw & Monument East Option
Strong acquisitions)
Balance Sheet • Reasonable leverage profile
• No near‐term debt maturities
Compelling • Well‐level IRRs of 50% to 100% at current strip
Return Profile • Strong corporate level returns
Attractive • Halcón's average purchase price of ~$17,796/acre is significantly below the average price of
Valuation ~$32,000/acre paid for other Southern Delaware Basin transactions
• Management has significant equity stake in company
Committed and
• Technologically‐focused operations group
Experienced Team • Decades of value creation experience through M&A&D and shale development
24Appendix
Improving Pecos County Drilling Efficiencies

                                        Hackberry Draw 10,000’ Lateral Wells Average Intermediate Spud to Total Depth Cycle Times
                   35.00

                   30.00              29.36

                                                                 25.65
                   25.00
                                                                                             23.01

                                                                                                                        20.47
Days, Int. spud to RR

                   20.00
                                                                                                                                    18.65

                   15.00

                   10.00

                                                                                                                                     LINDSEY 1H
                        5.00
                                       3 wells

                                                                  3 wells

                                                                                                                         3 wells
                                                                                              3 wells

                        0.00
                               Samson’s Previous Results         Halcon                      Halcon                     Halcon      Halcon
                                   All 10k’ Laterals            Q2, 2017                    Q3, 2017                   Q4, 2017     Record
                                                                                                                                     Well
                                                                                                                                                  26
Hedging Summary
Crude Oil (Bbl/d, $/Bbl)
Q1 '18 Q2 '18 Q3 '18 Q4 '18 FY 2018 Q1 '19 Q2 '19 Q3 '19 Q4 '19 FY 2019
Costless Collars (Bbl/d) 8,000 9,000 10,000 11,000 9,510 9,000 8,000 8,000 8,000 8,247
Ceiling (1) $56.82 $56.26 $55.98 $55.95 $56.21 $56.98 $57.63 $57.63 $57.63 $57.46
Floor (1) $49.29 $49.01 $48.96 $49.11 $49.08 $50.98 $51.51 $51.51 $51.51 $51.36
Weighted Average Price (2) $53.05 $52.63 $52.47 $52.53 $52.65 $53.98 $54.57 $54.57 $54.57 $54.41
Mid‐Cush Differential Swap (Bbl/d) 7,000 8,000 13,500 13,500 10,526 12,000 12,000 12,000 12,000 12,000
Basis Swap ($1.29) ($1.27) ($1.21) ($1.21) ($1.23) ($1.02) ($1.02) ($1.02) ($1.02) ($1.02)
Natural Gas (MMBtu/d, $/MMBtu)
Q1 '18 Q2 '18 Q3 '18 Q4 '18 FY 2018 Q1 '19 Q2 '19 Q3 '19 Q4 '19 FY 2019
Costless Collars (MMbtu/d) 7,500 7,500 7,500 7,500 7,500 0 0 0 0 0
Ceiling (1) $3.30 $3.30 $3.30 $3.30 $3.30 $0.00 $0.00 $0.00 $0.00 $0.00
Floor (1) $3.01 $3.01 $3.01 $3.01 $3.01 $0.00 $0.00 $0.00 $0.00 $0.00
Weighted Average Price (2) $3.16 $3.16 $3.16 $3.16 $3.16 N/A N/A N/A N/A N/A
WAHA Gas Differential Swap (MMBtu/d) 0 0 5,000 5,000 2,521 5,000 5,000 5,000 5,000 5,000
Basis Swap $‐ $‐ ($1.05) ($1.05) $‐ ($1.05) ($1.05) ($1.05) ($1.05) ($1.05)
27Ownership Summary
Ownership Summary as of 1/31/18
Basic Shares Basic Shares Employee Net Fully Fully Diluted
(1) (2)
Holder Outstanding % Ownership Warrants Options Diluted Diluted % Ownership
Other Common Equity Holders 145,221,648 97.2% 4,736,842 0 145,221,648 149,958,490 93.2%
Long‐Term Incentive Plan 4,190,423 2.8% 0 6,694,236 4,190,423 10,884,659 6.8%
Total 149,412,071 100.0% 4,736,842 6,694,236 149,412,071 160,843,149 100.0%
Note: Net Diluted shares based on 02/02/18 closing stock price of $7.33/share.
(1) Warrants have a strike price of $14.04/share and a term of 4 years.
(2) Employee options issued under the Long‐Term Incentive Plan with a weighted average strike price of $8.85/share; options vest ratably over 3 years.
28Contact Information
Quentin Hicks
EVP – Finance and Investor Relations
832.538.0557
qhicks@halconresources.comYou can also read