The Effects of Different Concentrations of Bay Leaf Extract on Shelf Life of Preserved Scad Fish
←
→
Page content transcription
If your browser does not render page correctly, please read the page content below
2021, Scienceline Publication
World’s Veterinary Journal
World Vet J, 11(3): 431-438, September 25, 2021                                                                                                            ISSN 2322-4568

The Effects of Different Concentrations of Bay Leaf
Extract on Shelf Life of Preserved Scad Fish
Pramaziyah Fuaidah, Juni Triastuti*, and Heru Pramono
Department of Marine, Faculty of Fisheries and Marine, Universitas Airlangga, Surabaya-60115, Indonesia
*Corresponding author’s Email: juni.triastuti@fpk.unair.ac.id ;                : 0000-0003-4378-1946

                                                                                                                                                         Accepted: 06 September 2021
                                                                                                                                                         Received: 26 July 2021
                                                                                                                                                         pii: S232245682100055-11
                                                                                                                                                                                       SHORT COMMUNICATION
ABSTRACT
Scad fish (Decapterus kurroides) is the most productive fish species. To provide the added value,
fishermen can process scad fish into various forms of processed products, such as preserved fish, which
extend the shelf life. In order to extend the shelf life of canned fish, natural preservatives could be used
that contain antimicrobial agents, such as bay leaves. The present study aimed to determine the effects of
bay leaf extract in different concentrations on the shelf life of preserved scad fish. In the present study,
the completely randomized design was used as an experimental research method. The treatments given
differed in terms of the concentration of the bay leaf extract. The groups were treated as the scad fish
without bay leaf extract (A), scad fish soaked in 6% of bay leaf extract (B), scad fish soaked in 7% of
bay leaf extract (C), scad fish soaked in 8% of bay leaf extract (D), and scad fish soaked in 9% of bay
leaf extract (E). The analyzed parameters included the total plate count, pH, and water level test using
Analysis of Variance (ANOVA). The supportive parameters observed included an organoleptic test. The
results indicated that the lowest total bacterial count from the beginning to the end of the experiment (18
hours) occurred on treatment C (7% of bay leaf extract addition), which was 1.54 × 10³ to 5.85 × 10⁶.
Regarding the water level test from the beginning to the end of the experiment, treatment A (control) was
not significantly different from other treatments. The difference in the concentration of bay leaf extract
on scad fish effectively inhibited the growth of bacterial colonies. In conclusion, adding bay leaf extract
to scad fish could inhibit bacteria for up to 12 hours. Treatment C (7% of bay leaf extract) gave the best
results since this concentration level could inhibit the bacteria on scad fish.
Keywords: Bay leaf, Preservation, Scad fish, Shelf life

INTRODUCTION

Scad fish (Decapterus kurroides) is the most productive fish species, accounting for 52% of the total catch of
approximately 2323365 tons per year. In addition, scad fish comes at a relatively low price. To achieve added value,
fishermen process scad fish into various forms of processed products, such as petis (fish paste) and preserved fish.
Preserved fish is one of the most famous marine products in Indonesia due to a combination of boiling and salting. The
resulting product is a preserved fish with low salt content. The traditional preservation process of boiling the fish in the
salt solution is called pindang cue (Triarso, 2012; Junianingsih, 2015).
     Pindang cue uses scad fish, which can be found in traditional markets and are commonly placed in paso or naya
(small woven tray) without any packaging. Thus, microbial contamination occurs during the sales process. The shelf life
of scad fish is approximately 1-2 days, and safety is not guaranteed. Scad fish contain high water (60%) and protein
(27%), which are suitable for the microorganisms' growth. The maximum limit for the microorganism in food products is
5.0 × 10⁵ cells/gram (Ariyani, and Yennie 2008).
     Preservation is an appropriate way to extend the shelf life of scad fish. Fish preservation is a process that is aimed at
developing high-quality processed fish products (in terms of color, odor, texture), offering a wide range of food and
varietal products on the market, increasing the economic value of the product, as well as enhancing the shelf life of fish.
Since these preserved scad fish had a limited shelf life and are prone to deterioration, fish should be stored longer to
provide benefits to traders while increasing consumers' appeal. Conservation also is used to inhibit the activities of
enzymes and microorganisms (Herawati, 2008).
     Preservation with hazardous chemicals, such as formalin, is mostly used because the price is lower than safe
preservation. The use of formalin has been constantly increasing. Thus, natural preservations are required to inhibit the
growth of spoilage bacteria (Hastuti, 2010; Nafisyah, 2015). Herbs and spices native to Indonesia contain active
antimicrobial substances that potentially can be used as natural preservatives. Bay leaf is one of the natural ingredients

                                                                                 431
To cite this paper: Fuaidah P, Triastuti J, and Pramono H (2021). The Effects of Different Concentrations of Bay Leaf Extract on Shelf Life of Preserved Scad Fish. World
Vet. J., 11 (3): 431-438.
that can be used as a preservative, and also has many benefits to be utilized in cooking as a seasoning because of its
distinctive aroma and odor, as well as its low price and easy procurement (Purwani and Muwakhidah, 2008).
     Bay leaf is an ingredient that can be used as a fish preservative since it contains flavonoid, terpenoid, and tannin,
which have antibacterial properties. Flavonoids inhibit bacterial growth by forming complex compounds with
extracellular proteins through hydrogen bonds, that damage the cell membrane. Tannin inhibits bacterial growth by
denaturating bacterial cell proteins in the cell membrane. The terpenoid inhibition mechanism for bacterial growth is to
react with porin (transmembrane protein) on the external membrane of the bacterial cell wall. Bay leaf indicated good
antibacterial activity against Staphylococcus aureus (Roslizawaty, 2013; Nurwijayanti, 2016). Based on the fact that bay
leaf indicated sufficient antibacterial activity against Staphylococcus aureus, the present study was conducted to
investigate the effects of bay leaf extract with different concentrations on the shelf life of scad fish.

MATERIALS AND METHODS

The current research used an experimental research method and the experiment design of a completely randomized
design. The following is the bay leaf treatments on scad fish, scad fish without bay leaf extract treatment (A), scad fish
soaked in 6% of bay leaf extract (B), scad fish soaked in 7% of bay leaf extract (C), scad fish soaked in 8% of bay leaf
extract (D), and scad fish soaked in 9% of bay leaf extract (E).
     The variables included in the present study were independent, dependent, and control variables. The independent
variable was the bay leaf extract. The dependent variables of the study were the Total Plate Count (TPC), organoleptic
value, pH, and water level of scad fish. The control variables of the research were bay leaves, preserved scad fish, and
bay leaves boiled at 90°C for 30 minutes.
      The research procedure was divided into two stages of preparation and implementation. The preparatory stage
consisted of fish processing, sterilization of tools and materials, bay leaf extraction, and preparation of Plate Count Agar
(PCA) media. The implementation stage included the treatment of scad fish, marked with the letter A, B, C, D, and E.
Then, the treatment was performed by mixing bay leaf extracts with the preserved scad fish. In treatment A, the scad fish
were not soaked in the bay leaf extract. In treatments B, C, D, and E, the scad fish were soaked in bay leaf extract with
concentrations of 6%, 7%, 8%, and 9%, respectively, for 30 minutes. Furthermore, the soaked scad fish were then placed
into the oven for 30 minutes at a temperature of 50°C. Then, the fish were transferred to clean containers and stored at
room temperature. Afterward, the total number of bacteria, the pH value, water content, and the organoleptic value were
observed before storage and after 3, 6, 9, 12, 15, and 18 hours of storage.
      The research parameters were the main parameters and supporting parameters. The main observed parameters
entailed the TPC test, pH, and water level. The supporting parameters observed included the organoleptic tests. The
research result data were analyzed in the terms of TPC, pH, and water level using Analysis of Variance (ANOVA) to
determine the difference in the different concentrations of bay leaf extracts on the shelf life of scad fish. Duncan's
Multiple Range Test was then performed to determine the differences between treatments. The data analysis for
organoleptic tests used descriptive methods. The distinction between the two approaches to sensory evaluation of fish
products was made to first emphasize that both of these approaches were necessary for the evaluation of this commodity.
Secondly, these two aspects of sensory evaluation of fish products were not mutually exclusive but rather acted as a
mutual information resource. Sensory assessment of fish products would continue to be essential in quality testing, even
as with time, useful chemical tests are developed which are as efficient and cost-effective as sensory testing. In product
grading, standard chemical and physical tests can only measure what is already known. The sensory assessor can
measure both the known attributes of the product and assess the presence of new attributes, especially in the area of
measurement of 'taint' in fish products. The factor of sensory testing is part of the definition of taint in a product ['fish
that is rancid or has an abnormal odor or flavor (DFO, 1978). However, chemical testing can accurately assess the level
of a particular compound in a sample, it cannot by itself, indicate what this number means relative to the final quality of
the product and the action that needs to be taken as to whether the product will continue to be used as a food, or whether
it has deteriorated to a point where it is no longer usable. The definition of the 'cut-off' point for taint will always be
based on a human definition of this level for the particular culture in which the product is being used (York and Sereda,
2014).

RESULTS

     Total bacterial count
      The highest mean total bacterial count from the beginning of the experiment until the end of the experiment (18
hours) occurred in treatment A (control), which was 1.57 ×10³ to 8.55 ×10⁶. Meanwhile, the mean value of the lowest
total bacterial count occurred from the beginning to the end in treatment C (7% of bay leaf extract), which was 1.54×10³
to 5.85×10⁶ (Table 1).

                                                                                 432
To cite this paper: Fuaidah P, Triastuti J, and Pramono H (2021). The Effects of Different Concentrations of Bay Leaf Extract on Shelf Life of Preserved Scad Fish. World
Vet. J., 11 (3): 431-438.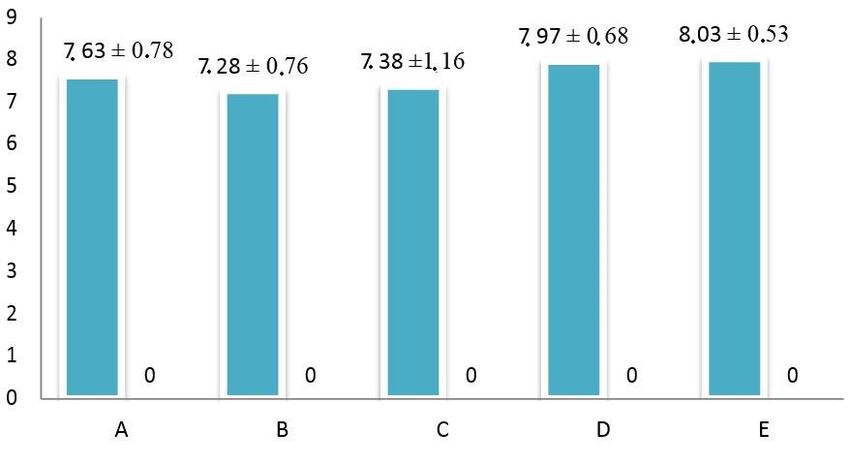
Water level test
      The water level test utilized a moisture analyzer. The average value of the water content found in the redtail scad at
the beginning of the experiment and the end of the experiment of each treatment decreased during storage at room
temperature until the end of the study. The results of the ANOVA test showed that the mean value of the water level at
the beginning and in hour 18 of the experiment in treatment A (control) did not significantly differ (p > 0.05) from the
other treatments (Table 2).

     PH level test
     The results of the ANOVA test showed that the mean value of the water level at hour 12 in group D and hour 15 in
group C, and E was significantly different (p < 0.05) from the other treatments (Table 3).

Table 1. Total bacterial count (CFU/gram) of Staphylococcus aureus and bacterias in Scad fish meat
 Observation                                                             Treatment (Average ± SD)
 Time (hour)                  A (0%)                       B (6%)                 C (7%)              D (8%)                                        E (9%)
 1                        1.57×10³a ± 0.11             1.52×10³a ± 0.15       1.54×10³a ± 0.17    1.82×10³a ± 0.12                              1.43×10³a ± 0.14
 3                        8.25×10³a ± 0.04             6.85×10³ab ± 0.05      5.1×10³c ± 0.07     5.95×10³bc ± 0.04                             6.45×10³b ± 0.07
 6                        2.58×10⁴a ± 0.04             2.22×10⁴ab ± 0.13              1.72×10⁴b ± 0.07            2.22×10⁴ab ± 0.12            2.11×10⁴ab ± 0.11
 9                        6.60×10⁴a ± 0.04             6.65×10⁴a ± 0.03               5.11×10⁴b ± 0.03            6.50×10⁴a ± 0.05             5.94×10⁴a ± 0.02
 12                       2.78×10⁵a ± 0.02             2.23×10⁵b ± 0.10               1.47×10⁵c ± 0.02            1.87×10⁵b ± 0.03             2.18×10⁵b ± 0.08
 15                       2.35×10⁶a ± 0.08              2.12×10⁶a ± 0.07              1.45×10⁶b ± 0.05             1.94×10⁶a ± 0.06             2.08×10⁶a ± 0.08
 18                       8.55×10⁶a ± 0.04             7.17×10⁶ab ± 0.04              5.85×10⁶b ± 0.06              6.1×10⁶b ±0.08              6.57×10⁶b ± 0.07
The different superscript letters in the same column shows a significant difference (p < 0.05). CFU: Colony-forming unit, SD: Standard deviation.

Table 2. Water level test of scad fish meat
 Treatment (%)                      The water level at the beginning of the study (%)                        The water level at the end of the study (%)
 A (0%)                                                45.97a ± 1.34                                                        34.74a ± 6.87
 B (6%)                                                 48.6a ± 4.49                                                       34.133a ± 8.88
 C (7%)                                                47.41a ± 2.44                                                       33.78a ± 11.02
 D (8%)                                                43.08a ± 5.89                                                        37.81a ± 9.25
 E (9%)                                                45.94a ± 5.42                                                        36.51a ± 7.62
Remarks: The notation indicated by different superscript letters in the same column shows a significant difference (p < 0.05).

Table 3. PH Level of scad fish meat
                     Treatment
                                              A (0%)                   B (6%)                    C (7%)                    D (8%)                     E (9%)
 Observation time
 1                                          7.05a ± 0.40            6.99a ± 0.42              6.78a ± 0.24              6.78a ± 0.21              6.73a ± 0.09
 3                                          6.89a ± 0.57            6.88a ± 0.40              6.73a ± 0.12               6.7a ± 0.23               6.6a ± 0.11
 6                                          6.92a ± 0.48            6.95a ± 0.34              6.75a ± 0.10               6.7a ± 0.21               6.7a ± 0.08
 9                                          6.85a ± 0.35             6.7a ± 0.18              6.65a ± 0.24              6.53a ± 0.17              6.53a ± 0.05
 12                                         6.78a ± 0.28            6.7ab ± 0.00              6.63ab ± 0.22             6.5b ± 0.08               6.53ab ± 0.05
 15                                         6.73a ± 0.09            6.55ab ± 0.10              6.5b ± 0.14              6.6ab ± 0.11               6.5b ± 0.18
 18                                         6.45a ± 0.13            6.45a ± 0.24              6.28a ± 0.17               6.3a ± 0.00               6.3a ± 0.23
Remarks: The notation indicated by different superscript letters in the same column shows a significant difference (p < 0.05). A: Scad fish without bay
leaf extract treatment, B: Scad fish soaked in 6% of bay leaf extract, C: Scad fish soaked in 7% of bay leaf extract, D: Scad fish soaked in 8% of bay
leaf extract, E: Scad fish soaked in 9% of bay leaf extract.

     Organoleptic test
     The organoleptic tests on preserved scad fish included five parameters, including visual, aroma, odor, texture, and
mucus parameters that create an individual experience via the senses including taste, sight, smell, and touch. The
minimum acceptable score was 6. The results of the organoleptic tests were provided at the beginning of the experiment
and after 18 hours of preservation time.

     Visual parameter
     The results of the visual parameters at the beginning of the trial indicated the preserved scad fish in treatment A, B,
C, D, and E experienced organoleptic values until the end of the storage period (18 hours). The average visual score of
the beginning of the experiment in treatments A, B, C, D, and E ranged from 7.39 to 8.35. Furthermore, the average
visual score at the 18 hours in treatments A, B, C, D, and E ranged from 5.48 to 6.97 (Figure 1).

     Aroma parameter
     The results of the aroma parameter of scad fish at the beginning of the experiment up to hour 18 of all treatments
A, B, C, D, and E indicated a decrease in the organoleptic score. The average odor score at the beginning of the

                                                                                 433
To cite this paper: Fuaidah P, Triastuti J, and Pramono H (2021). The Effects of Different Concentrations of Bay Leaf Extract on Shelf Life of Preserved Scad Fish. World
Vet. J., 11 (3): 431-438.
experiment in all treatments was between 7.33 and 8.31. Furthermore, the average aroma value in all treatments at hour
18 ranged from 5.8 to 6.89 (Figure 2).
Odor parameter
The results of the odor parameter of the scad fish at the beginning of the experiment in all treatments indicated a
decrease of the organoleptic values after 18 hours of storage period. The average odor value in all treatments at the
beginning of the experiment was between 7.28 and 8.03 (Figure 3). The odor parameter results at the 18 hours were not
assessed because the total value of the bacteria exceeded the limit of microorganisms.
Texture parameter
The results of the texture parameter at the beginning of the experiment at all treatments indicated a decrease in the
organoleptic values by the end of 18 hours of the storage period. The average texture value at the beginning of the
experiment was between 7.18 and 8.3 for all treatments. Furthermore, the average texture value was between 6.27 and
6.92 for all treatments after 18 hours (Figure 4).
Mucus parameter
The results of the mucus parameter at the beginning of the experiment for all treatments indicated a decrease in the
organoleptic values by the end of 18 hours of the storage period. The average mucus value at the beginning of the
experiment for all treatments was between 7.18 and 8.3. Furthermore, the average mucus value was between 6.13 and
6.87 for all treatments after 18 hours (Figure 5).
Visual parameter at the beginning Visual parameter after 18 hours
Figure 1. The results of the visual parameters of scad fish at the beginning of the experiment and after 18 hours of the
storage period.
Aroma parameter at first hour Aroma parameter at hour 18
Figure 2. The results of the aroma parameters of scad fish at the beginning of the experiment and after 18 hours of
storage period.
434
To cite this paper: Fuaidah P, Triastuti J, and Pramono H (2021). The Effects of Different Concentrations of Bay Leaf Extract on Shelf Life of Preserved Scad Fish. World
Vet. J., 11 (3): 431-438.Odor parameter at first hour Odor parameter at hour 18
Figure 3. The results of the odor parameters of the scad fish at the beginning of the experiment and after 18 hours of the
storage period.
9 8.3±0.59
8±0.73 7.81±0.71 7.84±0.41
8 7.18±0.65 6.92±0.28 6.82±0.39
7 6.65±0.48
6.27±0.44 6.28±0.41
6
5
4
3
2
1
0
A B C D E
Texture parameter at first hour Texture parameter at hour 18
Figure 4. The results of the texture parameters of scad fish at the beginning of the experiment and after 18 hours of the
storage period.
8.3±0.29
8±0.66 7.81±0.46 7.84±0.50
9
7.18±0.39 6.87±0.33 6.86±0.35
8
6.13±0.33 6.25±0.43 6.14±0.34
7
6
5
4
3
2
1
0
A B C D E
Mucus parameter at first hour Mucus parameter at hour 18
Figure 5. Mucus parameter of scad fish at the beginning of the experiment and after 18 hours of the storage period.
435
To cite this paper: Fuaidah P, Triastuti J, and Pramono H (2021). The Effects of Different Concentrations of Bay Leaf Extract on Shelf Life of Preserved Scad Fish. World
Vet. J., 11 (3): 431-438.DISCUSSION
Shelf life is the period in which the quality of fresh food is impaired and becomes inedible. In the present research, the
shelf life was determined using the TPC of the microbiological tests, chemical tests (water level and pH), and sensory
tests (organoleptic test). The food product quality is influenced by the microbial content of the product as it determines
consumption safety. The shelf life of food is determined by the total bacterial count in the product using a method called
the TPC. The results of total bacteria calculation on the scad fish in all treatments increased constantly from the
beginning of the experiment up to after 18 hours since the storage time could increase the total bacteria count. The test
results of bay leaf extract on scad fish from the beginning up to 12 hours indicated that the number of microorganisms
was still at the maximum growth limit of 5×10⁵ Colony-Forming Unit (CFU)/gram (Buckle, 1987; Herawati, 2008).
Various factors that influenced microbial growth in the food products included intrinsic factors such as acidity
(pH), water activity, nutrient content, biological structure, and antimicrobial content, while the extrinsic factors included
storage temperature, humidity, type and amount of gases in the environment, and preparation and processing errors. All
the treatments indicated that the bay leaf extract could inhibit the bacteria for up to 12 hours. The best treatment was
obtained in treatment C (7% of bay leaf extract) because it had the lowest bacterial count among all treatments. The
current result is in line with the previous study conducted by Buckle (1987) and Sahputra (2015) which suggested that a
combination between 7% of bay leaf extract treatment and 8% of salt can inhibit bacteria in the milkfish (Buckle, 1987;
Sahputra, 2015).
Bay leaf extract contained antibacterial compounds with high tannin, terpenoid, and flavonoid contents. These
compounds could inhibit the growth of microbes. Flavonoid compounds have an important role in the inhibition of
bacteria by forming complex compounds with extracellular proteins through hydrogen bonds that degrade bacterial cell
membranes. Hydrogen and flavonoid bonds cause unstable cell wall structure and cell membrane and cellular
deterioration. Tannin compounds play a role in shrinking cell walls and membranes to interfere with cell permeability.
The impaired cell permeability means that the cell cannot perform living activities. Thus, it could inhibit bacterial growth
and kill the bacteria. In addition, terpenoid compounds act as antibacterial compounds on the outer membrane of
terpenoid cell walls by reacting with porin (transmembrane protein) to form strong polymer bonds. The polymer bonds
caused the porin to deteriorate as a connecting gateway to reduce the permeability of the bacterial cell walls; and that
caused bacterial cells to lack in the nutrient, whereby the bacterial growth is inhibited (Roslizawaty, 2013).
The water level is a factor that affects the shelf life of processed food and determines the freshness of food against
microbes. The high water content causes bacteria, mold, and yeast to multiply easily. So there will be changes in the
food. When stored in-room temperature, water level changes would be caused by the free water formed as a result of
protein denaturation by microorganisms (Nirmala, 2016). Based on the results of the present study, the water level
decreased from the beginning to the end of the storage process. This condition was caused by the evaporation of most of
the water as the storage process was only stored at room temperature. The low water content led to a decrease in bacterial
activity. However, based on the current research, the water level and the TPC indicated the opposite results, where the
water level decreased, while the TPC increased. This phenomenon was caused by the still good water level, which
allowed the bacteria to grow well. More than 30% of the water content in the food could affect bacterial growth.
Elevated microbes could damage the hydrophilic protein, resulting in a reduced ability to hold water when the water
level finally decreased (Siskos, 2007).
The pH value is an indicator that is measured to chemically determine the freshness level of fishery products. The
optimal pH for bacterial growth is 6.5-7.5. The pH value of scad fish decreased from the beginning up to 18 hours. The
pH change was caused by several factors, such as poor storage and storage temperature. The pH values obtained
indicated that the scad fish marinated in bay leaf extract had an acidic pH value. The bay leaf boiling time affected the
pH value of the leaf extract because the longer the leaves were boiled, the more organic acids from the leaves were
extracted, resulting in a decrease in the pH value of the bay leaf. The pH value is closely related to the growth of
microbes in fishery products. Fresh fish has a neutral pH, making it an ideal medium for bacterial growth (Junior, 2010).
The organoleptic test on the scad fish, with and without adding bay leaf extract, included the visual, aroma, odor, texture,
and mucus parameters. The result showed that at the starting hour, the quality of the fish was still acceptable by the
panelists according to the Indonesia Nasional Standard with a minimum organoleptic value of 6. At the starting hour, the
appearance of the scad fish received an average value in the range of 7.39 to 8.35. Meanwhile, the results of the
organoleptic test at the 18 hours of storage suggested that the visual score of the scad fish decreased from 5.48 to 6.97.
The results also indicated that there was an increasing bacterial count by hour 18. The appearance change was caused by
the growth of microbe that could damage the products as the microbe were highly destructive to food.
The odor of the scad fish averaged between 7.33 to 8.31 at the beginning of the experiment. The odor value
indicated that the fish was still fresh and smelled good. The fish smelled fresh since the bay leaves contained terpenoid
compounds containing essential oils, which produced a distinctive but less sharp aroma. After 18 hours, the average
result of the odor value decreased and was between 5.8 and 6.89. Therefore, the aroma parameter of scad fish at the
436
To cite this paper: Fuaidah P, Triastuti J, and Pramono H (2021). The Effects of Different Concentrations of Bay Leaf Extract on Shelf Life of Preserved Scad Fish. World
Vet. J., 11 (3): 431-438.beginning of the experiment up to hour 18 of all treatments A, B, C, D, and E indicated a decrease in the organoleptic
score. Treatment A gave the lowest score, reaching 5.8 at hour 18. The lowest odor score parameter on treatment A was
also supported by the result indicating the high bacterial count found in the fish, which was 8.55×10⁶. A decrease in the
organoleptic matter could occur because the room temperature could accelerate the disintegration process during the
storage of the fish. These bacteria could carry out a perfect metabolism that produced a bad odor.
Initially, the scad fish began to smell an average value of between 7.28 to 8.03, indicating that the fish was tasty,
savory, or less savory. Meanwhile, after 18 hours, the odor test was not carried out by the organoleptic test due to the
high TPC level of enzyme in the scad fish. In addition, the texture of the scad was given an average value in the range of
7.18 to 8.3, indicating that the fish were solid and elastic or less elastic. This texture was caused by the salt that was
added in the process of making preserved scad fish since salt could improve the texture of fish. The salt used in the
process of making scad fish reduced the water contents in the fish, which made the texture more solid and firm.
Meanwhile, after 18 hours, the texture of scad fish decreased from 6.27 to 6.92. Treatment A had the lowest score, 6.27
at the 18 hours. The texture parameter of treatment A was also indicated by the high bacterial count found in the fish,
which was 8.55 × 10⁶, compared to the other treatments. The high bacterial count was caused by microorganism activity
affecting the texture changes. The protein denaturation produced a simple protein, and also decreased the protein
capacity to hold water so that the texture of fish became less solid and firm.
At the starting hour, the mucus of the scad fish obtained an average score from 7.18 to 8.3, indicating that the fish
had thin and more neutral mucus and was odorless. Meanwhile, at 18 hours, the mucus content of scad fish fell from 6.13
to 6.87. The mucus parameter of the treatment is considered treatment with the lowest value of 6.13. The mucus
parameter of treatment A was also indicated by the high bacterial count found in the fish, reaching 8.55×10⁶, compared
to other treatments. Mucous could be caused by bacteria. The mucus found in the fish’s skin could be used as a
parameter to determine the freshness level of the scad fish by focusing on the clearness and thickness of the mucus. The
mucus changes were caused by the increasing number of spoilage bacteria activity on the fish after 18 hours (Lougovois
and Kyrana, 2005).
CONCLUSION
Adding bay leaf extracts to preserved scad fish indicated that the total bacterial count was lesser than the Indonesian
National Standard (SNI), of 5×10⁵ CFU/gram, which could inhibit bacterial development by 12 hours. The best result
was with treatment C (7% of bay leaf extract addition), as the concentration at this percentage could inhibit bacteria in
preserved scad fish.
DECLARATIONS
Authors’ contribution
Fuaidah designed the study, Triastuti collected the data and Pramono wrote the manuscript. Finally, all of the
authors approved the final draft of the manuscript for submission.
Competing interests
The authors have not declared any conflict of interest.
Acknowledgments
Thanks to the authors and all the staff at the Faculty of Fisheries and Marine for their supports and facilities.
REFERENCES
Ariyani F, and Yennie Y (2008). Preservation of boiled salted scad mackerel (Decapterus russelli) using chitosan. Jurnal Pascapanen
dan Bioteknologi Kelautan dan Perikanan 3 (2): 139-146. DOI: http://dx.doi.org/10.15578/jpbkp.v3i2.16
Buckle KA, Edwards RA, Fleet GH, Wooton M, and Purnomo H (1987). Ilmu Pangan. Terjemahan: H. Purnomo dan Adiono. Jakarta
Penerbit Univ Indones. Available at: https://opac.perpusnas.go.id/DetailOpac.aspx?id=508531
Hastuti S (2010). Analisis kualitatif dan kuantitatif formaldehid pada ikan asin di Madura [Formaldehyde qualitative and quantitative
analysis on salted fish in madura]. Agrointek, 4(2): 132–7. DOI: https://www.doi.org/10.21107/agrointek.v4i2.1366
Herawati H (2008). Penentuan umur simpan pada produk pangan [Determination of shelf life in food products]. Jurnal Litbang
Pertanian, 27(4): 124–30. Available at: http://203.190.37.42/publikasi/p3274082.pdf
Junianingsih I (2015). Quality test of pindang cue-besek Decapterus sp. In Jangkar Village District Situbondo. Samakia: Jurnal Ilmu
Perikanan, 6(2): 91–8. DOI: https://www.doi.org/10.5281/jsapi.v6i2.289
Junior MRM, Leite AV, and Dragano NRV (2010). Supercritical fluid extraction and stabilization of phenolic compounds from
natural sources–review (supercritical extraction and stabilization of phenolic compounds). The Open Chemical Engineering
Journal, 4: 51-60. DOI: https://www.doi.org/10.2174/1874123101004010051
437
To cite this paper: Fuaidah P, Triastuti J, and Pramono H (2021). The Effects of Different Concentrations of Bay Leaf Extract on Shelf Life of Preserved Scad Fish. World
Vet. J., 11 (3): 431-438.Lougovois, V. P., & Kyrana, V. R. (2005). Freshness quality and spoilage of chill-stored fish. In Food policy, Control and Research,
Nova Science Publishers, Inc. pp. 35-86. https://www.academia.edu/27627359/Freshness_Quality_and_Spoilage_of_Chill-
Stored_Fish
Nafisyah AL, Tjahjaningsih W, Kusdarwati R, Abdillah AA (2015). Pengaruh Alga Merah (Kappaphycus alvarezii) terhadap Mutu
Ikan Kembung (Rastrelliger sp.) [Effect of Red Algae (Kappaphycus alvarezii) on The Quality of Mackerel (Rastrelliger sp.)].
Jurnal Ilmiah Perikanan dan Kelautan, 7(1): 87–94. DOI: http://www.dx.doi.org/10.20473/jipk.v7i1.11240
Nirmala D, Masithah ED, and Purwanto DA (2016). Kitosan Sebagai Alternatif Bahan Pengawet Kamaboko Ikan Kurisi (Nemipterus
nematophorus) pada Penyimpanan Suhu Dingin [Chitosan as an Alternative Preservative Material for Curry Fish (Nemipterus
nematophorus) in Cold Storage]. Jurnal Ilmiah Perikanan dan Kelautan, 8(2): 109-125. http://journal.unair.ac.id/download-
fullpapers-jipk7df6c50aa02full.pdf
Nurwijayanti, Hasdianah, and Suhita BM (2016). Rekayasa Daun Salam untuk Pengawetan Ikan dalam Upaya Menghindari
Penggunaan Efek Formalin terhadap Kesehatan Tubuh [Bay Leaf Engineering for Fish Preservation in an Effort to Avoid the Use
of Formalin Effects on Body Health]. STIKes Surya Mitra Husada Kediri, 1: 120–128. Available at:
https://docplayer.info/46728577-Rekayasa-daun-salam-untuk-pengawetan-ikan-dalam-upaya-menghindari-penggunaan-efek-
formalin-terhadap-kesehatan-tubuh-stikes-surya-mitra-husada-kediri.html
Purwani E, and Muwakhidah (2008). Efek Berbagai Pengawet Alami sebagai Pengganti Formalin Terhadap Sifat Organoleptik dan
Masa Simpan Daging dan Ikan [Effects of Various Natural Preservatives as Substitutes for Formalin on Organoleptic Properties
and Shelf Life of Meat and Fish]. Jurnal Penelitian Sains and Teknologi, 9(1):1-14. Available at:
https://publikasiilmiah.ums.ac.id/bitstream/handle/11617/414/1.%20ENI%20PURWANI%202.pdf?sequence=1&isAllowed=y
Roslizawaty, Ramadani NY, Fakhrurrazi, and Herrialfian (2013). Antibacterial Activity of Ethanol’s Extract and Stew of Ant Plant
(Myrmecodia sp.) Against Bakteria Escherichia coli . Jurnal Medika Veterinaria, 7(2): 91-94.
http://jurnal.unsyiah.ac.id/JMV/article/download/2938/2788
Sahputra NW (2015). Daya Simpan Ikan Bandeng Yang Diawetkan Menggunakan Pengawet Alami Kombinasi Daun Salam (Eugenia
polyantha, Weight.) [Shelf Life of Milkfish Preserved Using Natural Preservatives Combination of Bay Leaves (Eugenia
polyantha, Weight.)] Dan Garam. Universitas Muhammadiyah Surakarta, 1: 1-11. Available at:
http://eprints.ums.ac.id/35371/1/Naskah%20Publikasi.pdf
Siskos I, Zotos A, Melidou S, and Tsikritzi R (2007). The effect of liquid smoking of fillets of trout (Salmo gairdnerii) on sensory,
microbiological and chemical changes during chilled storage. Food Chemistry, 101(2): 458–464. DOI:
https://www.doi.org/10.1016/j.foodchem.2006.02.002
Triarso I (2012). Potential and opportunities for developing capture fisheries business in the north coast of Central Java. Saintek
Perikanan: Indonesian Journal of Fisheries Science and Technology, 8(1): 65-73. DOI: https://www.doi.org/10.14710/ijfst.8.1.65-
73
York RK, and Sereda LM (1994). Sensory assessment of quality in fish and seafoods. In: Shahidi F., Botta J.R. (eds) Seafoods:
Chemistry, Processing Technology and Quality. Springer, Boston, MA. pp 233-262. https://www.doi.org/10.1007/978-1-4615-
2181-5_13
438
To cite this paper: Fuaidah P, Triastuti J, and Pramono H (2021). The Effects of Different Concentrations of Bay Leaf Extract on Shelf Life of Preserved Scad Fish. World
Vet. J., 11 (3): 431-438.You can also read