Efficiency Assessment and Mathematical Correlations Development between Bod and Other Parameters in Jalandhar Sewage Treatment
←
→
Page content transcription
If your browser does not render page correctly, please read the page content below
ISSN: 2319-8753

        International Journal of Innovative Research in Science,
                      Engineering and Technology
                                    (An ISO 3297: 2007 Certified Organization)

                                              Vol. 3, Issue 6, June 2014

    Efficiency Assessment and Mathematical
   Correlations Development between Bod and
    Other Parameters in Jalandhar Sewage
                   Treatment
                                    E. Johal1, B. S Walia2, M.S. Saini3, M.K. Jha4
             PTU-Jalandhar, Jalandhar-Kapurthala Highway, Post Bag No. 01, Kapurthala, Punjab, India.
            Ph.D. Associate Professor, Department of Civil Engineering, GNDEC, Ludhiana, Punjab, India
                                    Ph.D. Director, GNDEC, Ludhiana Punjab, India
                       Ph.D. Professor, Department of Chemical Engineering, NIT, Jalandhar, India

ABSTRACT : For sixteen weeks wastewater treatment in sewage treatment plant at Jalandhar, Punjab was considered
for present studies. Sixteen waste water samples were collected at different stages of treatment units and analyzed for
the major water quality parameters, such as biological oxygen demand (BOD), chemical oxygen demand (COD), total
suspended solids (TSS) and Ammoniacal-N concentration. The performance efficiency of each unit in treating the
pollutants was calculated. Percentage removal of BOD, COD, TSS and ammonical-N explains the satisfying overall
efficiency of the plant. A mathematical correlation is established between the influent and treated effluent parameters,
specifically in relation to the BOD parameter indicated the prior basis and the assessment criteria of the effluent
product.

KEYWORDS: Wastewater treatment, sewage treatment plant, mathematical correlation, biological oxygen demand.

                                              I.        INTRODUCTION

It’s nearly two decades since UASB (Upflow Anaerobic Sludge Blanket) concept for sewage (municipal wastewater)
treatment was started in India and today it has taken an edge over the other developing countries having similar
climatic conditions in the use of this technology. At present, about 23 full-scale UASB plants are in operation at
various places in India with total installed capacity of about 9,85,000 m3/day (985 mld) and about 20 number are in
pipeline which are likely to be commissioned within next 3-4 years. It also presents the potential of UASB technology
in other developing countries with its future within India as well based on the evaluation of life cycle cost (LCC). Other
sewage treatment technologies were also included while evaluating LCC [1].
Worldwide presently over 200 full-scale UASB plants are in operation for the treatment of both domestic and industrial
wastewaters. However, in India the UASB Process is being widely adopted for domestic wastewater and it can be
claimed that 80% of total UASB reactors worldwide for domestic wastewater treatment is in India. The basic approach
towards selection of technology for sewage was low capital costs, low energy requirements, low O&M costs and
sustainability aspect. This was derived from the experience of Ganga Action Plan. The conventional aerobic systems
were their high energy requirements, unreliable power supply situation in the states, and higher O&M costs; while
those in favor of UASB were their robustness, low or no dependence on electricity, low cost of O&M [2].
Conventionally, anaerobic processes are to be used for the treatment of high strength organic wastewaters. However,
typical hydro-dynamics of UASB coupled with its unique characteristic of holding high granular biomass, made it
possible to apply the anaerobic processes for the treatment of low strength wastewaters.

Copyright to IJIRSET                                         www.ijirset.com                                       13088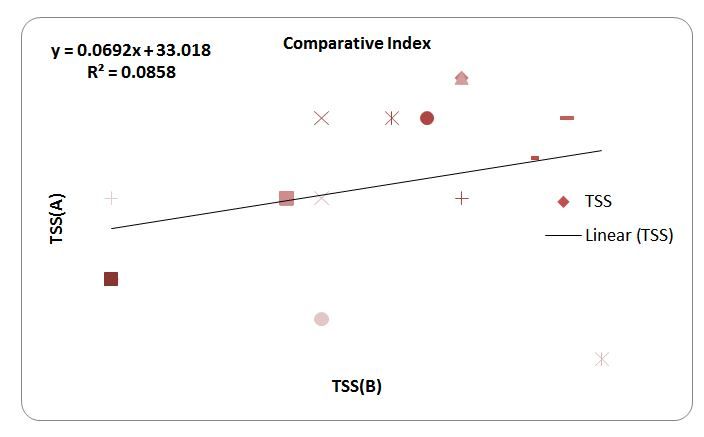
ISSN: 2319-8753

        International Journal of Innovative Research in Science,
                      Engineering and Technology
                                    (An ISO 3297: 2007 Certified Organization)

                                              Vol. 3, Issue 6, June 2014

                                              II.       LITERATURE SURVEY

[3] studied the physico-chemical and biological parameters of Agra city groundwater from March 1997-1998 and there
values were compared to assess the seasonal variation that occurred from October to March. Parameters like pH, TDS,
Total Hardness, Total Alkalinity, Ca2+ , Mg 2+, NO3, Cl- and Coliform showed a downward trend from April to June
and increased abruptly during the rainy season i.e. July to October. The abrupt rise may be due to seepage of
contaminants with rain water and geochemical deposition within the vicinity of groundwater structures that need
further study. No specific trend was seen for fluoride because monsoon has little impact on fluoride of aquifers.
[4] conducted a laboratory study to monitor the groundwater quality of selected sites of Ghazipur city, Uttar Pradesh by
examining various physico-chemical parameters like pH, TDS, Dissolved Oxygen, Total Hardness, Total Alkalinity,
Sodium, Potassium and 14 Chlorides. The sampling was carried out in the month of April 2007 from five different sites
i.e. Rauzza, Aamghat, Vishweshwar Ganj, Shastri Nagar and Gora Bazaar. It was found that the pH ranged from 6.8-
8.3 whereas TDS ranges from 145-245 mg/l which was within the prescribed limits of Indian Council of Medical
Research (ICMR). Calcium Hardness ranges from 99-158 mg/l and Dissolved Oxygen from 3.4-5 mg/l indicating
nearly pure symptoms. A comparison with ICMR standards shows that the water is nearly fit for drinking purposes but
Disinfection by-Products (DBP) analysis is recommended because of higher Dissolved Oxygen Carbon (DOC) and
groundwater analysis must be done timely.
[5] carried out epidemiological survey of 110 samples in Ludhiana city which included treated source water, treated
piped water and treated piped filtered water. Water samples were collected from Municipal Council supply lines of
Ludhiana city. The samples of drinking water were tested according to IS-10500-1991 BIS and Bacteriological water
testing kit in the months of July and August. Out of 110 drinking water samples 37 samples were bacteriological
potable which included areas like Bhai Randhir Singh Nagar and Sarabha Nagar and 73 were non potable included
areas Haibowal, Tajpur Road. Water samples from 40 filters were drawn and tested for bacteriological potability. A
total of 80% samples were non potable after 96 hours of incubation. The potability of piped water was tested by
conventional technique and result was positive. The elemental analysis of water samples was also done and found
elements Al, Na, Ca, Fe, K, Mg and S were present below permissible limits. Thus researchers suggested proper
chlorination and timely analysis of potential biofilm formation in pipes.
[6] an investigation was made to evaluate the extent of water pollution at Eloor, Ernakulum District, Kerala. The area
was divided into four zones and total of 40 water samples from different location was collected, analyzed and
correlation analysis was made. 15 Magnesium and Chloride exceeded the desirable limits in some areas. Significant
positive correlation was observed between Electrical Conductivity, Total Hardness and Chloride.
[7] studied the Fluorosis Mitigation Process in Dungarpur, Rajasthan. The fluoride concentration in 17 states of India is
1-48 mg/l out of which West Bengal is at the top followed by Uttar Pradesh, Tamil Nadu, Rajasthan, Punjab, Orissa,
Maharashtra and many more. Fluoride in excess of 1.0 mg/l can cause dental fluorosis, skeletal fluorosis i.e. loss of
appetite, stiffness of neck. In Rajasthan 18 out of 32 districts are fluorotic which contains 2 to 20 mg/l of fluoride.
Defluoridation at domestic level can be done by Nalgonda technique and Activated alum technique and popularized
under the sponsorship of UNICEF.
[8] carried out a study of physico-chemical parameters and conductivity of some heavy metals such as iron, cobalt,
cadmium, lead, mercury, chromium, selenium and arsenic in industrial effluent water of Okhla Industrial Area Phase-2
and then groundwater of nearby areas. The results were compared with ISI and WHO drinking water standards. The
discharge of untreated effluent by the industries is leading to contamination of groundwater of surrounding areas. Lead,
mercury, fluoride, TDS, sulphates was above the desirable limits.
[9] studied groundwater samples from 60 locations in Erode District, Tamil Nadu during pre-monsoon and post
monsoon seasons. Groundwater samples were tested for 11 physico-chemical parameters. Water quality index was
prepared which revealed that at some places water was contaminated due to high concentration of alkalinity, turbidity
and magnesium.
[10] carried out the study at Rupnagar, Punjab to study the land use and land-cover change in the area and its
groundwater quality. The results showed that the quantity of groundwater increased due to natural and artificial
recharge due to land use and and 16 cover pattern. The quality of groundwater deteriorated due to input of fertilizers
for enhancing the short term soil fertility. RS-GIS were used for preparation of thematic layers.
[11] Statistical study on pre-monsoon and post-monsoon variation of groundwater level was done by collection and
analysis of various parameters. It was noted that the Theni District depth to water level was not uniform in the period of

Copyright to IJIRSET                                         www.ijirset.com                                       13089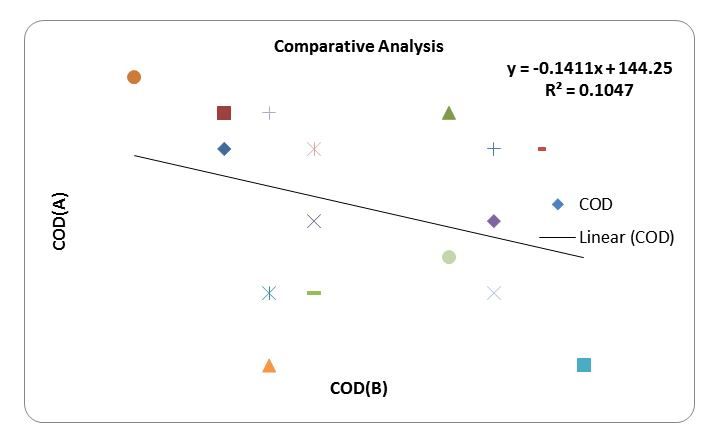
ISSN: 2319-8753

        International Journal of Innovative Research in Science,
                      Engineering and Technology
                                    (An ISO 3297: 2007 Certified Organization)

                                              Vol. 3, Issue 6, June 2014

2005-2007 and it was limited to areas having 2-5 meter below ground level (m.bgl). out of 8 blocks, 5 blocks are
categorized as overburden and 3 blocks as critical.
[12] collected the groundwater samples from 20 locations in the radius of 25 km of Kaithal city.
2.1 Advantages and disadvantages of anaerobic treatment.
Anaerobic digestion processes have already been applied since the end of the 19th century for the stabilization of
primary and secondary sludge from activated sludge processes and the treatment of night soil in septic tanks and simple
biogas digesters.
Anaerobic treatment of raw domestic/ municipal sewage is, however, a more recent development which has barely
found entrance into common know-how and experience, in particular in industrialized countries. Therefore, financing
institutions still tend to rather transfer activated sludge systems with anaerobic sludge digestion, which are suitable for
cold climates, since the bulk of the cold wastewater cannot be heated to allow for anaerobic treatment. Treatment
already reach removal efficiencies of 65%, 80% and 70% for COD, BOD and TSS (total suspended solids) respectively.
Joint anaerobic treatment of sludge and wastewater is attractive (given sufficient sewage temperature) due to low
investment and maintenance costs, no primary clarifier required, no sludge digester required (stabilization of suspended
organic matter in anaerobic reactor), low land requirements, local production of construction material and mechanical
plant. Moreover it requires low demand for process energy (no energy consuming aerators): thus a considerable
reduction of CO2 emissions due to low consumption of fossil energy and simultaneous surplus energy production. Also
reduction of CH4 emissions from uncontrolled disposal/decomposition of wastewater due to the collection of the gas
formed during the process, low sludge production and high sludge quality (the sludge, if not loaded with pathogens or
heavy metals, can readily be applied to agricultural land) are among the key advantages of this process [13] [14]..
The main disadvantages of these treatment systems include lower treatment efficiencies (about 5- 10% less than in
activated sludge processes if no post-treatment is installed) while no nutrients (N, P) are removed without post
treatment. The H2S content present in the gas can lead to problems with bad smell and corrosion. Compared to pond
systems, a rather poor pathogen removal capacity if no post treatment is installed and an economically not feasibility to
keep working sewage temperatures below 15 °C. Most of the world’s anaerobic sewage treatment plants of this type
have been built in countries with a large internal market like Mexico, Brazil, India, China and Colombia. Some relevant
large sewage treatment plants implementing UASB technology are presently also under construction with German
cooperation in Venezuela, Ecuador and Egypt.
A mathematical model (MSB Model) was set up to predict the development of the FBFs characteristics such as biofilm
growth, substrates utilization, dissolved oxygen consumption, BOD loading removal, volumetric oxygen consumption
rate by filter (OCF), and bead bed volume under the different conditions. This model was then calibrated with a set of
bioclarification data. The model results were consistent with literature defining the relationships between dissolved
oxygen consumption, BOD loading removal, and biofilm growth. This model is specifically used to predict design
parameters for FBFs in municipal sewage treatment systems. The entire study was based on the following experimental
parameters: OCF, dissolved oxygen (DO), hydraulic loading, BOD loading, maximum ratio of BOD removal to OCF
(MX-factor) [15].

                                               III.     MATERIALS AND METHODS

Treated and untreated samples were collected from wastewater treatment plant at Jalandhar, Punjab under closely
controlled and maintaining similar conditions. The plant receives about 100 MLD of sewage daily of inhabitants,
hospitals and institutions. Wastewater before any treatment and after biological treatment inclusive of disinfection was
analyzed for total suspended solids (TSS), Ammoniacal-N, biochemical oxygen demand (BOD) and chemical oxygen
demand (COD) using standard methods [2]
3. 1 Analysis
Both physico-chemical and bio-chemical analysis were carried out using for both the untreated i.e. raw wastewater and
after primary secondary sewage treatments. Analysis for total suspended solid (TSS), ammoniacal-N, biological oxygen
demand (BOD) and chemical oxygen demand (COD) were conducted using the standard methods [16]. All statistical
analyses of data obtained from pilot plant tests were conducted using a regression analysis method [17] and Microsoft
Excel spreadsheets. The confidence levels were set at 95%.

Copyright to IJIRSET                                         www.ijirset.com                                       13090
ISSN: 2319-8753
International Journal of Innovative Research in Science,
Engineering and Technology
(An ISO 3297: 2007 Certified Organization)
Vol. 3, Issue 6, June 2014
IV. RESULTS AND DISCUSSION
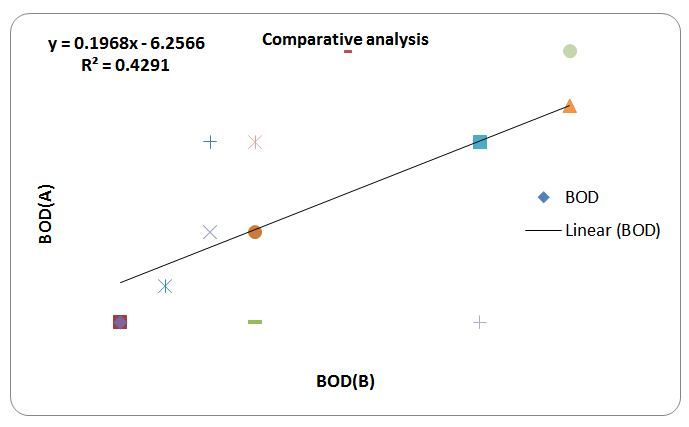
4.1 BOD analysis
BOD is basically a bacterial bioassay test that provides an estimate of the biodegradability of the organic content of the
wastewater. Typical raw sewage (wastewater) has a BOD in the 180 to 220 mg/L range and the prescribed limit lies
below 30 mg/L. Results of this analysis before wastewater treatment and after anaerobic treatment are shown in table-1
and figure-1 shows the final comparison analysis of the samples before (B) and after (A) treatment. Variation of BOD
(A) i.e. BOD value after anaerobic treatment of wastewater with that of BOD (B) i.e. BOD value of raw wastewater
(before treatment) is mentioned in equation-1. This equation is the sole outcome after the regression analysis of the
obtained BOD values.
BOD(A) = 0.196 BOD(B)-6.256 - (1)
Table-1 BOD levels before and after treatment.
Before Treatment (mg/l) After Biological Treatment (mg/l)
Sample No. BOD-B BOD-A
1. 165 26
2. 165 26
3. 170 27.2
4. 166 26.5
5. 165.5 26.2
6. 166.5 26.5
7. 166 27
8. 167.5 27.5
9. 166.5 26
10. 165 26
11. 169 27
12. 170 27.2
13. 166 26.5
14. 166.5 27
15. 170 27.5
16. 169 26
Figure-1 Comparative BOD analysis of the status of the before and after treatment of 16 wastewater samples.
4.2 COD analysis
Copyright to IJIRSET www.ijirset.com 13091ISSN: 2319-8753
International Journal of Innovative Research in Science,
Engineering and Technology
(An ISO 3297: 2007 Certified Organization)
Vol. 3, Issue 6, June 2014
COD is a much more severe test that uses chemicals, e.g. acids, and heat, to digest and oxidize both organic and
inorganic compounds that are in the wastewater. COD should always be greater than BOD for the same sample. Since
BOD is a measure of the biodegradability of the wastewater the ratio of BOD to COD can help further assess the type
of biological treatment that is appropriate. Typical raw sewage (wastewater) has a COD in the 500 to 600 mg/L range
and the prescribed limit lies below 250 mg/L. Results of this analysis before wastewater treatment and after anaerobic
treatment are shown in table-2 and figure-2 shows the final comparison analysis of the samples before (B) and after (A)
treatment. Variation of COD (A) i.e. COD value after anaerobic treatment of wastewater with that of COD (B) i.e.
COD value of raw wastewater (before treatment) is mentioned in equation-2. This equation is the sole outcome after
the regression analysis of the obtained COD values.
COD(A) = - 0.141 COD(B) +144.2 -- (2)
Table-2 COD levels before and after treatment.
Before Treatment (mg/l) After Biological Treatment (mg/l)
Sample-No. COD-B COD-A
1. 550 67
2. 550 67.5
3. 555 67.5
4. 552 66
5. 551 65
6. 548 68
7. 556 67
8. 557 67
9. 552 65
10. 556 66
11. 558 64
12. 551 64
13. 556 65
14. 552 67
15. 555 65.5
16. 551 67.5
Figure-2 Comparative COD analysis of the status of the before and after treatment of 16 wastewater samples.
4. 3 TSS
TSS is a measure of the floating particulate content of the wastewater and, in some ways, is an indicator of the clarity
of the wastewater. Typical municipal wastewaters will have a TSS in the 180 to 220 mg/L range and effluent
Copyright to IJIRSET www.ijirset.com 13092ISSN: 2319-8753
International Journal of Innovative Research in Science,
Engineering and Technology
(An ISO 3297: 2007 Certified Organization)
Vol. 3, Issue 6, June 2014
requirements for TSS for primary plants are in the range of 100 to 130 mg/L TSS. Results of this analysis before
wastewater treatment and after anaerobic treatment are shown in table-3 and figure-3 shows the final comparison
analysis of the samples before (B) and after (A) treatment. Variation of TSS (A) i.e. TSS value after anaerobic
treatment of wastewater with that of TSS (B) i.e. TSS value of raw wastewater (before treatment) is mentioned in
equation-3. This equation is the sole outcome after the comparative regression analysis of the obtained TSS values.
TSS(A) = 0.069 TSS(B)+33.01 - (3)
Table-3 TSS levels before and after treatment.
Before Treatment (mg/l) After Biological Treatment (mg/l)
Sample TSS-B TSS-A
No.
1. 240 49
2. 240 49
3. 245 50
4. 246 51
5. 248 51
6. 249 51
7. 250 50
8. 252 50.5
9. 253 51
10. 250 51.5
11. 245 50
12. 250 51.5
13. 246 50
14. 254 48
15. 246 48.5
16. 240 50
Figure-3 Comparative TSS analysis of the status of the before and after treatment of 16 wastewater samples.
4.4 Ammonical N
Ammonia is a wastewater constituent that results from the degradation of proteins. Raw wastewater typically has
ammonia concentrations in the 20 to 30 mg/L range, as N, nitrogen. Results of this analysis before wastewater
treatment and after anaerobic treatment are shown in table-4.
Copyright to IJIRSET www.ijirset.com 13093ISSN: 2319-8753
International Journal of Innovative Research in Science,
Engineering and Technology
(An ISO 3297: 2007 Certified Organization)
Vol. 3, Issue 6, June 2014
Table-4 Ammonical-N levels before and after treatment.
Before Treatment (mg/l) After Biological Treatment (mg/l)
Sample- Ammonical-N Ammoniacal-N
No.
1. 28 25
2. 28 25
3. 26 24
4. 26 24
5. 27 25
6. 26 25
7. 29 26
8. 28 24
9. 28 25
10. 28 25
11. 29 26
12. 28 25
13. 26 24
14. 27.5 25
15. 28 26
16. 26 26
4.5 Relationship between TSS and BOD (Influent TSS - BOD and Effluent TSS - BOD)
4.5.1 Relationship between TSS-B and BOD-B: The relationship between the TSS-B and BOD-B of all the sixteen
samples during the analysis is shown in Figure-4. The data were obtained from the pilot plant tests as shown in Table-1
and 3. BOD and TSS levels for all the sixteen untreated samples were in the range of 165-170 mg/L and ranged from
240 to 254 mg/L. The influent BOD was correlated with the TSS in equation-4.
BOD (B) = - 0.0694 TSS(B) + 258.73 - (4)
Use of the correlation equation estimates BOD-B based on TSS-B. There is absolute disproportionate relation in the
BOD-B concentration and TSS-B concentration levels with R² = 0.0009. Large increases in TSS are generally
associated with the flushing of inorganic material from the land surface and sewers.
255 y = -0.0694x + 258.73
R² = 0.0009
250
BOD-B
245
240
235
164 165 166 167 168 169 170 171
TSS-B
Figure-4 Relationship between before treatment or influent TSS-B and BOD-B.
4.5.2 Relationship between TSS-A and BOD-A: The relationship between the TSS-A and BOD-A of all the sixteen
samples during the analysis is shown in Figure-5. The data were obtained from the pilot plant tests as shown in table-1
and 3. The effluent BOD was correlated with the effluent TSS in equation-5.
BOD (A) = -0.1052 TSS(A) + 31.906 - (5)
Copyright to IJIRSET www.ijirset.com 13094ISSN: 2319-8753
International Journal of Innovative Research in Science,
Engineering and Technology
(An ISO 3297: 2007 Certified Organization)
Vol. 3, Issue 6, June 2014
Use of the correlation equation estimates BOD-A based on TSS-A. There is very minor relativity between the BOD-A
concentration and TSS-A concentration levels with R² = 0.0387. This means that the strength of the relationship
between TSS-A and BOD-A was very weak, with less than 4% correlation.
28 y = -0.1052x + 31.906
27.5 R² = 0.0387
BOD-A
27
26.5
26
25.5
47.5 48 48.5 49 49.5 50 50.5 51 51.5 52
TSS-A
Figure-5 Relationship between before treatment or influent TSS-A and BOD-A.
4.6 Correlation between BOD and COD
Since, the COD represents virtually all organic matter, either partially degradable or non-biodegradable and BOD the
total oxygen demand, it is necessary to develop relationship between BOD and COD. Since BOD is a measure of the
biodegradability of the wastewater, the ratio of BOD-B to COD-B can help further assess the type of biological
treatment that is appropriate (Eckenfelder, 1989). Present study possesses a prior BOD-B to COD-B ratio in the range
of 0.302±0.004 as mentioned in table-5. This indicates that aerobic biological treatment, like that at the French Creek
and Duke Point treatment plants would also have been appropriate. BOD-B and COD-B levels for all the sixteen
untreated samples were in the range of 165-170 mg/L and ranged from 548 to 558 mg/L. The influent BOD was
correlated with the COD in equation-6. Use of the correlation equation estimates BOD-B based on COD-B. There is
again very minor proportionality in the BOD-B and COD-B concentration levels with R² = 0.0639.
COD(B) = 0.4013 BOD(B) + 486.07 - (6)
Table-5 BOD-B and COD-B levels before treatment and their ratios.
BOD-B COD-B BOD-B/COD-B
165 550 0.3
165 550 0.3
170 555 0.306
166 552 0.3
165.5 551 0.3
166.5 548 0.304
166 556 0.298
167.5 557 0.3
166.5 552 0.301
165 556 0.296
169 558 0.302
170 551 0.308
166 556 0.298
166.5 552 0.301
170 555 0.306
169 551 0.306
Copyright to IJIRSET www.ijirset.com 13095ISSN: 2319-8753
International Journal of Innovative Research in Science,
Engineering and Technology
(An ISO 3297: 2007 Certified Organization)
Vol. 3, Issue 6, June 2014
V. CONCLUSION
The wastewater treatment performance in the sewage treatment plant at Jalandhar, Punjab indicated a positive
efficiency of the system. The overall efficiency after analyzing the 16 samples is in the order of COD > TSS > BOD >
ammonical-N. The performance of the treatment system was up to the mark in both the cases. The average percentage
removal of BOD in the treatment plants is around 85% illustrating an efficient BOD reduction, for COD it is 89% and
for TSS it is around -80%. Unfortunately the ammonical-N average percentage removal lies very low with just around
15% removal efficiency [18] [19]. The overall efficiency of the plant is satisfactory and the mathematical correlations
provide a clear indication of the prior basis and the assessment criteria of the effluent product.
REFERENCE
[1] Khalil, N., Mittal, A. K., Raghav, A. K. & Rajeev, S. "UASB technology for sewage treatment in india: 20 years experience".
Environmental Engineering & Management Journal, 5. (2006)
[2] Franson, M. A. H.. "American public health association American water works association water environment federation". Methods, 6, 84,
41. (1995)
[3] Singh et al. (2011), “Assessment of ground water resources of Panandhro lignite mining region, Gujarat state, India”. International Journal
of Environmental Sciences. Vol 1(7), pp 1549-1558.
[4] Pandey and Tiwari (2008), “Physico-chemical analysis of ground water of selected area of Ghazipur city- A case study”. Nature and
science. Vol. 6(4), pp 25-28.
[5] Sahota (2010), “Biomonitoring of indicator and emerging pathogens in piped drinking water in Ludhiana, India”. Report and Opinion.
Vol. 2(1), pp 14-20.
[6] George et at. (2010), “An investigation of the quality of underground water at Eloor in Ernakulum District of Kerala, India”. E-Journal of
Chemistry. Vol 7(3), pp 908-914.
[7] Vaish (2009), “A case study of fluorosis mitigation in Dungarpur District, Rajasthan, India”. 3rd International workshop on fluorosis
prevention and defluoridation of water, pp 97-104.
[8] W. Ahmad Siddiqui et al. (2009), “Assessment of the impact of industrial effluence on ground water quality in Okhla Industrial Area,
New Delhi, India”. E-Journals of Chemistry, Vol. 6(S1), pp S41-S46.
[9] Elangovan (2010), “Ground water quality characteristics at Erode District, Tamil Nadu, India”. International Journal of Environmental
Sciences, Vol. 1(2), pp 145-150.
[10] Mukherjee and Singh (2010), “Impact of land use and land cover change on ground water quality in lower Shiwalik hills: A remote
sensing and GIS based approach”. Central European Journal of Geo Sciences. Vol 2(2), pp 124-131...
[11] Sukumar (2011), “Statistical study on pre and post monsoon variation of ground water level in Theni District, Tamil Nadu-India”.
International Journal of Environmental Sciences. Vol 1(5), pp 798-813.
[12] Saharan (2009), “Physicochemical analysis of groundwater of selected area of Kaithal City, Haryana, India”. Researcher. Vol. 1(2), pp 1-
5.
[13] Aiyuk, S., Forrez, I., Lieven, D. K., Van Haandel, A. & Verstraete, W. "Anaerobic and complementary treatment of domestic sewage in
regions with hot climates"-A review. Bioresource Technology, 97(17), 2225-2241. (2006).
[14] Angelidaki, I., Ellegaard, L. & Ahring, B. K.. "A comprehensive model of anaerobic bioconversion of complex substrates to biogas".
Biotechnology and Bioengineering, 63(3), 363-372. (1999).
[15] Castillo, A. & Mata-Alvarez, J. "A kinetic study of a combined anaerobic–aerobic system for treatment of domestic sewage". Water
Research, 33(7), 1742-1747. (1999).
[16] APHA. "Standard methods. 19th Edition". American Public Health Association, Washington, DC. (1995).
[17] Scheaffer RL, Mcclave JT. "Probability and statistics for engineers". Wadsworth Publishing Company, Belmont, California.(1990).
[18] Chernicharo, C. D. "Post-treatment options for the anaerobic treatment of domestic wastewater". Reviews in Environmental Science and
Bio/Technology, 5(1), 73-92. (2006).
[19] Colmenarejo, M., Rubio, A., Sanchez, E., Vicente, J., Garcia, M. & Borja, R. "Evaluation of municipal wastewater treatment plants with
different technologies at Las Rozas, Madrid (Spain)". Journal of environmental management, 81(4), 399-404. (2006).
Copyright to IJIRSET www.ijirset.com 13096You can also read