Petróleos Mexicanos: 2019 Financial and Operating Outlook - January 2019 New York - Pemex
←
→
Page content transcription
If your browser does not render page correctly, please read the page content below
“Antonio M. Amor” Refinery
Salamanca, Gto. Mex.

                           Petróleos Mexicanos:
                   2019 Financial and Operating Outlook

                                January 2019
                                  New York
Forward-Looking Statement &
                                                                                              Cautionary Note
 Variations
 If no further specification is included, comparisons are made against the same realized period of the last year.
 Rounding
 Numbers may not total due to rounding.
 Financial Information
 Excluding budgetary and volumetric information, the financial information included in this report and the annexes hereto is based on unaudited consolidated financial statements prepared in accordance with International Financial Reporting
 Standards as issued by the International Accounting Standards Board (“IFRS”), which PEMEX has adopted effective January 1, 2012. Information from prior periods has been retrospectively adjusted in certain accounts to make it comparable with the
 unaudited consolidated financial information under IFRS. For more information regarding the transition to IFRS, see Note 23 to the consolidated financial statements included in Petróleos Mexicanos’ 2012 Form 20-F filed with the Securities and
 Exchange Commission (SEC) and its Annual Report filed with the Comisión Nacional Bancaria y de Valores (CNBV). EBITDA is a non-IFRS measure. We show a reconciliation of EBITDA to net income in Table 32 of the annexes to PEMEX’s Results
 Report as of March 31, 2018. Budgetary information is based on standards from Mexican governmental accounting; therefore, it does not include information from the subsidiary companies or affiliates of Petróleos Mexicanos. It is important to
 mention, that our current financing agreements do not include financial covenants or events of default that would be triggered as a result of our having negative equity.
 Methodology
 We might change the methodology of the information disclosed in order to enhance its quality and usefulness, and/or to comply with international standards and best practices.
 Foreign Exchange Conversions
 Convenience translations into U.S. dollars of amounts in Mexican pesos have been made at the exchange rate at close for the corresponding period, unless otherwise noted. Due to market volatility, the difference between the average exchange rate,
 the exchange rate at close and the spot exchange rate, or any other exchange rate used could be material. Such translations should not be construed as a representation that the Mexican peso amounts have been or could be converted into U.S.
 dollars at the foregoing or any other rate. It is important to note that we maintain our consolidated financial statements and accounting records in pesos. As of September 30, 2018, the exchange rate of MXN 18.8120 = USD 1.00 is used.
 Fiscal Regime
 Beginning January 1, 2015, Petróleos Mexicanos’ fiscal regime is governed by the Ley de Ingresos sobre Hidrocarburos (Hydrocarbons Revenue Law). From January 1, 2006 and to December 31, 2014, PEP was subject to a fiscal regime governed
 by the Federal Duties Law, while the tax regimes of the other Subsidiary Entities were governed by the Federal Revenue Law.
 On April 18, 2016, a decree was published in the Official Gazette of the Federation that allows assignment operators to choose between two schemes to calculate the cap on permitted deductions applicable to the Profit-Sharing Duty: (i) the scheme
 established within the Hydrocarbons Revenue Law, based on a percentage of the value of extracted hydrocarbons; or (ii) the scheme proposed by the SHCP, calculated upon established fixed fees, USD 6.1 for shallow water fields and USD 8.3 for
 onshore fields.
 The Special Tax on Production and Services (IEPS) applicable to automotive gasoline and diesel is established in the Production and Services Special Tax Law “Ley del Impuesto Especial sobre Producción y Servicios”. As an intermediary between
 the Ministry of Finance and Public Credit (SHCP) and the final consumer, PEMEX retains the amount of the IEPS and transfers it to the Mexican Government. In 2016, the SHCP published a decree trough which it modified the calculation of the IEPS,
 based on the past five months of international reference price quotes for gasoline and diesel.
 As of January 1 2016, and until December 31, 2017, the SHCP will establish monthly fixed maximum prices of gasoline and diesel based on the following: maximum prices will be referenced to prices in the U.S. Gulf Coast, plus a margin that includes
 retails, freight, transportation, quality adjustment and management costs, plus the applicable IEPS to automotive fuel, plus other concepts (IEPS tax on fossil fuel, established quotas on the IEPS Law and value added tax).
 PEMEX’s “producer price” is calculated in reference to that of an efficient refinery operating in the Gulf of Mexico. Until December 31, 2017, the Mexican Government is authorized to continue issuing pricing decrees to regulate the maximum prices for
 the retail sale of gasoline and diesel fuel, taking into account transportation costs between regions, inflation and the volatility of international fuel prices, among other factors. Beginning in 2018, the prices of gasoline and diesel fuel will be freely
 determined by market conditions. However the Federal Commission for Economic Competition, based on the existence of effective competitive conditions, has the authority to declare that prices of gasoline and diesel fuel are to be freely determined
 by market conditions before 2018.
 Hydrocarbon Reserves
 In accordance with the Hydrocarbons Law, published in the Official Gazette on August 11, 2014, the National Hydrocarbons Commission (CNH) will establish and will manage the National Hydrocarbons Information Center, comprised by a system to
 obtain, safeguard, manage, use, analyze, keep updated and publish information and statistics related; which includes estimations, valuation studies and certifications. On August 13, 2015, the CNH published the Guidelines that rule the valuation and
 certification of Mexico’s reserves and the related contingency resources.
 As of January 1, 2010, the Securities and Exchange Commission (SEC) changed its rules to permit oil and gas companies, in their filings with the SEC, to disclose not only proved reserves, but also probable reserves and possible reserves.
 Nevertheless, any description of probable or possible reserves included herein may not meet the recoverability thresholds established by the SEC in its definitions. Investors are urged to consider closely the disclosure in our Form 20-F and our
 Annual Report to the CNBV and SEC, available at http://www.pemex.com/.
 Forward-looking Statements
 This report contains forward-looking statements. We may also make written or oral forward-looking statements in our periodic reports to the CNBV and the SEC, in our annual reports, in our offering circulars and prospectuses, in press releases and
 other written materials and in oral statements made by our officers, directors or employees to third parties. We may include forward-looking statements that address, among other things, our:
• exploration and production activities, including drilling;                                                                                 • effects on us from competition, including on our ability to hire and retain skilled personnel;
• activities relating to import, export, refining, petrochemicals and transportation, storage and distribution of petroleum,                 • limitations on our access to sources of financing on competitive terms;
    natural gas and oil products;                                                                                                            • our ability to find, acquire or gain access to additional reserves and to develop the reserves that we obtain
• activities relating to our lines of business, including the generation of electricity;                                                       successfully;
• projected and targeted capital expenditures and other costs, commitments and revenues;                                                     • uncertainties inherent in making estimates of oil and gas reserves, including recently discovered oil and gas
• liquidity and sources of funding, including our ability to continue operating as a going concern;                                            reserves;
• strategic alliances with other companies; and                                                                                              • technical difficulties;
• the monetization of certain of our assets.                                                                                                 • significant developments in the global economy;
• Actual results could differ materially from those projected in such forward-looking statements as a result of various factors              • significant economic or political developments in Mexico;
    that may be beyond our control. These factors include, but are not limited to:                                                           • developments affecting the energy sector; and
• changes in international crude oil and natural gas prices;                                                                                 • changes in our legal regime or regulatory environment, including tax and environmental regulations.
 Accordingly, you should not place undue reliance on these forward-looking statements. In any event, these statements speak only as of their dates, and we undertake no obligation to update or revise any of them, whether as a result of new
 information, future events or otherwise. These risks and uncertainties are more fully detailed in our most recent Annual Report filed with the CNBV and available through the Mexican Stock Exchange (http://www.bmv.com.mx/) and our most recent
 Form 20-F filing filed with the SEC (http://www.sec.gov/). These factors could cause actual results to differ materially from those contained in any forward-looking statement.
 This presentation contains words such as “believe”, “expect”, “anticipate” and similar expressions that identify prospective statements, which reflect PEMEX’s points of view regarding future events and their financial performance. Actual results could
 materially differ from those projected in such prospective statements as a result of diverse factors that can be out of PEMEX’s control.                                                                                                                     2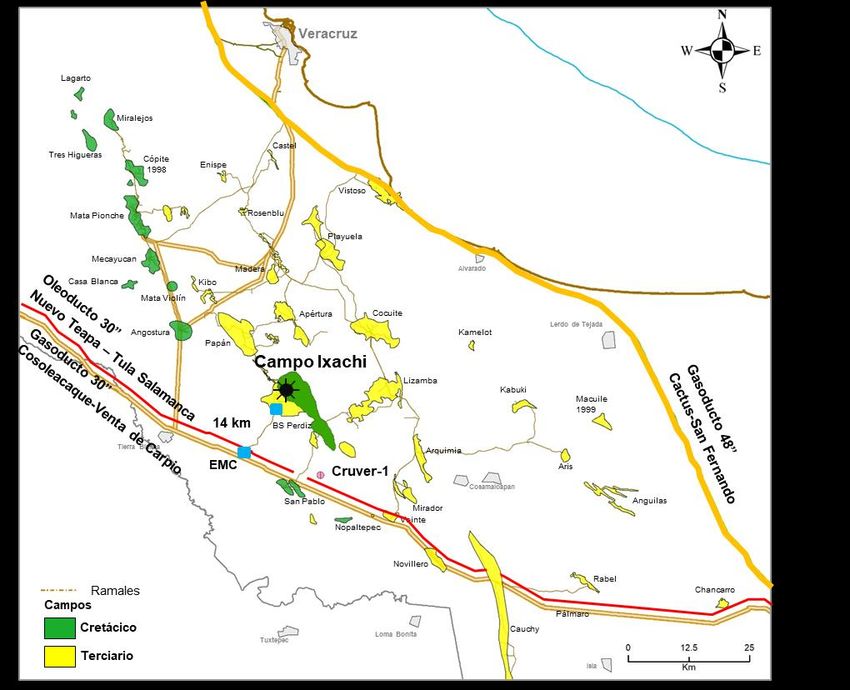
Content

    1     Overview

    2     Financial Performance

    3     2019 – 2024 Strategy

                                  3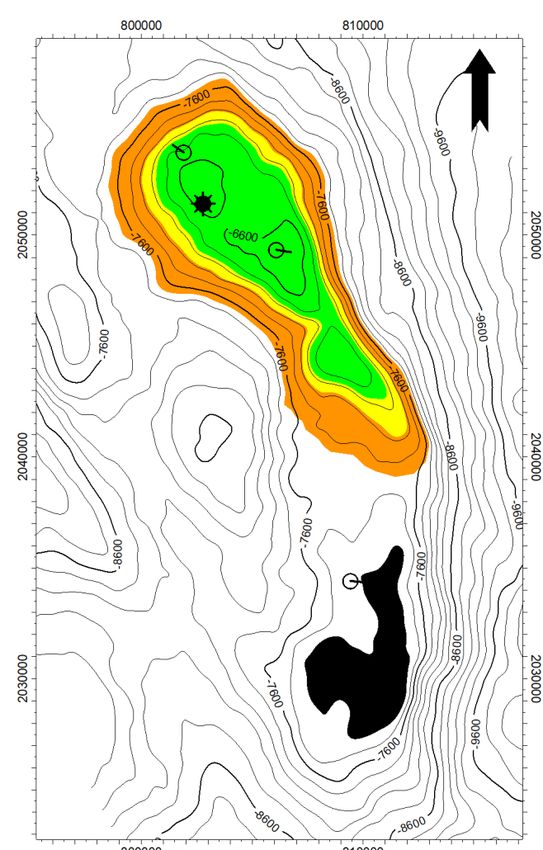
Integrated Oil & Gas Company

            Upstream                             Downstream                                Midstream                                    Sales

    10th Crude oil producer1                    16th Refining                                Strategic                       4th largest oil exporter
                                             company worldwide1                           Infrastructure                            to the USA

• Total hydrocarbon                  • 6 refineries in Mexico with a              • Strategically positioned            • MXN 1.4 trillion annual revenues3
    production: 2,584      Mboed2        refining capacity of 1,627                   logistics infrastructure:             -Exports: MXN 508 billion
•   Total crude oil production:          Mbd2                                         17,000 km of pipelines
                                                                                                                            -Domestic sales: MXN 877 billion
    1,863 Mbd2                  •        1 refinery in JV with Shell in           •   74 Storage and
                                                                                                                        •   Crude oil exports: 1,174 Mbd3
•   7,725 Operating wells2               Deer Park, Texas (340 Mbd)                   distribution terminals
                                                                                                                        •   10,439 PEMEX franchise service
•   256 Operating platforms3 •           Crude oil processing: 648                •   16 Marine terminals
                                                                                                                            stations, plus 1,192 supplied by
                                         Mbd2                                     •   10 Liquefied gas                      PEMEX2
                                     •   9 Gas Processing Complexes                   terminals
                                         (5,912 MMcfd)                            •   1,485 Tank trucks
                                     •   2 Petrochemical Complexes                •   17 Ships
                                         (1,734 Tpy)                              •   511 Tank cars
                                                                                  •   56 pumping and
                                                                                      compression stations

    1 Source: Petroleum Intelligence Weekly, Top 50 Rankings of the World’s Oil              Mboed: Thousand barrels of oil equivalent per day
      Companies, November 2018                                                               Mbd: Thousand barrels of oil per day
    2 As of September 30, 2018                                                               MMcfd: Million cubic feet per day                             4
    3 As of December 31, 2017                                                                Tpy: Tons per year
PEMEX’s Reserves
PEMEX holds the right to exploit approximately 90% of Mexico’s hydrocarbon proved
reserves                                 MMMboe (billion barrels of oil equivalent)

                                                                                                                                  Prospective
                                                                                                   Reserves1
                                                                                                                                  Resources2
                               Oil and Gas                                    Basin
                               Gas                                                         1P           2P           3P                        Non
                                                                                                                                Conv.
                                                                                         (90%)        (50%)        (10%)                      Conv.

                                                                          Southeastern     6.4         10.1         13.4         11.6
          Sabinas                       Burgos
                                                                          Tampico
                                                                                           0.9          3.3          6.0                      3.3
                                             Deep Sea                     Misantla
              Tampico-                       Exploration
              Misantla
                                                            Yucatan       Burgos           0.2          0.3          0.4                      1.5
                                         Gulf of            Platform
                                         Mexico                           Veracruz         0.2          0.3          0.5         0.6

                    Veracruz                                              Sabinas          0.0          0.0          0.0                      0.4

                                                                          Deepwater        0.1          0.2          0.8         6.0
                                                           Southeastern
                                                                          Total PEMEX      7.7         14.2         21.1         18.2         5.2

                                                                                               Development and                    Exploration
                                                                                                 Exploitation                      Projects
                                                                                                   Projects

   1 PEMEX’s Hydrocarbon Reserves as of January 1, 2018. Reserves have been validated by the CNH, Mexico’s National Hydrocarbons Commission           5
   2 Prospective resources assigned to PEMEX in Round Zero
Ixachi: Largest Onshore Discovery
in Mexico in the Last 25 Years
Reserves Classification
Proved
Probable
Ixachi-1001 EXP Possible
Gulf of Mexico
Ixachi-1
Ixachi-1DEL
Cruver-1EXP
Branches
Fields
Cretaceous
Tertiary
• Expected production in 2022:
0 5000 m • 80 Mbd of condensates
• 700 MMcfd (≈1/7 current production)
• Reserves 1P ≈ 470 Mboe
Source: PEMEX • Production cost ≈ USD 5.5 per boe
Mboe: Thousand barrels of oil equivalent 6
boe: barrels of oil equivalentIxachi is One of the Most Important
Onshore Discoveries in the World
Top 10 Onshore Discoveries in Conventional Fields in the World 2008 – 2017
MMboed
Certified 3P Reserves
3,000
Estimated 3P Reserves
2,500
2,000
1,500
2,709
1,000
1,759
1,509 1,340
500 1,185 1,174 1,025
820
578 548 545
0
Faihaa-1 Moxi-8 Hazem-1 Ixachi AT-1 Kharbesky-1 Shaikan-1 Keshen-2 LLL-479 Qugruk 3 North
Russkoye-1
Gas / Gas / Gas / Gas / Oil and
Hydrocarbon Oil Gas Gas Oil Oil Gas
Cond. Cond. Cond. Cond. gas
Country
Irak China Saudi A. Mexico Algeria Russia Irak China Argentina USA Russia
Source: Wood Mackenzie Upstream Data Tool (UDT), PEMEX 7
MMboed: Million barrels of oil equivalent per dayNational Refining System
• Atmospheric distillation capacity 1,627 Mbd
• The average utilization of installed refining capacity is 80% worldwide1
Revamped
Atmospheric
distillation Started
Refinery
capacity operations
(Mbd) Cadereyta
Cadereyta 275 1979
Madero
Madero 177 1914
Minatitlán
Minatitlán 285 1956
Salamanca 245 1950
Salina Cruz 330 1979 Salamanca
Tula 315 1977 Tula
Salina Cruz
Total 1,627 Mbd
8
1 Source: BP (2018) Statistical Review of World EnergyContent
1 Overview
2 Financial Performance
3 2019 – 2024 Strategy
9Revenue from Sales and Services
The 2017 price liberalization in the domestic market has yielded in a material increase
in total revenues, positively impacting the financial results
Total Revenues
USD billion
MXN MMM
68 71 68
1,166 52 1,397 1,273
80 0.6 Services
0.8 1,080
60 7 0.7
6 7 0.3 Other Exports 1
17 5 19 21
40 14 Crude oil Exports
20 43 44 40 Domestic Sales
32
-
2015 2016 2017 As of 3Q18
Operating Income Net Income (loss)
20.5
USD billion 15.0 USD billion
MXN MMM MXN MMM
28 424.4 0
281.3
(1.2)
18 5.3 -11
(9.3) (23.1)
8 104.7 -22 (191.1) (14.2)
(104.7)
-2 -33
-12 (9.0) -44 (41.4)
(154.4) -55 (712.6)
-22
2015 2016 2017 As of 3Q18 2015 2016 2017 As of 3Q18
1 Other exports include dry gas, petrochemicals, sulphur 10
Source: PEMEXEBITDA: Stable Cash Flow
PEMEX has generated a solid and stable cash flow, resulting in an EBITDA1 growth
EBITDA
USD Billion
MXN MMM EBITDA Margin2 (%)
25.0 32% 28% 33% 35% 80.0
Ecopetrol 41
Mexican Crude Oil Mix Price
70.0
61.8 PEMEX 33
20.0
60.0
Statoil/Equinor 33
46.7 50.0
15.0 43.1
USD/b
Petrobras 30
35.6 40.0
23.3 23.9
22.0 ENI 21
10.0 461.7 449.6
377.9 30.0
14.4 Shell 15
296.5 20.0
5.0
BP 11
10.0
0.0 0.0
2015 2016 2017 As of 3Q18
Mexican Crude Oil
EBITDA EBITDA margin
Mix Price (USD/b)
1 EBITDA: Earnings Before Interest, Tax, Depreciation and Amortization 11
2 Sources: Bloomberg 2017 and PEMEXInflation Adjusted Debt Balance
2013 – 2019
Debt growth stabilization
Debt Balance 2013 – 2019
USD billion adjusted as of Nov 2018
MXN MMM 99.2 103.5 103.5 103.6
92.7 2,094.4 2,037.2 2,013.7
84.5 2,154.4
1,740.4
71.0 1,370.7
1,053.1
2013 2014 2015 2016 2017 2018 1 2019 2
Real Debt Increase in USD
(%)
2014 2015 2016 2017 2018 2019
18.99% 9.70% 6.98% 4.33% 0.03% 0.07%
1 Net Indebtedness 2018 estimated at MXN 60 billion
2 Net indebtedness 2019 estimated at MXN 55 billion. 2019 MXN GDP deflator assumption of 3.9% based on the General Economic Policy Criteria 2019 12
and 2019 USD % GDP growth assumption of 2.6%2015 – 2018 Financial Balance:
Budgeted vs. Observed
Financial Balance
USD billion
MXN MMM
2015 2016 2017 2018 2019
(3.2) E (3.3)
(4.3) (62.2) E (65.4)
(5.4) (5.0) (5.0) (79.4)
(93.8) (93.7)
(101.7)
Next goal: Continue with the
(9.3) (9.1) deficit reduction path
(146.9) (149.2)
(11.6)
(154.9)
Budgeted Observed
E: Estimated 13
Source: PEMEX and Federal Expenditure Budget (Decreto de Presupuesto de Egresos de la Federación) for each yearDebt Ceiling & Net Indebtedness
Debt Ceiling & Net Indebtedness
USD billion
100%
MXN MMM
100% 96%
Main goal: To maintain the
declining trend to stabilize and
eventually decrease total debt
99% 99% 46%
99% 42%
100% 49%
2010 2011 2012 2013 2014 2015 2016 2017 2018 2019
Debt Ceiling 5.6 1.7 3.5 4.8 15.2 11.3 11.6 7.9 7.3 5.6
68.7 23.8 45.9 62.9 223.4 195.0 240.6 150.0 143.8 112.8
Net 5.5 1.7 3.5 4.8 15.2 11.3 11.2 3.7 3.0E 2.8E
Indebtedness 67.8 23.8 45.3 62.2 223.4 194.8 231.6 72.4 59.8 E
E: Estimated
Note: As of the entrance of the new Pemex Law in 2015, PEMEX’s debt ceiling is authorized by PEMEX’s Board of Directors and the Mexican Congress. 14
Net indebtedness does not consider concepts of recouponing or sale of future receivables.Revolving Credit Facilities
• PEMEX’s liquidity is strengthened with its committed credit lines which currently amount
to USD 6.7 billion and MXN 32.5 billion, respectively.
USD Billion
8
1.7
6
4 8.4
6.7
2
0
Revolving Revolving Total
Credit USD Credit MXN 1
1 FX rate: MXN 19.5 per USD 1.00 15
Source: PEMEXContent
1 Overview
2 Financial Performance
3 2019 – 2024 Strategy
16Strategy
• Priority: stop and reverse the decline in crude oil production.
• Improve cash flow and investment through an optimized
financial engineering (with the support of the Federal
Government). Additional investment will not result in a public debt
increase.
• Emphasize operational efficiency as PEMEX’s guiding principle.
• Maintain high standards of safety and reliability at the facilities.
• Implement an aggressive commercial strategy, while
respecting the regulatory framework and economic competition.
• Reduce operating costs.
172019 Budgetary Capital Expenditures
2019 CAPEX Allocation
Budgetary Capital
Expenditures 13.7
USD Billion 273.1
MXN MMM
78%
11.1
204.6
22%
+22.3%
Upstream Downstream
Approved Approved
2018 2019
18
Source: Federal Expenditure Budget (Decreto de Presupuesto de Egresos de la Federación) for each yearE&P Strategy
Production target: 2,450 Mbd by the end of this administration
• The company will focus on increasing activity in drilling, and repairing wells in production
fields with 2P reserves; increasing the recovery factor of mature fields; reducing the
decline of exploited fields by applying technology and best practices of integrated
reservoir management; and developing new discovered fields with a new exploration
strategy in a timely manner.
Future Contracts
Infrastructure (7 offshore production platforms and 114 km of
January 15, 2019
pipelines)
Well drilling (6 offshore production platforms and 62 km of
January 31, 2019
pipelines)
19
Source: PEMEX’s December 12, 2018 press release http://www.pemex.com/en/press_room/press_releases/Paginas/2018-095-national.aspxNational Refining Plan
• Rehabilitation of existing refineries will increase the crude oil processing level, but it will not
be enough to cover national demand.
• Additional refining capacity will strengthen energy security in Mexico.
• The new refinery will count with MXN 25 billion from the Federal Government.
• The recovery of economic losses due to fuel theft will be allocated to the construction of
the new refinery.
• Additional Federal Government support is expected.
Objective: Capture the
Petroleum Products1 National Balance market’s gap refining
Mbd margin
1,600
1,400
1,200
1,000
800
600
400
200
0
2006 2008 2010 2012 2014 2016 2018 2020 2022 2024
New Refinery Existing Refineries National Demand
1 Gasolines, diesel and jet fuel 20
Source: PEMEX2019 Financing Program
Approved Net Indebtedness Target Net Indebtedness
USD billion (MXN MMM) USD billion (MXN MMM)
Obtained 12.22 (244.4) 9.35 (187.0)
Amortized 6.58 (131.6) 6.58 (131.6)
Net Indebtedness 5.64 (112.8) 2.77 (55.4)
2018 – 2019 Net Indebtedness Available Debt Ceiling
USD billion Financing needs
MXN MMM
5.6
6 112.8
• The target for 2019 is to limit net
indebtedness to the equivalent
4 2.9 of the financial deficit.
57.4
• This represents USD 2.9 billion
in net indebtedness below the
2 approved ceiling.
3.0 2.8
60.0 55.4
0
2018E 2019E
21
E: EstimatedFinancial Debt Maturity Profile1
Financial Debt Maturity Profile
As of November 30, 2018
USD billion
MXN MMM
1.0
20
23.7
0.5 484
10
1.0
20
9.6 9.3 8.7 8.5 9.0
6.6 195 190 6.6 7.5
177 174 4.2 184 4.3 3.6 0.3
135 153 0.1 0.0
135 86 89 74 6 2 1
2019 2020 2021 2022 2023 2024 2025 2026 2027 2028 2029 2030 2031 2032 2033
→
Debt Amortization Liability Management USD Liability Management EUR
22
1 The maturity profile does not include revolving credit facilities, which as of November 30, 2018 amounted to 0.874 USD billion.Good News: Fiscal Support
2019 Strategy
2018 2015 70.00%
• According to the
Hydrocarbons Revenue Law, 2016 68.75%
Profit
the applicable rate reaches its 2017 67.50%
Sharing
minimum in 2019: 1.25%
Duty 2018 66.25%
decrease
2019+ 65.00%
August,
2017 • Increases capital expenditure tax deductions.
Decree for • Acknowledges technical and financial challenges in mature fields.
fields that • Establishes that the benefit can be applied to a maximum of 150 Mbd.
were not • Has generated benefits of USD 400 million and USD 563 million in
profitable 2017 and 2018, respectively.
after taxes
23
1 Exchange rate for estimation purposes is MXN 20 per USD 1.00First Achievements
Material Decrease in Fuel Theft
On December, 2018 the Government Plan to Combat the Theft of Hydrocarbons in
Mexico was announced.
Deviation in Thousand Barrels per Day (Dec 2018 - Jan 2019) due to Illicit Fuels Market
120 105 108 The GSF1 Initiated Surveillance
100 Activities at the Mexico City
76 76 78 76 74 72 Control Center
80 65 67
57 54
60 45 43
40 35 35 31 28 27 29
19 20 24 17
20 9 13 10 7
5 6 3
0
1-Jan
2-Jan
3-Jan
4-Jan
5-Jan
6-Dec
7-Dec
8-Dec
9-Dec
26-Dec
10-Dec
11-Dec
12-Dec
13-Dec
14-Dec
15-Dec
16-Dec
17-Dec
18-Dec
19-Dec
20-Dec
21-Dec
22-Dec
23-Dec
24-Dec
25-Dec
27-Dec
28-Dec
29-Dec
30-Dec
31-Dec
Average Daily Deviation: Average Daily Deviation:
-68.20 Mbd -18.19 Mbd
24
1 GSF: Physical Security Office (Gerencia de Seguridad Física) Source: http://www.informeseguridad.cns.gob.mx/files/HUACHICOL_05012019.pdfFirst Achievements
Support from the Federal Government
• We will have the support of the Federal Government.
• By the end of 2019 we will have at least one capitalization of USD 1.25 billion,
with resources from the Federal Government.
• These resources will be used for investment.
Source: January 3, 2019 President’s press conference https://www.gob.mx/presidencia/prensa/conferencia-de-prensa-del-presidente-andres-manuel- 25
lopez-obrador-del-3-de-enero-de-2019Forward-Looking Statement &
Cautionary Note
Variations
If no further specification is included, comparisons are made against the same realized period of the last year.
Rounding
Numbers may not total due to rounding.
Financial Information
Excluding budgetary and volumetric information, the financial information included in this report and the annexes hereto is based on unaudited consolidated financial statements prepared in accordance with International Financial Reporting
Standards as issued by the International Accounting Standards Board (“IFRS”), which PEMEX has adopted effective January 1, 2012. Information from prior periods has been retrospectively adjusted in certain accounts to make it comparable with the
unaudited consolidated financial information under IFRS. For more information regarding the transition to IFRS, see Note 23 to the consolidated financial statements included in Petróleos Mexicanos’ 2012 Form 20-F filed with the Securities and
Exchange Commission (SEC) and its Annual Report filed with the Comisión Nacional Bancaria y de Valores (CNBV). EBITDA is a non-IFRS measure. We show a reconciliation of EBITDA to net income in Table 32 of the annexes to PEMEX’s Results
Report as of March 31, 2018. Budgetary information is based on standards from Mexican governmental accounting; therefore, it does not include information from the subsidiary companies or affiliates of Petróleos Mexicanos. It is important to
mention, that our current financing agreements do not include financial covenants or events of default that would be triggered as a result of our having negative equity.
Methodology
We might change the methodology of the information disclosed in order to enhance its quality and usefulness, and/or to comply with international standards and best practices.
Foreign Exchange Conversions
Convenience translations into U.S. dollars of amounts in Mexican pesos have been made at the exchange rate at close for the corresponding period, unless otherwise noted. Due to market volatility, the difference between the average exchange rate,
the exchange rate at close and the spot exchange rate, or any other exchange rate used could be material. Such translations should not be construed as a representation that the Mexican peso amounts have been or could be converted into U.S.
dollars at the foregoing or any other rate. It is important to note that we maintain our consolidated financial statements and accounting records in pesos. As of September 30, 2018, the exchange rate of MXN 18.8120 = USD 1.00 is used.
Fiscal Regime
Beginning January 1, 2015, Petróleos Mexicanos’ fiscal regime is governed by the Ley de Ingresos sobre Hidrocarburos (Hydrocarbons Revenue Law). From January 1, 2006 and to December 31, 2014, PEP was subject to a fiscal regime governed
by the Federal Duties Law, while the tax regimes of the other Subsidiary Entities were governed by the Federal Revenue Law.
On April 18, 2016, a decree was published in the Official Gazette of the Federation that allows assignment operators to choose between two schemes to calculate the cap on permitted deductions applicable to the Profit-Sharing Duty: (i) the scheme
established within the Hydrocarbons Revenue Law, based on a percentage of the value of extracted hydrocarbons; or (ii) the scheme proposed by the SHCP, calculated upon established fixed fees, USD 6.1 for shallow water fields and USD 8.3 for
onshore fields.
The Special Tax on Production and Services (IEPS) applicable to automotive gasoline and diesel is established in the Production and Services Special Tax Law “Ley del Impuesto Especial sobre Producción y Servicios”. As an intermediary between
the Ministry of Finance and Public Credit (SHCP) and the final consumer, PEMEX retains the amount of the IEPS and transfers it to the Mexican Government. In 2016, the SHCP published a decree trough which it modified the calculation of the IEPS,
based on the past five months of international reference price quotes for gasoline and diesel.
As of January 1 2016, and until December 31, 2017, the SHCP will establish monthly fixed maximum prices of gasoline and diesel based on the following: maximum prices will be referenced to prices in the U.S. Gulf Coast, plus a margin that includes
retails, freight, transportation, quality adjustment and management costs, plus the applicable IEPS to automotive fuel, plus other concepts (IEPS tax on fossil fuel, established quotas on the IEPS Law and value added tax).
PEMEX’s “producer price” is calculated in reference to that of an efficient refinery operating in the Gulf of Mexico. Until December 31, 2017, the Mexican Government is authorized to continue issuing pricing decrees to regulate the maximum prices for
the retail sale of gasoline and diesel fuel, taking into account transportation costs between regions, inflation and the volatility of international fuel prices, among other factors. Beginning in 2018, the prices of gasoline and diesel fuel will be freely
determined by market conditions. However the Federal Commission for Economic Competition, based on the existence of effective competitive conditions, has the authority to declare that prices of gasoline and diesel fuel are to be freely determined
by market conditions before 2018.
Hydrocarbon Reserves
In accordance with the Hydrocarbons Law, published in the Official Gazette on August 11, 2014, the National Hydrocarbons Commission (CNH) will establish and will manage the National Hydrocarbons Information Center, comprised by a system to
obtain, safeguard, manage, use, analyze, keep updated and publish information and statistics related; which includes estimations, valuation studies and certifications. On August 13, 2015, the CNH published the Guidelines that rule the valuation and
certification of Mexico’s reserves and the related contingency resources.
As of January 1, 2010, the Securities and Exchange Commission (SEC) changed its rules to permit oil and gas companies, in their filings with the SEC, to disclose not only proved reserves, but also probable reserves and possible reserves.
Nevertheless, any description of probable or possible reserves included herein may not meet the recoverability thresholds established by the SEC in its definitions. Investors are urged to consider closely the disclosure in our Form 20-F and our
Annual Report to the CNBV and SEC, available at http://www.pemex.com/.
Forward-looking Statements
This report contains forward-looking statements. We may also make written or oral forward-looking statements in our periodic reports to the CNBV and the SEC, in our annual reports, in our offering circulars and prospectuses, in press releases and
other written materials and in oral statements made by our officers, directors or employees to third parties. We may include forward-looking statements that address, among other things, our:
• exploration and production activities, including drilling; • effects on us from competition, including on our ability to hire and retain skilled personnel;
• activities relating to import, export, refining, petrochemicals and transportation, storage and distribution of petroleum, • limitations on our access to sources of financing on competitive terms;
natural gas and oil products; • our ability to find, acquire or gain access to additional reserves and to develop the reserves that we obtain
• activities relating to our lines of business, including the generation of electricity; successfully;
• projected and targeted capital expenditures and other costs, commitments and revenues; • uncertainties inherent in making estimates of oil and gas reserves, including recently discovered oil and gas
• liquidity and sources of funding, including our ability to continue operating as a going concern; reserves;
• strategic alliances with other companies; and • technical difficulties;
• the monetization of certain of our assets. • significant developments in the global economy;
• Actual results could differ materially from those projected in such forward-looking statements as a result of various factors • significant economic or political developments in Mexico;
that may be beyond our control. These factors include, but are not limited to: • developments affecting the energy sector; and
• changes in international crude oil and natural gas prices; • changes in our legal regime or regulatory environment, including tax and environmental regulations.
Accordingly, you should not place undue reliance on these forward-looking statements. In any event, these statements speak only as of their dates, and we undertake no obligation to update or revise any of them, whether as a result of new
information, future events or otherwise. These risks and uncertainties are more fully detailed in our most recent Annual Report filed with the CNBV and available through the Mexican Stock Exchange (http://www.bmv.com.mx/) and our most recent
Form 20-F filing filed with the SEC (http://www.sec.gov/). These factors could cause actual results to differ materially from those contained in any forward-looking statement.
This presentation contains words such as “believe”, “expect”, “anticipate” and similar expressions that identify prospective statements, which reflect PEMEX’s points of view regarding future events and their financial performance. Actual results could
materially differ from those projected in such prospective statements as a result of diverse factors that can be out of PEMEX’s control. 26Investor Relations
(+52 55) 9126 2940
ri@pemex.com
www.pemex.com/en/investors
Campeche SoundYou can also read