Economic update - Connective

Page created by Ramon Padilla
 
CONTINUE READING
Economic update - Connective
May 2020

                                                                    Economic update

                                                                                 Adelaide Timbrell
                                                                       Adelaide.Timbrell@anz.com

Follow us on Twitter
@ANZ_Research
@Adelaide__T
This is not personal advice. It does not consider your objectives
or circumstances. Please refer to the Important Notice.
Economic update - Connective
GDP and private sector demand

                                    10

GDP growth had                      8
already slowed,
   as private                       6

    demand
                                    4
   weakened
                     % change y/y
                                    2

                                    0

                                    -2

                                    -4

                                    -6
                                         90   95      00       05             10   15   20
                                                       GDP   Private demand

                  Source: ABS, ANZ Research                                                  2
Economic update - Connective
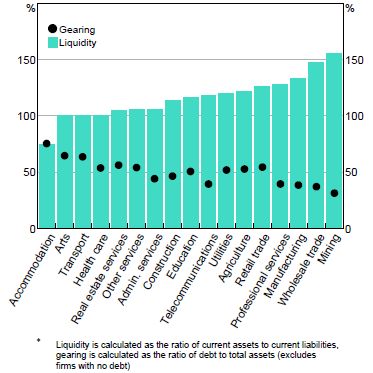
Australia has been successful in flattening the curve

                                                                                        Australia, US and World daily new cases

                  500                                                                                                                                                         120,000

                  450
                                                                                                                                                                              100,000
                  400

                  350
                                                                                                                                                                               80,000

                                                                                                                                                            Daily new cases
Daily new cases

                  300

                  250                                                                                                                                                          60,000

                  200
                                                                                                                                                                               40,000
                  150

                  100
                                                                                                                                                                               20,000
                  50

                   0                                                                                                                                                               0

                                                                                                                                                                                                                                                                                                     06-May-20

                                                                                                                                                                                                                                                                                                                 20-May-20
                                                                                                                                                                                        01-Jan-20

                                                                                                                                                                                                    15-Jan-20

                                                                                                                                                                                                                29-Jan-20

                                                                                                                                                                                                                                                                             08-Apr-20

                                                                                                                                                                                                                                                                                         22-Apr-20
                                                                                                                                                                                                                             12-Feb-20

                                                                                                                                                                                                                                         26-Feb-20

                                                                                                                                                                                                                                                     11-Mar-20

                                                                                                                                                                                                                                                                 25-Mar-20
                                                                                                                                    06-May-20
                                                                                                                                                20-May-20
                        01-Jan-20
                                    15-Jan-20
                                                29-Jan-20

                                                                                                            08-Apr-20
                                                                                                                        22-Apr-20
                                                            12-Feb-20
                                                                        26-Feb-20
                                                                                    11-Mar-20
                                                                                                25-Mar-20

                                                                        Australia                                                                                                                                           World                    US

          Source: Bloomberg, Covid19data.com.au, ANZ Research                                                                                                                                                                                                                                                                3
Australia has
  managed the                                    Foot traffic, Melbourne CBD
  health crisis
better than most

                   Source: City of Melbourne, ANZ Research                     4
ANZ-Roy Morgan Australian Consumer Confidence

                        140
                        136
                        132                                           2014 Budget                     2018 Budget
                                                                      leaks begin       2015 Budget
                        128                                                                           released
                                                                                        released
                        124
                        120
                        116
                        112
                                                                                             2017
                        108
                                                                                             Budget
                        104                                        2014
                Index

                                                                                             released
                                                                   Budget
                        100                                        released             Financial
                                                                                                   Wentworth 2019-20
                         96                                                             market
                                                                                                   by-election Bushfires
                                                                        China stock     volatility
                         92                                             market plunge
                         88
None of which            84

 we have felt            80
                         76
                                     Data prior to
                                     Sep-08 is

 good about
                                     monthly
                         72
                         68
                         64
                         60
                           07     08    09    10     11    12    13     14   15     16       17    18     19         20
                         4-week average                   Average since 1990                 Weekly index
                         Federal Budget release           RBA cash rate cut

                Source: Roy Morgan, ANZ Research                                                                           5
Businesses confidence & conditions

Many businesses
say they are in
dire straits, even
with JobKeeper

                     Source: NAB, ANZ Research                                  6
Businesses’ liquidity and gearing ratios

  Some of the
    industries
 hardest hit by
  the crisis are
 those with the
weakest balance
      sheets

                   Source: RBA and ABS                                         7
Cost to Governments of COVID-19 related measures

10% fiscal deficit
 forecast by ANZ
   for 2020-21 –
the largest in the
  post WWII era.

                     Source: Commonwealth Government, ANZ Research             8
Cumulative discretionary fiscal measures

Fiscal spending
  is critical to
    surviving
   COVID-19

                   Source: Commonwealth Treasury, ANZ Research                 9
Jobs and wages

                       Accommodation and food services
                              Arts and recreation services
                   Rental, hiring and real estate services
                                                    Mining
                     Administrative and support services
                                          Wholesale trade
                                              Retail trade
                         Financial and insurance services
                                            Manufacturing
                                            Other services
                         Agriculture, forestry and fishing
                                     Professional services
                                             Construction
                      Information media and telecomms
                         Public administration and safety
Wages and jobs        Transport, postal and warehousing
                        Health care and social assistance
have taken a hit                                   Utilities

   across all
                                    Education and training

                                                           -35      -30    -25   -20   -15    -10   -5     0
   industries                                                  Change between WE 14 Mar and WE 18 Apr, %, nsa
                                                    Employee jobs         Employee wages

                   Source: ABS, ANZ Research                                                                    10
Australian employment – monthly change

                                                             100

                       Chnage in employment, m/m, sa, 000s
                                                               0

                                                             -100

                                                             -200

                                                             -300
    Almost
   600,000                                                   -400

Australians lost
                                                             -500
employment in
     April.                                                  -600
                                                                    78   82   86   90   94   98   02   06   10   14   18   22

                   Source: ABS, ANZ Research                                                                                    11
The
                                                      Underutilisation jumped to a record high
 underutilisation
 rate jumped to                          25.0

almost 20%. This
 sort of increase
   took many                             20.0

    months in
    previous
   downturns.
                                         15.0
                     % of labour force

                                         10.0

                                          5.0

                                          0.0
                                             1980   1984   1988   1992   1996      2000        2004     2008   2012   2016   2020

                                                                                Underutilisation rate

                    Source: ABS, ANZ Research                                                                                       12
Households are vulnerable to economic downturns
                                                         Cost of essentials were outpacing                             Household liquidity buffers were
                                                                     inflation                                                     limited
                               4.00
Price index, Dec 2000 = 1.00

                               3.50

                               3.00

                               2.50

                               2.00

                               1.50

                               1.00

                               0.50

                               0.00
                                                         01 02 03 04 05 06 07 08 09 10 11 12 13 14 15 16 17 18 19 20
                                                                    CPI    Utilities   Health   Education

                          The average Australian is very indebted
                                                        140

                                                        120

                                                        100
                                Household debt, % GDP

                                                        80

                                                        60

                                                        40

                                                        20

                                                         0

       Source: RBA, ABS, Productivity Commission, ANZ Research                                                                                            13
ANZ spending data

                                                                20.0

                  Contribution to total ANZ-observed personal
                                                                15.0

    Personal                                                    10.0

                         spending growth (weekl), ppts
   spending is                                                   5.0

                             (2018-19 vs 2019-20)
recovering from                                                  0.0

 lockdown lows                                                  -5.0

                                                           -10.0

                                                           -15.0

                                                           -20.0

                                                           -25.0

                                                           -30.0

                                                           -35.0

                                                                                                                                                                                               15-Mar
                                                                                                                                                                                                        22-Mar
                                                                                                                                                                                                                 29-Mar
                                                                                                          4-Jan

                                                                                                                                                                                                                                  12-Apr
                                                                                                                                                                                                                                           19-Apr
                                                                                                                                                                                                                                                    26-Apr

                                                                                                                                                                                                                                                                     10-May
                                                                                                                                                                                                                                                                              17-May
                                                                                                                                                                                                                                                                                       24-May
                                                                                                                                                             15-Feb
                                                                                                                                                                      22-Feb
                                                                               14-Dec
                                                                                        21-Dec
                                                                                                 28-Dec

                                                                                                                                                                                                                          5-Apr
                                                                                                                                                                               1-Mar
                                                                                                                                                                                       8-Mar

                                                                                                                                                                                                                                                             3-May
                                                                                                                                             1-Feb
                                                                                                                                                     8-Feb
                                                                                                                  11-Jan
                                                                                                                           18-Jan
                                                                                                                                    25-Jan
                                                                       7-Dec

                                                 Entertainment                                      Dining/takeaway                                  Groceries                                    Health & fitness                                  Other
                                                 Services                                           Shopping                                         Travel                                       Total

                          All ANZ card data have been de-identified, de-sensitised and aggregated before being analysed. ANZ spending data were not
                          scaled up to represent total spending, and only include spending by ANZ cardholders and transactions for merchants that use
                          ANZ point-of-sale terminals. The market share of ANZ cardholders and ANZ point of sales terminals differs between
                          categories and over time. The changes in spending between December and February are still a good proxy of consumer
                          spending, as changes within these months are not likely to be very affected by market share.

                                                                                Our forecasts are updated more frequently than usual
                                                                                due to considerable uncertainty relating to COVID-19.

                                                                          This forecast may go out of date more quickly than usual.

                   Source: ABS, ANZ Research                                                                                                                                                                                                                                                    14
ANZ card data

                                                                   20

                      ANZ observed retail spend, weekly spend, %
                                                                   10

                          change y/y (2019-20 vs 2018-19)
                                                                    0

                                                                   -10

                                                                   -20

                                                                   -30

                                                                   -40

                                                                   -50

                                                                   -60

                                                                   -70

                                                                   -80
We are taking

                                                                                                                                                                                     01-Mar
                                                                                                                                                                                              08-Mar
                                                                                                                                                                                                       15-Mar
                                                                                                                                                                                                                22-Mar
                                                                                                                                                                                                                         29-Mar
                                                                                                                                                                                                                                  05-Apr
                                                                                                                                                                                                                                           12-Apr
                                                                                                                                                                                                                                                    19-Apr
                                                                                                                                                                                                                                                             26-Apr
                                                                                                                                                                                                                                                                      03-May
                                                                                                                                                                                                                                                                               10-May
                                                                                                                                                                                                                                                                                        17-May
                                                                                                                                                                                                                                                                                                 24-May
                                                                                                                                                 01-Feb
                                                                                                                                                          08-Feb
                                                                                                                                                                   15-Feb
                                                                                                                                                                            22-Feb
                                                                         07-Dec
                                                                                  14-Dec
                                                                                           21-Dec
                                                                                                    28-Dec
                                                                                                             04-Jan
                                                                                                                      11-Jan
                                                                                                                               18-Jan
                                                                                                                                        25-Jan
advantage of
   easing                                                                                                                           Dining/takeaway                                              Fashion

 restrictions    All ANZ card data have been de-identified, de-sensitised and aggregated before being analysed. ANZ spending data were not
                 scaled up to represent total spending, and only include spending by ANZ cardholders and transactions for merchants that use
                 ANZ point-of-sale terminals. The market share of ANZ cardholders and ANZ point of sales terminals differs between
                 categories and over time. The changes in spending between December and February are still a good proxy of consumer
                 spending, as changes within these months are not likely to be very affected by market share.

                                                                           Our forecasts are updated more frequently than usual
                                                                           due to considerable uncertainty relating to COVID-19.

                                                                     This forecast may go out of date more quickly than usual.

                Source: ABS, ANZ Research                                                                                                                                                                                                                                                                 15
Housing: Prices and finance are beginning to turn over, while house
price expectations have fallen sharply
                                       Price growth has slowed                                                                                                                       Housing finance is turning over
                                                                                                                                                                                                                                                    Macro prudential
                        3.0                                                                                                                                                     16                                                                  measures eased

                        2.5

                                                                                                                                     Monthly housing finance , ex refinancing
                                                                                                                                                                                14
                        2.0
                                                                                                                                                                                12
                        1.5
Prices (% change m/m)

                        1.0                                                                                                                                                     10

                                                                                                                                                    (AUDbn)
                        0.5
                                                                                                                                                                                8
                        0.0
                                                                                                                                                                                6
                        -0.5

                        -1.0                                                                                                                                                    4

                        -1.5
                                                                                                                                                                                2
                        -2.0                                                                                                                                                                                          Macro prudential
                                                                                                                                                                                                                     measures tightened
                               15             16               17             18               19              20
                                                                                                                                                                                0
                                           Melbourne dwelling prices                  Sydney dwelling prices                                                                         05    06   07   08 09 10       11 12 13 14 15 16 17 18                      19     20
                                                                                                                                                                                                     Investors      Owner-Occupiers (less refinancing)

                                    House price expectations have                                                                                                               The ANZ Housing Search Index has
                                              collapsed                                                                                                                                    dropped
                          200                                                                                   20                                           20

                          180                                                                                   15                                           15

                          160                                                                                   10                                           10

                                                                                                                                     % change y/y
                                                                                                                      % change y/y

                          140                                                                                   5                                                      5
             Index

                          120                                                                                   0                                                      0

                          100                                                                                   -5                                              -5

                           80                                                                                   -10                                  -10

                           60                                                                                   -15                                  -15
                                09    10     11    12     13        14   15   16       17    18      19   20                                                                    07        08    09   10   11   12    13     14     15     16   17    18     19     20

                                           House price expectations                Dwelling prices                                                                                    ANZ Housing Search Index- (trend) 3 months lead               Dwelling prices

Source: ABS, CoreLogic, Google trends, Macrobond, Westpac-Melbourne Institute, ANZ Research
Housing price forecasts, by capital city

                                                                   16

                    Housing prices, y/y % change (calendar year)
                                                                   12

                                                                    8

                                                                    4

                                                                    0

  House prices                                                      -4

are expected to                                                     -8
 fall across the
  capital cities                                                   -12
                                                                         Australia*     Sydney      Melbourne     Brisbane        Adelaide      Perth   Hobart
                                                                                      2017   2018     2019      2020 (forecast)      2021 (forecast)
                             * Capital city weighted average

                   Source: CoreLogic, ANZ Research                                                                                                               17
Falling population growth will constrain housing demand

                                                                       Population drivers                                                                                                            Capital city population growth
                                             500                                                                                                                                         140,000

                                             450                                                                                                                                         120,000

                                                                                                                                        Population change, year to June 2019
                                             400
                                                                                                                                                                                         100,000
                                             350
Annual rolling sum, '000s

                                                                                                                                                                                          80,000
                                             300
                                                                                                                                                                                          60,000
                                             250
                                                                                                                                                                                          40,000
                                             200

                                             150                                                                                                                                          20,000

                                             100                                                                                                                                                0

                                             50
                                                                                                                                                                                         -20,000

                                              0
                                                   90           95           00          05             10             15         20                                                     -40,000
                                                                                                                                                                                                      Sydney Melbourne Brisbane         Adelaide   Perth     Hobart       Darwin       ACT

                                                        Natural increase     Net Overseas Migration        Change in population                                                                               Natural increase               Net interstate migration
                                                                                                                                                                                                              Net overseas migration         Total change in population

                                                                                                                                                                                            The sharp decline in population growth
                                                                     Temporary residents
                                                                                                                                                                                                will constrain housing demand
                                             3.0                                                                                                                                         250                                                                                       500

                                                                                                                                              Number of commencements, 4qtr sum, '000s
                                                                                                                                                                                                                                                                                   450
             Temporary residents, millions

                                             2.5
                                                                                                                                                                                         200                                                                                       400

                                                                                                                                                                                                                                                                                             Population, annual change, '000s
                                                                                                                                                                                                                                                                                   350
                                             2.0
                                                                                                                                                                                         150                                                                                       300

                                                                                                                                                                                                                                                                                   250
                                             1.5
                                                                                                                                                                                         100                                                                                       200

                                             1.0                                                                                                                                                                                                                                   150

                                                                                                                                                                                          50                                                                                       100
                                             0.5
                                                                                                                                                                                                                                                                                   50

                                                                                                                                                                                            0                                                                                      0
                                             0.0                                                                                                                                                85       90         95           00        05        10         15          20
                                                   11      12           13        14      15          16          17        18     19                                                                Commencements (lhs)              Population      Population estimate for end-2020
                                                            Visitors    New Zealanders   Students     Workers     Other

Source: ABS, Department of Home Affairs, ANZ Research                                                                                                                                                                                                                                                                           18
Capital city advertised rents

                              1.4

                              1.2

                              1.0

                              0.8

                              0.6

               % change m/m   0.4

                              0.2

                              0.0
Rents are
                              -0.2
collapsing
                              -0.4

                              -0.6

                              -0.8
                                     05   06   07   08   09   10   11   12    13    14   15   16   17   18   19   20
                                                                   Capital city rents

             Source: CoreLogic, ANZ Research                                                                           19
New construction orders

The construction
   pipeline is
 shrinking fast

                   Source: Ai Group, ABS, Macrobond, ANZ Research            20
The ANZ-Property Council Survey points to a major
                                                     downturn in building over the coming year
                                           100                                                                                 30

Expectations for                           90
                                                                                                                               20
   future work
                                           80
 have collapsed                                                                                                                10
 in the property                           70

                   Forward work schedule
      sector                               60
                                                                                                                               0

                                                                                                                                     % change y/y (trend)
                                           50                                                                                  -10

                                           40
                                                                                                                               -20

                                           30
                                                                                                                               -30
                                           20

                                                                                                                               -40
                                           10

                                            0                                                                                  -50
                                                 12      13      14      15    16       17       18        19      20
                                                   Forward work schedule      Quarterly residential building approvals (RHS)

                   Source: ABS, ANZ-Property Council Survey, ANZ Research                                                                                   21
Housing construction forecasts

                                 20
     Housing                                                                                                     forecasts

                                 18
 construction is
down 12% from                    16

   the peak in                   14

    mid-2018       AUDbn, real
                                 12

                                 10

                                 8

                                 6

                                 4

                                 2

                                       * leading by one quarter
                                 0
                                      90            95            00       05          10       15           20
                                           New housing construction    Housing approvals*   Monthly approvals*

                   Source: ABS, ANZ Research                                                                                 22
Key takeaways

                     Government stimulus
                     is BIG and it’s helping
                                  –            Housing prices will be
   COVID-19 is        But it isn’t enough to    hit by a reduction in
different to other   make things “normal”            household
     economic                                  income/employment
    downturns
                        Borrowing costs
Less money + Less    couldn’t move down as
    movement             much this time
                                                Housing investors &
                                               developers are hit by a
                                                new supply/demand
                       Unemployment &
                                                      balance
                     underemployment will
                      be elevated beyond
                             2021
 The economy was
   already losing                                     Lingering
 momentum before                                household/business
   COVID-19 hit      High levels of debt and      struggles & slow
                       expenses made the       population growth will
                       average household         slow the recovery
                         vulnerable to a
                            downturn

                                                                         23
Important notice
[28 January 2020]
This document is intended for ANZ’s Institutional, Markets and Private Banking clients. It should not be forwarded, copied or distributed. The information in this
document is general in nature, and does not constitute personal financial product advice or take into account your objectives, financial situation or needs. This
document may be restricted by law in certain jurisdictions. Persons who receive this document must inform themselves about and observe all relevant restrictions. Disclaimer for all
jurisdictions: This document is prepared by Australia and New Zealand Banking Group Limited (ABN11 005 357 522) (ANZ), a company incorporated in Australia. It is distributed in
your country/region by ANZ or (if stated below) its subsidiary or branch (each, an Affiliate). This document is distributed on the basis that it is only for the information of the specified
recipient or permitted user of the relevant website (recipients).
This document is solely for informational purposes and nothing contained within is intended to be an invitation, solicitation or offer by ANZ to sell, or buy, receive or provide any product
or service, or to participate in a particular trading strategy.
Distribution of this document to you is only as may be permissible by the laws of your jurisdiction, and is not directed to or intended for distribution or use by recipients resident or
located in jurisdictions where its use or distribution would be contrary to those laws or regulations, or in jurisdictions where ANZ would be subject to additional licensing or registration
requirements. Further, the products and services mentioned in this document may not be available in all countries.
ANZ in no way provides any financial, legal, taxation or investment advice to you in connection with any product or service discussed in this document. Before making any investment
decision, recipients should seek independent financial, legal, tax and other relevant advice having regard to their particular circumstances.
Whilst care has been taken in the preparation of this document and the information contained within is believed to be accurate, ANZ does not represent or warrant the accuracy or
completeness of the information, except with respect to information concerning ANZ. Further, ANZ does not accept any responsibility to inform you of any matter that subsequently
comes to its notice, which may affect the accuracy of the information in this document.
Preparation of this document and the opinions expressed in it may involve material elements of subjective judgement and analysis. Unless specifically stated otherwise: they are current
on the date of this document and are subject to change without notice; and, all price information is indicative only. Any opinions expressed in this document are subject to change at
any time without notice.
ANZ does not guarantee the performance of any product mentioned in this document. All investments entail a risk and may result in both profits and losses. Past performance is not
necessarily an indicator of future performance. The products and services described in this document may not be suitable for all investors, and transacting in these products or services
may be considered risky.
ANZ expressly disclaims any responsibility and shall not be liable for any loss, damage, claim, liability, proceedings, cost or expense (Liability) arising directly or indirectly and whether
in tort (including negligence), contract, equity or otherwise out of or in connection with this document to the extent permissible under relevant law. Please note, the contents of this
document have not been reviewed by any regulatory body or authority in any jurisdiction.
ANZ and its Affiliates may have an interest in the subject matter of this document. They may receive fees from customers for dealing in the products or services described in this
document, and their staff and introducers of business may share in such fees or remuneration that may be influenced by total sales, at all times received and/or apportioned in
accordance with local regulatory requirements. Further, they or their customers may have or have had interests or long or short positions in the products or services described in this
document, and may at any time make purchases and/or sales in them as principal or agent, as well as act (or have acted) as a market maker in such products. This document is
published in accordance with ANZ’s policies on conflicts of interest and ANZ maintains appropriate information barriers to control the flow of information between businesses within it
and its Affiliates.
Your ANZ point of contact can assist with any questions about this document including for further information on these disclosures of interest.
Australia. ANZ holds an Australian Financial Services licence no. 234527. For a copy of ANZ's Financial Services Guide please click here or request from your ANZ point of contact.
Brazil, Brunei, India, Japan, Kuwait, Malaysia, Switzerland, Taiwan. This document is distributed in each of these jurisdictions by ANZ on a cross-border basis.
European Economic Area (EEA): United Kingdom. ANZ is authorised in the United Kingdom by the Prudential Regulation Authority (PRA) and is subject to regulation by the
Financial Conduct Authority (FCA) and limited regulation by the PRA. Details about the extent of our regulation by the PRA are available from us on request. This document is
distributed in the United Kingdom by Australia and New Zealand Banking Group Limited ANZ solely for the information of persons who would come within the FCA definition of “eligible
counterparty” or “professional client”. It is not intended for and must not be distributed to any person who would come within the FCA definition of “retail client”. Nothing here excludes
or restricts any duty or liability to a customer which ANZ may have under the UK Financial Services and Markets Act 2000 or under the regulatory system as defined in the Rules of the
PRA and the FCA.
Fiji. For Fiji regulatory purposes, this document and any views and recommendations are not to be deemed as investment advice. Fiji investors must seek licensed professional advice
should they wish to make any investment in relation to this document.
Hong Kong. This publication is issued or distributed in Hong Kong by the Hong Kong branch of ANZ, which is registered at the Hong Kong Monetary Authority to conduct Type 1
(dealing in securities), Type 4 (advising on securities) and Type 6 (advising on corporate finance) regulated activities. The contents of this publication have not been reviewed by any
regulatory authority in Hong Kong.
India. If this document is received in India, only you (the specified recipient) may print it provided that before doing so, you specify on it your name and place of printing.
Myanmar. This publication is intended to be general and part of ANZ’s customer service and marketing activities when implementing its functions as a licensed bank. This publication is not
Securities Investment Advice (as that term is defined in the Myanmar Securities Transaction Law 2013).
New Zealand. This document is intended to be of a general nature, does not take your financial situation or goals into account, and is not a personalised adviser service under the Financial
Advisers Act 2008 (FAA). When distributed by ANZ in New Zealand, this document is intended only for “wholesale” clients as defined in the FAA.
Important notice
Oman. ANZ neither has a registered business presence nor a representative office in Oman and does not undertake banking business or provide financial services in Oman. Consequently
ANZ is not regulated by either the Central Bank of Oman (CBO)or Oman’s Capital Market Authority (CMA). The information contained in this document is for discussion purposes only and
neither constitutes an offer of securities in Oman as contemplated by the Commercial Companies Law of Oman (Royal Decree 4/74) or the Capital Market Law of Oman (Royal Decree
80/98), nor does it constitute an offer to sell, or the solicitation of any offer to buy non-Omani securities in Oman as contemplated by Article 139 of the Executive Regulations to the Capital
Market Law (issued vide CMA Decision 1/2009). ANZ does not solicit business in Oman and the only circumstances in which ANZ sends information or material describing financial products
or financial services to recipients in Oman, is where such information or material has been requested from ANZ and the recipient understands, acknowledges and agrees that this document
has not been approved by the CBO, the CMA or any other regulatory body or authority in Oman. ANZ does not market, offer, sell or distribute any financial or investment products or
services in Oman and no subscription to any securities, products or financial services may or will be consummated within Oman. Nothing contained in this document is intended to constitute
Omani investment, legal, tax, accounting or other professional advice.
People’s Republic of China (PRC). This document may be distributed by either ANZ or Australia and New Zealand Bank (China) Company Limited (ANZ China). Recipients must comply
with all applicable laws and regulations of PRC, including any prohibitions on speculative transactions and CNY/CNH arbitrage trading. If this document is distributed by ANZ or an Affiliate
(other than ANZ China), the following statement and the text below is applicable: No action has been taken by ANZ or any affiliate which would permit a public offering of any products or
services of such an entity or distribution or re-distribution of this document in the PRC. So, the products and services of such entities are not being offered or sold within the PRC by means of
this document or any other document. This document may not be distributed, re-distributed or published in the PRC, except under circumstances that will result in compliance with any
applicable laws and regulations. If and when the material accompanying this document relates to the products and/or services of ANZ China, the following statement and the text below is
applicable: This document is distributed by ANZ China in the Mainland of the PRC.
Qatar. This document has not been, and will not be:
• lodged or registered with, or reviewed or approved by, the Qatar Central Bank (QCB), the Qatar Financial Centre (QFC) Authority, QFC Regulatory Authority or any other authority in the
  State of Qatar (Qatar); or
• authorised or licensed for distribution in Qatar,
and the information contained in this document does not, and is not intended to, constitute a public offer or other invitation in respect of securities in Qatar or the QFC. The financial products
  or services described in this document have not been, and will not be:
• registered with the QCB, QFC Authority, QFC Regulatory Authority or any other governmental authority in Qatar; or
• authorised or licensed for offering, marketing, issue or sale, directly or indirectly, in Qatar.
Accordingly, the financial products or services described in this document are not being, and will not be, offered, issued or sold in Qatar, and this document is not being, and will not be,
distributed in Qatar. The offering, marketing, issue and sale of the financial products or services described in this document and distribution of this document is being made in, and is subject
to the laws, regulations and rules of, jurisdictions outside of Qatar and the QFC. Recipients of this document must abide by this restriction and not distribute this document in breach of this
restriction. This document is being sent/issued to a limited number of institutional and/or sophisticated investors (i) upon their request and confirmation that they understand the statements
above; and (ii) on the condition that it will not be provided to any person other than the original recipient, and is not for general circulation and may not be reproduced or used for any other
purpose.
Singapore. This document is distributed in Singapore by the Singapore branch of ANZ solely for the information of “accredited investors”, “expert investors” or (as the case may be)
“institutional investors” (each term as defined in the Securities and Futures Act Cap. 289 of Singapore). ANZ is licensed in Singapore under the Banking Act Cap. 19 of Singapore and is
exempted from holding a financial adviser’s licence under Section 23(1)(a) of the Financial Advisers Act Cap. 100 of Singapore.
United Arab Emirates (UAE). This document is distributed in the UAE or the Dubai International Financial Centre (DIFC) (as applicable) by ANZ. This document does not, and is not
intended to constitute: (a) an offer of securities anywhere in the UAE; (b) the carrying on or engagement in banking, financial and/or investment consultation business in the UAE under the
rules and regulations made by the Central Bank of the UAE, the Emirates Securities and Commodities Authority or the UAE Ministry of Economy; (c) an offer of securities within the meaning
of the Dubai International Financial Centre Markets Law (DIFCML) No. 12 of 2004; and (d) a financial promotion, as defined under the DIFCML No. 1 of 200. ANZ DIFC Branch is regulated
by the Dubai Financial Services Authority (DFSA) ANZ DIFC Branch is regulated by the Dubai Financial Services Authority (DFSA). The financial products or services described in this
document are only available to persons who qualify as “Professional Clients” or “Market Counterparty” in accordance with the provisions of the DFSA rules. In addition, ANZ has a
representative office (ANZ Representative Office) in Abu Dhabi regulated by the Central Bank of the UAE. The ANZ Representative Office is not permitted by the Central Bank of the UAE
to provide any banking services to clients in the UAE.
United States. Except where this is a FX- related document, this document is distributed in the United States by ANZ Securities, Inc. (ANZ SI) which is a member of the Financial
Regulatory Authority (FINRA) (www.finra.org) and registered with the SEC. ANZSI’s address is 277 Park Avenue, 31st Floor, New York, NY 10172, USA (Tel: +1 212 801 9160 Fax: +1 212
801 9163). ANZSI accepts responsibility for its content. Information on any securities referred to in this document may be obtained from ANZSI upon request. This document or material is
intended for institutional use only – not retail. If you are an institutional customer wishing to effect transactions in any securities referred to in this document you must contact ANZSI, not its
affiliates. ANZSI is authorised as a broker-dealer only for institutional customers, not for US Persons (as “US person” is defined in Regulation S under the US Securities Act of 1933, as
amended) who are individuals. If you have registered to use this website or have otherwise received this document and are a US Person who is an individual: to avoid loss, you should cease
to use this website by unsubscribing or should notify the sender and you should not act on the contents of this document in any way. Non-U.S. analysts: Non-U.S. analysts may not be
associated persons of ANZSI and therefore may not be subject to FINRA Rule 2242 restrictions on communications with the subject company, public appearances and trading securities held
by the analysts. Where this is an
FX-related document, it is distributed in the United States by ANZ's New York Branch, which is also located at 277 Park Avenue, 31st Floor, New York, NY 10172, USA (Tel: +1 212 801 916
0 Fax: +1 212 801 9163).
Vietnam. This document is distributed in Vietnam by ANZ or ANZ Bank (Vietnam) Limited, a subsidiary of ANZ.
You can also read