The Coronation Client Charter - We strive to always put clients first We have an unwavering commitment to the long term We focus on producing top ...
←
→
Page content transcription
If your browser does not render page correctly, please read the page content below
The Coronation
Client Charter

We strive to always put clients first

We have an unwavering commitment to the long term

We focus on producing top performance over all meaningful periods

We are uncompromising about ethics

Financial planning
challenges in 2019

January 2019

A presentation prepared for the
Allan Gray Fund Provider roadshow

FINANCIAL PLANNING
CHALLENGES

 Regulatory environment
 Disappointing returns
 Growth-asset dilemma
 Retirement crunch
 Looking forward

How was your year?

5
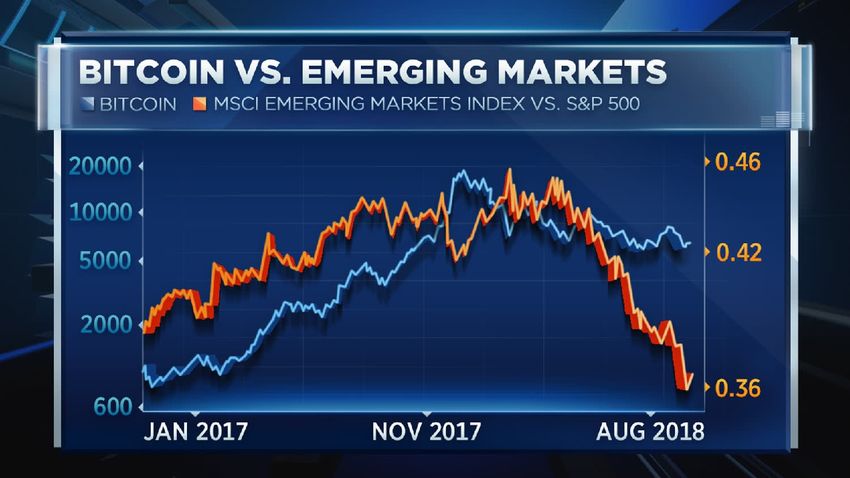
At least the bitcoin noise has gone away

6   Source: CNBC
Regulatory
environment in 2019
So, what’s changed in your business?

                                                   SELECTED REGULATORY INTERVENTIONS, 2001-2019

    2001   CGT introduced in SA
    2002   CISCA More powers to the FSB to make rules                   FAIS Fit & proper, compliance, exams , ombud
    2003   TER Total expense ratio disclosure introduced
    2004   Retirement reform DP Reduce costs, increase access           FSC Voluntary empowerment framework agreed
    2005   FAIS New rules for compliance & auditor reporting to FSB
    2006   FAIS Fit & Proper requirements tightened up
    2007   Retirement fund reform NSSF formally on the agenda
    2008   GFC Global Financial Crisis leads to step-change in regulatory intent
    2009   FAIS PI cover requirements tightened up                      FAIS Capital adequacy rules expanded
    2010   Reg 28 overhauled; requires member-level compliance          Retirement fund reform Industry consolidation process starts
    2011   Red Book Initiative New regulatory framework proposed Living annuities Disclosure campaign to make DDs more sustainable        CISCA First regulations for white-labelled funds
    2012   Retirement fund reform NSSF DP published                     Retirement fund reform Phasing out of provident funds proposed
    2013   Retirement fund reform 4x detailed Treasury DPs              BBBEE Act adopted: Generic codes now binding                      DWT Introduction of divdend withholding tax announced
    2014   Retail Distribution Review First DP published                Retirement fund reform Cap on contr. deduction introduced         TCF DP launched introducing outcomes principles
    2015   TFSA/TFI New tax-free savings vehicle introduced             Retirement fund reform Phasing out of provident funds postponed   CISCA Hedge funds declared CIS
    2016   Retirement fund reform 2012 NSSF DP issued 2nd time          Retirement fund reform Phasing out of provident funds postponed   EAC Industry-wide standardised total cost of ownership disclosure
    2017   Parliamentary hearings on transformation                     Retirement fund reform Phasing out of provident funds postponed   FAIS New Fit & Proper Rules FSC Revised BEE code adopted
    2018   FSR Sets framework for FSCA & PA                             Retirement fund reform Phasing out of provident funds postponed   FAIS New General Code of Conduct
    2019   Retirement fund defaults Effective March 2019                COFI Draft bill circulated for comment                            RDR Awaiting DP on categorisation of advisers, investment issues

8
Retirement fund defaults
Becomes effective 1 March 2019
– Member guidance
• Tell members what their options & trade-offs are before they access their retirement capital
• Likely written / web-based communication as the most typical option
– Trustee-endorsed opt-in annuity strategy
• FSCA Conduct Standard for Living Annuities
• Requirements: Suitable, reasonable cost
• Prescribed, age-related drawdown rates
• Member opts out by
• Transferring
• Choosing own drawdown or assets
• Likelihood is that most trustees will implement
conservatively
9Source of current financial planning anxiety
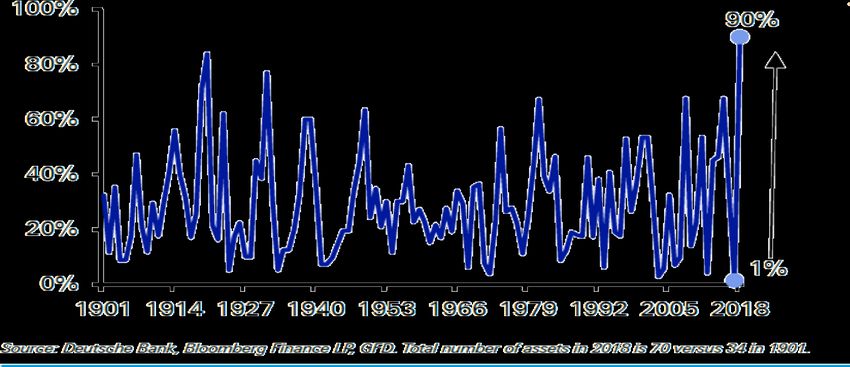
Annus horribilis
          2018 was the worst year on record – even worse than 1920

          63 of 70 assets globally ended with negative dollar returns

          Only 7 assets with positive returns                           Percentage of assets with a negative return in US dollar terms

          – T-Bills
          – China, US, Korea, Japan and Thailand bonds
          – Wheat (only commodity)

          Not a single equity market had a positive return

11   Source: Deutsche Bank (end 2018)
We are on the verge of making history
We are 6 months
away from testing
zero…
BEAR MARKET OF
THE 70s
WEAK MARKET OF
EARLY 90s PRE
DOMESTIC
DEMOCRACY
EM CRISIS RECESSION FINANCIAL CRISIS
Rolling 5 year SA equity returns
12Negative returns were broad-based
Only resources provided any reprieve
Naspers Ltd -16%
BHP Group PLC 28%
Compagnie Financiere Richemont -15%
Anglo American Plc 32%
Sasol Ltd 2%
Standard Bank of SA Ltd -4%
Firstrand Limited 2%
MTN Group Ltd -31%
Mondi 3%
Sanlam -5%
British American Tobacco Plc -40%
Absa Group Ltd -5%
Nedbank Group Ltd 13%
Remgro Ltd -15%
Shoprite Holdings Ltd -12%
BID CORP LTD -10%
Vodacom Group -3%
ANGLOGOLD ASHANTI HOLDINGS 42%
Bidvest Group Ltd -3%
Growthpoint Properties Ltd -9%
Mr Price Group Ltd 4%
Capitec Bank Holdings Ltd 4%
RMB Holdings Ltd 4%
Discovery Holdings Ltd -13%
Woolworths Holdings Ltd -12%
Investec Plc -7%
Redefine Income Fund -1%
Aspen Phamacare Holdings Ltd -50%
Clicks Group Ltd 8%
Sappi Ltd -6%
Tiger Brands Ltd -39%
Spar Group Ltd 6%
PSG Group -8%
Gold Fields Limited -7%
Netcare Ltd 9%
NEPI Rockcastle PLC -44%
The Foschini Group Ltd -12%
Truworths International Ltd -2%
Life Healthcare Group Holdings 0%
Exxaro Resources Ltd 0%
AVI Limited -2%
Fortress REIT Ltd -35%
Anglo American Platinum Ltd 55%
Reinet Investments Sca -19%
RMI Holdings -18%
Glencore Xstrata Plc -13%
Impala Platinum Holdings Ltd 13%
Barloworld Ltd -26%
Investec Ltd -7%
Pick N Pay Stores / Holdings 0%
-60% -40% -20% 0% 20% 40% 60% 80%
Top 50
13 Source: Bloomberg (end 2018)Rand cost averaging
Rand cost averaging: the positive side to lower prices
      A 20-year study

                 0,020                          Number of shares that R100 p.m. can buy on the JSE
                 0,018

                 0,016

                 0,014

                 0,012

                 0,010

                 0,008

                 0,006

                 0,004

                 0,002

                 0,000
                      1999 2000 2001 2002 2003 2004 2005 2006 2007 2008 2009 2010 2011 2012 2013 2014 2015 2016 2017 2018

15   Source: Bloomberg, Coronation Research as at 31 December 2018
Rand cost averaging: the positive side to lower prices
A 20-year study
70000 Investing monthly
Average cost paid for the market vs market price
60000
50000
40000
30000
20000
10000
0
1999 2000 2001 2002 2003 2004 2005 2006 2007 2008 2009 2010 2011 2012 2013 2014 2015 2016 2017 2018
Market Average Cost
16 Source: Bloomberg, Coronation Research as at 31 December 2018Rand cost averaging: the positive side to lower prices
A 20-year study
140000
How much was invested vs how much it’s worth
120000
100000
80000
60000
40000
20000
0
Portfolio Growth Amount invested
17 Source: Bloomberg, Coronation Research as at 31 December 2018Rand cost averaging: the positive side to lower prices
A 20-year study
500% Percentage Change on Invested Capital
450%
400%
350%
300%
̴ 4 years
250%
200%
150%
100% ̴ 4 years
50%
̴ 4 years
0%
18 Source: Bloomberg, Coronation Research as at 31 December 2018Growth asset dilemma
An inverted risk curve
       The recent past vs the LT history
      14%
      14%

      12%                                                                                                      Balanced
                                                                                                  Coronation Balanced    Plus
                                                                                                                      Plus
      12%
                                             Coronation Balanced Defensive
                                                                  Coronation Capital Plus
              CoronationStrategic
             Coronation   StrategicIncome
                                     Income Balanced Defensive
                                                           A       Coronation Capital Plus
             Strategic Income
               Coronation Strategic Income
      10%
      10%

             Strategic Income                                                    Capital Plus
       8%
                                                          Coronation Balanced Defensive
              Coronation Strategic Income
       6%    Strategic Income                                           A
                                                           Balanced Defensive
                                                                       Coronation Capital Plus
       4%                                                                                                                                                    2018

                                                       Coronation Balanced Defensive                                   Coronation Balanced Plus              2016
                                                                                   Capital Plus
       2%                                                            A                                                                                       10 Year
                                             Balanced Defensive                                                                     Balanced Plus
       0%
       0%
        0,00%                    2,00%                 4,00%                 6,00%                  8,00%                  10,00%                   12,00%
                                                                            Coronation Capital
                                                                                       Capital Plus
                                                                                               Plus
      -2%
      -2%

      -4%
      -4%
                 INDUSTRY SWITCHING DOWN THE RISK CURVE                                           Coronation Balanced PlusPlus
                                                                                                                Balanced
      -6%
      -6%

      -8%
      -8%

20   Source: Morningstar, as at 31 December 2018
Meeting financial planning assumptions
Coronation Balanced Plus to 31 December 2018
16%
45% of the time
Avg fund: 27% of the time
14%
75% of the time
Avg fund: 57%
12%
10%
8%
6%
4%
2%
0%
2014 2013 2012 2011 2010 2009
Actual return Required return to make 10 year assumption Required return to make 20 year assumption
21 Source: Morningstar, Coronation research as at 31 December 2018Coronation Balanced Plus – absolute terms
# of Subsequent Subsequent Subsequent
Start End drawdown
Months 1 year 3 years
3 years
(p.a) 5 years
5 years
(p.a)
Largest
May 1998 Aug 1998 4 -34,3% 29,1% 68,9%
19,1% 94,4%
14,2%
drawdown
2nd largest
Nov 2007 Feb 2009 16 -16,8% 34,7% 71,8%
19,8% 154,5%
20,5%
drawdown
3rd largest
June 2002 March 2003 10 -12,2% 35,7% 156,5%
36,9% 246,1%
28,2%
drawdown
4th largest
Feb 2000 May 2000 4 -8,8% 24,9% 34,8%
10,5% 132,9%
18,4%
drawdown
5th largest
Sep 2018 Dec 2018 4 -7,8%
drawdown
Average 11 -16,0% 24,9% 66,4%
21,6% 125,6%
20,3%
22 Source: Morningstar, Coronation ResearchCoronation Top 20 – relative to benchmark
# of Relative to Subsequent 1 Following 3 Following 5
Start End
Months benchmark year relative years relative years relative
Largest
Feb 2007 June 2008 17 -25,7% 30,2% 48,7% 72,9%
drawdown
2nd largest
Oct 2013 Dec 2015 27 -22,9% 14,3% 9,3%
drawdown
3rd largest
Sep 2005 Sep 2006 13 -14% 4,2% 34,1% 48,4%
drawdown
4th largest
Nov 2017 Dec 2018 14 -7,4%
drawdown
5th largest
Sep 2009 Nov 2009 3 -5,9% 5,2% 11,3% 25,2%
drawdown
Average 15 -15,2% 13,5% 25,9% 48,8%
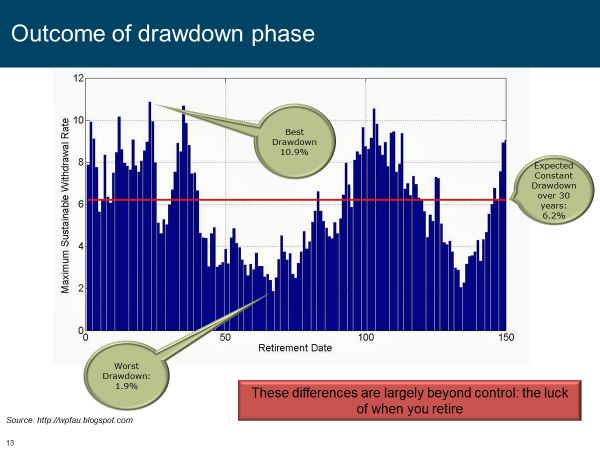
23 Source: Morningstar, Coronation ResearchRetirement crunch
25
But the birthdate lottery made things challenging

                                          6% initial drawdown increasing at 6% p.a. (5 years)

26   Source: Morningstar, Coronation Research, as at 31 December 2018
Remember the birthdate lottery? Slide from 2014
Looking forward – all is not lost
      Changing your risk profile could exacerbate the issue

28   Source: Morningstar, Coronation Research, as at 31 December 2018
Looking forward – all is not lost
Changing your risk profile could exacerbate the issue
Forecast assumptions
Capital Plus: 12% p.a.
Strat Income: 8% p.a.
29 Source: Morningstar, Coronation Research, as at 31 December 2018How achievable is 11%+ in a post-retirement portfolio?
Mid-point assumptions
Expected asset Assumed net
Asset class Weight Alpha
class return return
SA equities & property 40% 10,5% 2,5% 13%
Fixed interest 35% 8% 1% 9%
Offshore 25% 8% 2% 10%
Total 100% 11%
30How achievable is 11%+ in a post-retirement portfolio?
Upper-end assumptions
Expected asset Assumed net
Asset class Weight Alpha
class return return
SA equities & property 40% 12% 2,5% 14,5%
Fixed interest 35% 9% 1% 10%
Offshore 25% 9% 2% 11%
Total 100% 12%
31Looking forward
33
                                                       50
                                                            75
                                                                   100
                                                                              125
                                                                                    150
                                                                                          175
                                                                                                200
                                                                                                              225
                                                                                                                    250
                                            Dec 2010
                                            Feb 2011
                                            Apr 2011
                                            Jun 2011
                                            Aug 2011
                                            Oct 2011
                                            Dec 2011
                                            Feb 2012
                                            Apr 2012
                                            Jun 2012

Source: Bloomberg, as at 31 December 2018
                                            Aug 2012
                                            Oct 2012
                                            Dec 2012
                                            Feb 2013
                                            Apr 2013
                                            Jun 2013
                                            Aug 2013
                                            Oct 2013
                                            Dec 2013
                                            Feb 2014
                                            Apr 2014
                                            Jun 2014
                                            Aug 2014
                                            Oct 2014
                                            Dec 2014
                                            Feb 2015
                                            Apr 2015
                                            Jun 2015
                                            Aug 2015
                                            Oct 2015
                                            Dec 2015
                                            Feb 2016
                                            Apr 2016
                                            Jun 2016
                                            Aug 2016
                                            Oct 2016
                                            Dec 2016
                                            Feb 2017
                                            Apr 2017
                                            Jun 2017
                                            Aug 2017
                                            Oct 2017
                                            Dec 2017
                                                                                                                          Relentless sideways grind in hard currencies...

                                            Feb 2018
                                            Apr 2018
                                            Jun 2018
                                            Aug 2018
                                            Oct 2018
                                            Dec 2018
                                                                                                 ALSI (ZAR)

                                                                 ALSI (USD)
…has resulted in significant opportunities 34
History shows that this is a good time to invest

                         Coronation Balanced Plus total return over 12 months based on starting PE
        50%                                                                                                            100

        45%
                                                                                                                       80
        40%

        35%                                                                                                            60

        30%
                                                                                                                       40

        25%

                                                                                                                       20
        20%

        15%                                                                                                            0

        10%
                                                                                                                       -20
         5%

         0%                                                                                                            -40
                         7.5-10                  10-12.5             12.5-15                    15-17.5   above 17.5

                                                           Mean   Maximum      # Observations

35   Source: Bloomberg, as at 31 December 2018
History shows that this is a good time to invest
Coronation Balanced Plus total return over 60 months based on starting ALSI PE
30% 100
90
25%
80
70
20%
60
15% 50
40
10%
30
20
5%
10
0% 0
7.5-10 10-12.5 12.5-15 15-17.5 above 17.5
Mean Maximum # Observations
36 Source: Bloomberg, as at 31 December 2018Valuation is strongly on your side
P/E’s and Dividend yields are crude measures of value, but they give one a sense
Upside to PE 3 years
Name FPE FDY
fair value ago
British American Tobacco 83% 8.0 8.3% 16.1
Naspers 74% 16.5 n/a 32.0
Anheuser Busch Inbev 45% 14.4 2.9% 22
Northam 104% 10.0 n/a 12.1
Anglo American 46% 9.1 4.5% n/a
Aspen 80% 8.3 2.5% 16.1
37Conclusion
The 2019 challenge is dominated by low returns of the recent past.
Financial planning assumptions are under water.
With low returns and failed financial planning assumptions come difficult client conversations and
increased behavioral risks.
You do not require heroic returns going forward to get back on track.
It is tough, but there are silver linings to focus on.
38Thank you
DISCLAIMER

     All information and opinions provided are of a general nature and are not intended to address the circumstances of any particular individual or entity. As a result thereof, there may be limitations as to the
     appropriateness of any information given. It is therefore recommended that the client/potential investor first obtain the appropriate legal, tax, investment or other professional advice and formulate an
     appropriate investment strategy that would suit the risk profile of the client/potential investor prior to acting upon information. Neither Coronation Fund Managers Limited, Coronation Management
     Company (RF) (Pty) Ltd nor any other subsidiary of Coronation Fund Managers Limited (collectively “Coronation”) is acting, purporting to act and nor is it authorised to act in any way as an advisor.
     Coronation endeavours to provide accurate and timely information but we make no representation or warranty, express or implied, with respect to the correctness, accuracy or completeness of the
     information and opinions. Coronation does not undertake to update, modify or amend the information on a frequent basis or to advise any person if such information subsequently becomes inaccurate.
     Any representation or opinion is provided for information purposes only. Unit trusts should be considered a medium- to long-term investment. The value of units may go down as well as up, and is
     therefore not guaranteed. Past performance is not necessarily an indication of future performance. Unit trusts are allowed to engage in scrip lending and borrowing. Performance is calculated by
     Coronation for a lump sum investment with income distributions reinvested. All underlying price and distribution data is sourced from Morningstar. Performance figures are quoted after the deduction of
     all costs (including manager fees and trading costs) incurred within the fund. Note that individual investor performance may differ as a result of the actual investment date, the date of reinvestment of
     distributions and dividend withholding tax, where applicable. Where foreign securities are included in a fund it may be exposed to macroeconomic, settlement, political, tax, reporting or illiquidity risk
     factors that may be different to similar investments in the South African markets. Fluctuations or movements in exchange rates may cause the value of underlying investments to go up or down. The
     Coronation Money Market fund is not a bank deposit account. The fund has a constant price, and the total return is made up of interest received and any gain or loss made on any particular instrument, in
     most cases the return will merely have the effect of increasing or decreasing the daily yield, but in the case of abnormal losses it can have the effect of reducing the capital value of the portfolio. Excessive
     withdrawals could place the fund under liquidity pressures, in such circumstances a process of ring-fencing of redemption instructions and managed pay-outs over time may be followed. A fund of funds
     invests in collective investment schemes that levy their own fees and charges, which could result in a higher fee structure for this fund. A feeder fund invests in a single fund of a collective investment
     scheme, which levies its own charges and could result in a higher fee structure for the feeder fund. Coronation Management Company (RF) (Pty) Ltd is a Collective Investment Schemes Manager approved
     by the Financial Services Board in terms of the Collective Investment Schemes Control Act. Unit trusts are traded at ruling prices set on every trading day. Fund valuations take place at approximately
     15h00 each business day, except at month end when the valuation is performed at approximately 17h00 (JSE market close). Forward pricing is used. Additional information such as fund prices, brochures,
     application forms and a schedule of fund fees and charges is available on our website, www.coronation.com. Coronation Fund Managers Limited is a Full member of the Association for Savings &
     Investment SA (ASISA). Coronation Asset Management (Pty) Ltd (FSP 548) and Coronation Investment Management International (Pty) Ltd (FSP 45646) are authorised financial services providers.

40
FAIS REQUIREMENTS CORONATION ASSET MANAGEMENT (PTY) LTD Registration No. 1993/002807/07 Herein after referred to as ‘Coronation’ INFORMATION IN TERMS OF THE FINANCIAL ADVISORY AND INTERMEDIARY SERVICES ACT Coronation is a licensed Category II and Category IIA Financial Services Provider in terms of section 8 of the Financial Advisory and Intermediary Services Act 37, 2002 (licence number 548). Coronation is not authorised to provide advice in terms of the Financial Advisory and Intermediary Services Act 37, 2002. Coronation has been authorised to render discretionary intermediary services. Coronation is authorised to provide financial services for the following financial products: Long-Term Insurance : Category C; Pension Funds Benefits (excluding retail pension benefits); Securities and Instruments : Shares; Securities and Instruments : Money market instruments; Securities and Instruments : Debentures and securitised debt; Securities and Instruments : Warrants, certificates and other instruments; Securities and Instruments : Bonds; Securities and Instruments : Derivative instruments; Participatory interests in Collective Investment Schemes; Short Term Deposits; Long Term Deposits Coronation is a licensed Hedge Fund Financial Services Provider. The following exemptions are applicable to the licence: Exemption of investment managers and linked investment services providers and their related functionaries from fit and proper requirements (Board Notice 97 of 2003). Exemption of financial services providers as regards to representatives (Board Notice 95 of 2003). The following employees have been appointed as Key Individuals and/or Authorised Representatives: Key individuals Anton Pillay; Karl Leinberger; Kirshni Totaram; Neville Chester; John Snalam; Louis Stassen; Llewellyn Smith Authorised representatives Adrian van Pallander; Hendrik Groenewald; Alistair Lea; Karl Leinberger; Anton de Goede; Kirshni Totaram; Pranay Chagan; Quinton Ivan; Charles de Kock; Sarah-Jane Morley (married Alexander); Dirk Kotzé; Sean Morris; Duane Cable; Mark le Roux; Louis Stassen; Neill Young; Siphamandla Shozi; Gavin Joubert; Neville Chester; Stephen Peirce; Pallavi Ambekar; Suhail Suleman; Peter Leger; Tracy Burton; Nishan Maharaj; Nicholas Hops; Steve Janson; Mauro Longano; Harry Moolman; Alex Dearman; Gus Robertson; Sinovuyo Ndaleni (supervised), Greg Longe (supervised); Adrian Zetler; Kanyane Matlou (supervised); Neil Padoa (supervised); Nicholas Stein; Anthony Gibson, Seamus Vasey (supervised), Liesl Abrahams (supervised); Steven Barber (supervised); Humaira Surve (supervised); Godwill Chahwahwa; Joseph Taboola (supervised) All Key Individuals and Representatives meet the fit and proper requirements as set out in the Board Notices to the Financial Advisory and Intermediary Services Act 37, 2002. Coronation holds professional indemnity and fidelity insurance cover as stipulated in the General Code of Conduct and Board Notices to the Financial Advisory and Intermediary Services Act 37, 2002. Coronation accepts responsibility for its actions and the actions of its authorised representatives in rendering the financial services. Any information disclosed to any of Coronation’s Authorised Representatives in their professional capacity will be treated as confidential unless written consent is obtained to disclose such information, or the disclosure of such information is required in the public interest or under a particular law. The appointed Compliance Officers are: Jamie Rowland Stephan Kemp Tel: 021 680 2809 021 680 7703 Fax: 021 680 2859 021 680 7753 Cell: 082 434 4622 082 351 2401 E-mail: jrowland@coronation.com skemp@coronation.com Coronation’s Conflicts of Interest Management Policy, in terms of General Code of Conduct Regulations issued in terms of the Financial Advisory and Intermediary Services Act, No 37 of 2002, is available on Coronation’s website, www.coronation.com, or on request from the Compliance Officer. All complaints are taken seriously and Coronation’s aim is to ensure that all complaints are investigated and addressed in a timely and fair manner. To lodge a complaint, please contact either your Fund Manager or one of the compliance officer’s listed above. 41
FAIS REQUIREMENTS
CORONATION INVESTMENT MANAGEMENT INTERNATIONAL (PTY) LTD
Registration No. 2014/111656/07
Herein after referred to as ‘Coronation’
INFORMATION IN TERMS OF THE FINANCIAL ADVISORY AND INTERMEDIARY SERVICES ACT
Coronation is a licensed Category II Financial Services Provider in terms of section 8 of the Financial Advisory and Intermediary Services Act 37, 2002 (licence number 45646).
Coronation is not authorised to provide advice in terms of the Financial Advisory and Intermediary Services Act 37, 2002. Coronation has been authorised to render discretionary intermediary services.
Coronation is authorised to provide financial services for the following financial products:
Long-Term Insurance : Category C; Pension Funds Benefits (excluding retail pension benefits); Securities and Instruments : Shares; Securities and Instruments : Money market instruments; Securities and Instruments : Debentures and securitised debt; Securities and Instruments :
Warrants, certificates and other instruments; Securities and Instruments : Bonds; Securities and Instruments : Derivative instruments; Participatory interests in Collective Investment Schemes; Short Term Deposits; Long Term Deposits
The following exemptions are applicable to the licence:
Exemption on Services under Supervision in terms of Requirements and Conditions obtaining experience (Board Notice 104 of 2008).
Exemption of licensees as regards display certified copies of licenses (Board Notice 40 of 2004).
The following employees have been appointed as Key Individuals and/or Authorised Representatives:
Key individuals
Louis Stassen
Authorised representatives
Louis Stassen; Gus Robertson; Gavin Joubert; Karl Leinberger; Kirshni Totaram; Peter Leger; Stephen Peirce; Suhail Suleman; Greg Longe (supervised); Neil Padoa (supervised); Anthony Gibson, Liesl Abrahams (supervised); Steven Barber (supervised) ; Humaira Surve (supervised)
All Key Individuals and Representatives meet the fit and proper requirements as set out in the Board Notices to the Financial Advisory and Intermediary Services Act 37, 2002.
 Coronation holds professional indemnity and fidelity insurance cover as stipulated in the General Code of Conduct and Board Notices to the Financial Advisory and Intermediary Services Act 37, 2002. Coronation accepts responsibility for its actions and the actions of its authorised
representatives in rendering the financial services.
Any information disclosed to any of Coronation’s Authorised Representatives in their professional capacity will be treated as confidential unless written consent is obtained to disclose such information, or the disclosure of such information is required in the public interest or under a
particular law.
The appointed Compliance Officers are:
Jamie Rowland                 Stephan Kemp
Tel: 021 680 2809             021 680 7703
Fax: 021 680 2859             021 680 7753
Cell: 082 434 4622            082 351 2401
E-mail: jrowland@coronation.com            skemp@coronation.com
Coronation’s Conflicts of Interest Management Policy, in terms of General Code of Conduct Regulations issued in terms of the Financial Advisory and Intermediary Services Act, No 37 of 2002, is available on Coronation’s website, www.coronation.com, or on request from the
Compliance Officer.
All complaints are taken seriously and Coronation’s aim is to ensure that all complaints are investigated and addressed in a timely and fair manner.
To lodge a complaint, please contact either your Fund Manager or one of the compliance officer’s listed above.

42
You can also read