Industry 4.0 and Fire Safety: Proposal for a Low Cost Security Monitoring System
←
→
Page content transcription
If your browser does not render page correctly, please read the page content below

Industry 4.0 and Fire Safety: Proposal for a Low
          Cost Security Monitoring System

Douglas de Matos1, Hugo Henrique Barbosa Pereira2, Vanessa Cristina Lopes Santos3,
Vladimir Alexei Rodrigues Rocha4, Luiz Melk de Carvalho5, Flávio Henrique Batista de
                                      Souza6*
                       Centro Universitário de Belo Horizonte – UNIBH, Brazil
                                     flabasouza@yahoo.com.br

Abstract

The travel and accommodation sector were one of (and not the most) affected during the
pandemic by COVID-19. Hotels and inns struggle to remain operational and not to close
permanently. Even with this situation, security issues in the accommodation are still essential
and mandatory. This research demonstrates the permeability of industry 4.0 in the security
sector of hosting environments. Based on tools such as microcontrolled devices, Cloud
Computing, Mobile applications and the Internet of Things, the paper presents a prototype of a
microcontrolled fire monitoring system capable of detecting not only signs of events in an
advanced stage, but also the first moments of suppression to avoid further damage. With the
growing number of incidents and tragedies with deaths related to fires in accommodation
environments, the proposed project demonstrates a relevant alternative for this scenario. With
these resources, an attempt was made to develop a monitoring device with access via the mobile
interface. Such devices use low cost microcontrollers, with the objective of making them
accessible to people of low or modest purchasing power, so that it can be a proposal that can be
disseminated on a large scale.

Keywords: internet of things; cloud computing; mobile application; fire safety;
accommodation sector

                                                 112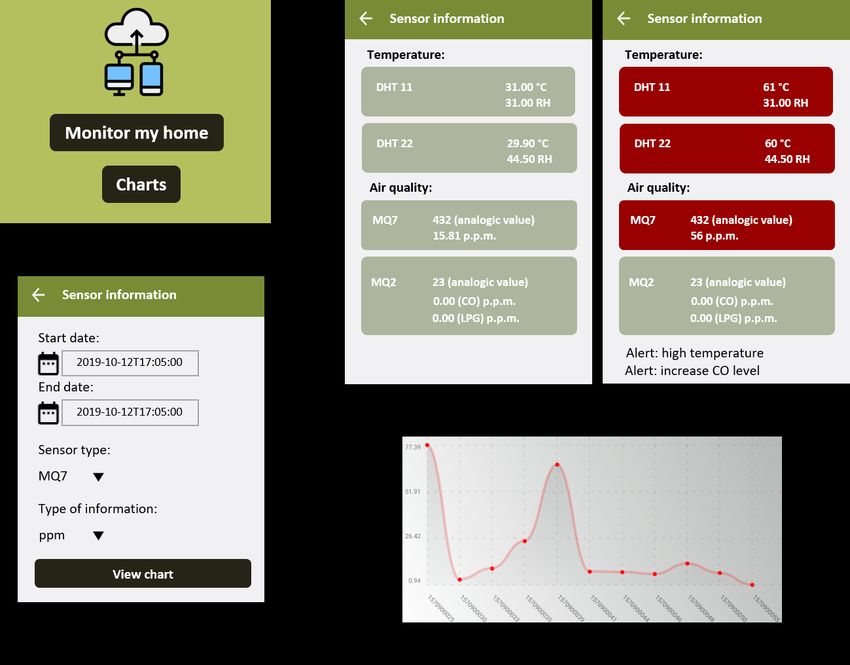
1. Introduction
   By integrating technologies such as Cloud Computing, Internet of Things and
microcontrollers with the advent of the industry 4.0, it is possible to carry out the construction
of a fire-safety monitoring system for the hosting sector. Through the access of information in
real time and accessible through the internet, it is possible to prevent fires and check for smoke
or temperature rise.
   Although there are solutions on the market focused on fire prevention, this article brings the
question: if such solutions present an effective behaviour, how is it possible that tragedies, such
as that occurred with the sportsmen of the Clube de Regatas do Flamengo in 2019, may be
present in society (Brazil, 2019)? It is based on this case and on the countless possibilities of
application with the aforementioned technologies, that this work aims to present a prototype
focused on the safety of environments, aimed at places of hosting, such as hotels, houses, and
apartments.
   Normative data on security were raised, mainly in hosting environments, to trace the
operating parameters of the monitoring system, which has sensors capable of detecting events
that offer risks to physical integrity. Such devices can enable remote access to data and the
storage of monitored information. Thus, tests were carried out to prove the effectiveness of the
system and to select the best way to implement it in practice.
   Thus, a prototype was developed and tested that integrates the technologies previously-
mentioned: Cloud Computing (for access and treatment of online data); IoT (for the integration
of several micro controlled elements via the Internet); and mobile technology, to enable both
access to information and the monitoring and administration of processes (Varghese & Buyya,
2018; Minchev & Dimitrov, 2018; Batista et al., 2020).
   The structure development, in addition to making automation compact and accessible, uses
low-cost microcontrollers from the family called ESP (ESPRESSIF), with the characteristic of
enabling a WIFI connection (Souza et al., 2019). Parallel to this, the impact of the pandemic by
COVID-19 was considerable for the tourism and travel sector. This service sector, due to the
lack of resources and drastic drop in demand, needs solutions that can be efficient and
affordable to maintain its services and the safety of its customers (Gostin & Wiley, 2020).
   With these characteristics, a solution was designed that integrates a security monitoring
centre to safeguard the physical integrity of people in a hosting environment. During the
validation experiments, to guarantee the reliability of the system, parameters that can
characterize life-threatening factors were considered, such as: sudden change in temperature
and concentration of harmful gases.

                                                 113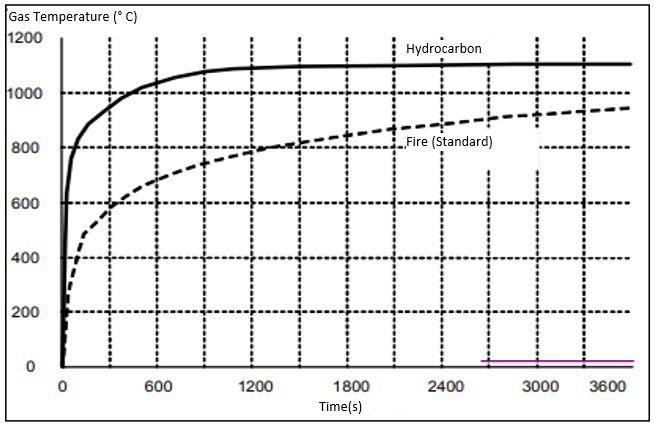
2. Methodology
   This experimental study included an analysis of the fire process and the reference parameters
and a definition of the materials and environment for testing the prototype. The consolidation
of the research was established according to: definition of the project costs, assembly of the
experiment structure, development of the electronic monitoring structure, implementation of
the cloud structure, the mobile monitoring solution and the experimentation process.

2.1     Analysis of the Fire Process and Reference Parameters
   This research focuses on human security and integrity. Thus, the acceptable / harmful levels
of carbon monoxide, described in Table 1, were surveyed.
Table 1: Exposure time and amount of CO present in the environment and its effects
                     Approximate amount of CO (ppm - part per million) in the environment
 1h         8h        % COHb Effects
0           0          0.3-0.7   Physiological pattern in non-smokers
                                 Decreased cardiac function in debilitated individuals, changes in the bloodstream
55-80       15-18      2.5-3
                                 and after prolonged exposure hemopoietic responses
                                 Decreased visual capacity, reduced vigilance and decreases in maximum work
110-170     30-45      4-6
                                 capacity
                                 Weak headache, tiredness, dyspnoeal on exertion, cutaneous vasodilation,
280-575     75-155     10-20
                                 electrophysiological changes and general psychomotor problems
 575-860    155-235    20-30     Severe headaches and nausea
 860-1155 235-310      30-40     Muscle weakness, nausea, vomiting, dark vision and severe headaches.
 1430-1710 390-470     50-60     Syncope, seizures and coma
 1710-2000 470-550     60-70     Coma, impaired heart and respiratory activity, sometimes fatal
 2000-2280 550-610     70-80     Respiratory failure and death
Source: Peres, 2005.
   The temperature of the environment was also raised as a study variable and the maximum
temperature that a place can reach to be considered a fire was not evaluated. In general, elements
in combustion, after the ignition point (where the fire starts), the temperature rise is exponential
(Figure 1), reaching 200 ºC in the first seconds after the start (Heidari et al., 2019).
   As a premise of the tests, it is considered that temperatures in hosting environments are
controlled. Thus, it was empirically defined as a maximum temperature value of 50 ºC, knowing
that, exceeding this value, the system considers a possible fire event. This value is below the
sprinkler operating temperatures.

                                                       114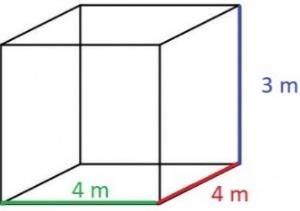
Figure 1: Fire curves (standard) and ‘H’.

Source: Kaefer & Silva, 2003.

2.2 Definition of Materials and Testing Environment
   For the measurement and experimentation process were used: Microcontrollers: ESP-32;
ESP-12; Arduino nano; Sensors: MQ-7 (Carbon Monoxide); MQ-2 (Flammable and Smoke);
DHT22 (Humidity and Temperature Sensor); DHT11 (Humidity and Temperature Sensor);
External 3.3V and 5V power supply; For burning: paper and vegetable oil. The tests were
performed on a 1:10 scale. The base taken as a reference for the area was, according to Figure
2.

                  Figure 2: Average volume of a room taken as a basis for carrying out the tests

Source: Authors, 2020.

                                                      115
3. Results
3.1 Cost Evaluation
The cost assessment was carried out and shown in Table 2. In a large-scale production the
price tends to decrease, since the whole assembly would be carried out on a printed circuit
board, which would save some types of materials and reduce the dimensions of the project.
Table 2: Estimated average cost for the prototype
Quantity Description Brazilian Reals
(R$)
1 Dht22 / Am2302 Humidity and Temperature Sensor 42.9
1 Dht11 Humidity and Temperature Sensor 9.9
1 Nano V3.0 + USB Cable for Arduino 39.9
1 MQ-2 Flammable and Smoke Gas Sensor 14.9
1 Carbon Monoxide Gas Sensor MQ-7 18.9
1 ESP8266 NodeMcu ESP-12E Wi-Fi Module 49.9
1 ESP32 Bluetooth 30-pin Wi-Fi module 64.9
1 Adjustable Power source for Protoboard 7.9
1 Wires 15
Welding 5
TOTAL 269.2*
* Values based on Eletrogate (2020), disregarding labour
Source: Eletrogate, 2020.
3.2 Experimentation Structure
For the tests, the scale 1:10 was used, that is, the test box will have a dimension of 40 cm x
40 cm x 30 cm. The types of sensors vary according to the desired measurement. For burning,
MQ7 and MQ2 were used to detect carbon monoxide and flammable gases, and for temperature
detection the sensor DHT22. A sequence of measurements was carried out, which was divided
into three parts, according to the origin of the effect to be measured: firing, temperature and
firing + temperature. Thus, according to each effect, specific sensors and measurement
positions were used, as shown in Figure 3 (a-c).
Figure 3: View of the Test Box
116(a) Position of the sensors for measuring the flare (top view of the test box)
(b) Position of sensors for temperature measurement (top view)
(c) Position of sensors for measurement of flare and temperature with sensors together
Source: Authors, 2020.
With these scale tests, data were obtained that approximate what would happen in an event
of the size of this room in real size.
3.3 Electronic Monitoring Structure
The prototype uses 3 microcontrollers, the ESP-12, ESP-32 and Arduino nano. The
information is collected by 4 sensors, which is composed of two sensors for temperature and
two for humidity (DHT11 and DHT22). DHT22 is more accurate but has a slower response.
There is also the CO sensor, named mq7, and a smoke and flammable gas sensor, named mq2.
Regarding compatibility, the existing libraries and drivers for the sensors were not compatible
with the ESP-12 microcontroller.
Another limitation was that the ESP-12 has only one analogic input port, which limits the
installation of more than one sensor per microcontroller. In relation to cost-benefit issues, the
ESP-12 has the benefit of having wireless communication. In relation to Arduino, its operating
logic is seen in Figure 4.
117Figure 4: Arduino nano working structure
Source: Authors, 2020.
To transmit the information from the sensors to the control panel, Wi-Fi is used. For this
reason there was a need to connect the Arduino via serial with the ESP12 so that it transmits
the information to the ESP32 microcontroller. As described in Figure 5, the function of ESP12
is to capture the information received and prepare it to be sent via Wi-Fi to ESP32. Initially the
objective was to promote an independent system, in such a way that it would be possible to
connect to ESP 32 and control all the information through it (Figure 6).
However, after some tests, it was not possible to build this system completely independent
of an external network because the communication protocol itself depends on the existing
network. The definition of the transmission protocol was relevant to the interoperability and
quality of transmission of the system information. HyperText Transfer Protocol (HTTP) has a
high processing capacity, since the generated packages are large and there is a need for the
system to have constant communication with the client.
As IoT devices, they only present measurement data, so the WebSocket was used. It makes
it possible to open an interactive communication session between the user's browser and a
server. With this it is possible to send messages to a server and receive event-oriented responses
without having to consult the server to obtain a response, as in an HTTP request. Via
WebSocket, the ESP32 microcontroller receives such information and treats it so that it is sent
to Cloud storage using a service called Firebase®.
118Figure 5: ESP12 operating structure
Source: Authors, 2020.
Figure 6: Sensor structure and its communication
Source: Authors, 2020.
An advantage when working with WebSocket and ESP, is the existence of libraries, which
make their integration possible, and have functions that enable the configuration of the
verification time between connection of the devices and the possibility of reconnection in case
of loss of signal. The operation of the ESP-32 is depicted in Figure 7.
Upon receiving this information, the ESP32 converts this information to be sent in an HTTP
request and stored in Firebase®.
119Figure 7: Communication protocol structure
Source: Authors, 2020.
3.4 Cloud Structure and Mobile Solution
The devices are connected to the local network of the establishment, through the wireless
router. The system is composed of a “master” who will be responsible for centralizing the
information that comes from the sensors and transmitting the information to the cloud, each one
with its ESP, called “slaves”.
WebSocket technology will be used to communicate the sensors with the master as it allows,
among other things, bidirectional and low latency communication. Each ESP and sensor set
sends information to the master. This transmits the information to the cloud through the local
gateway connected to the internet provider.
The system used to store such information in the cloud was Firebase® which provides a
database in real time and accessible. For instance, through a smartphone, which can act on the
local system, whether to turn on the hood, send an alert , or contact an external agent (family
members, public security agencies). Figures 8 and 9 demonstrate the mobile application, in the
design of its working flow and interfaces (screens).
120Figure 8: Application structure diagram
Source: Authors, 2020.
Figure 9: Application screens
121Source: Authors, 2020.
3.5 Experiments
The experiments were limited to a period of 5 minutes for security reasons and in order to
obtain the data, with a sampling index that faithfully represented a real situation.
It was found that, for an environment with the dimensions of a 4x4x3 m room, the position
of the sensors does not affect the measurement, as long as they are at the top of the site. Since
it is working with the situation of a fire in which the gas expansion is very fast, so that the
reading of the sensors is uniform within the sensitivity range of each type. However, the study
of sensor allocation in large, more widely spaced environments is essential, since each sensor
has a radius of coverage that must be observed so that there are no blind spots in the system,
thus minimizing the possibility of failure.
Three tests were performed, and the results obtained were proportional on a 1:10 scale to a
real fire and the type of fuel that was available to burn. It is worth mentioning Figures 10a-c
that correspond to the calibration period that lasts around 16 to 20 minutes, this range will not
be observed in the following tests, because after this period it stabilizes and starts to represent
the reality of the environment. In the first test performed in the environment, it was done only
with a paper ball going into partial combustion and then the flames were extinguished, but as it
can be seen in Figures 11a, 11b the carbon monoxide emission continued to rise even when the
temperature stopped rising as illustrated in Figure 12.
Figure 10: Sensor Calibration Time
Calibration time - MQ2 Calibration time - MQ7
Analog value (0-1023)
1200 100
1000 80
P.P.M. of CO
800 60
600
40
400
20
200
0
0 17:05:17 17:08:10 17:11:02 17:13:55 17:16:48 17:19:41 17:22:34 17:25:26
17:05:17 17:08:10 17:11:02 17:13:55 17:16:48 17:19:41 17:22:34 17:25:26
Period (hours: minutes: seconds) Period (hours: minutes: seconds)
a) MQ2 sensor calibration time b) MQ7 sensor calibration time
Calibration Time - DHT22
40
Temperature (ºC)
30
20
10
0
17:05:17 17:08:10 17:11:02 17:13:55 17:16:48 17:19:41 17:22:34 17:25:26
Period (hours: minutes: seconds)
c) DHT22 sensor calibration time
122Source: Authors, 2020.
Figure 11: Concentration data (First Test)
80 First Test - MQ2 50 First Test - MQ7
Analog value (0-1023)
40
60
P.P.M. of CO
30
40
20
20
10
0 0
17:23:17 17:24:00 17:24:43 17:25:26 17:26:10 17:26:53 17:23:17 17:24:00 17:24:43 17:25:26 17:26:10 17:26:53
Period (hours: minutes: seconds) Period (hours: minutes: seconds)
a) flammable gases sensor MQ2 b) carbon monoxide sensor MQ7
Source: Authors, 2020.
Figure 12: DHT22 sensor temperature data (First Test)
First Test - DHT22
32.2
32
Temperature (ºC)
31.8
31.6
31.4
31.2
31
17:23:43 17:24:00 17:24:17 17:24:35 17:24:52 17:25:09 17:25:26 17:25:44 17:26:01 17:26:18
Period (hours: minutes: seconds)
Source: Authors, 2020.
In test two, a larger burn was carried out, where the flame was kept on for a prolonged time.
Figure 13 represents how much the temperature increased within the environment, exceeding
the aforementioned limit that was chosen as the limit temperature to not be considered a fire.
Figures 14a, 14b represent the increase in carbon monoxide at the time of this test, which has a
higher rate of increase because the amount of material in combustion is greater.
In test three, a vegetable oil fuel was introduced, instead of keeping only paper. This
represented an increase in the flames and their durability. The temperature test was interrupted
to avoid damage to the test environment. However, the results collected were satisfactory, since
the peak obtained showed, in addition to the drastic increase in temperature, the perception of
new components due to the change in fuel.
123Figure 13: DHT22 sensor temperature data (Second Test)
Segundo teste - DHT22
60
50
Temperature (ºC)
40
30
20
10
0
17:39:50 17:40:08 17:40:25 17:40:42 17:41:00 17:41:17 17:41:34 17:41:51 17:42:09 17:42:26
Period (hours: minutes: seconds)
Source: Authors, 2020.
Figure 14: Concentration data (Second Test)
Segundo teste - MQ2 Segundo teste - MQ7
150 200
Analog value (0-1023)
P.P.M. of CO
150
100
100
50
50
0 0
17:39:50 17:40:34 17:41:17 17:42:00 17:42:43 17:39:50 17:40:34 17:41:17 17:42:00 17:42:43
Period (hours: minutes: seconds) Period (hours: minutes: seconds)
a) flammable gases sensor MQ2 b) carbon monoxide sensor MQ7
Source: Authors, 2020.
In Figures 15a and 15b it is shown the temperature representation in this test, and in Figures
16a, 16b, 17a, 17b, the graphs of the amount of carbon monoxide. After the exhaust fan goes
into operation, all graphs show a decrease, since the exhaust fan is removing the air mass with
the analysed components, which justifies the decrease, and proves the expected effect of
minimizing the consequences of this gas in the environment.
124Figure 15: DHT22 sensor temperature data
Third test - DHT22 - part 1 43 Third test - DHT22 - part 2
60
50 42
Temperature (ºC)
Temperature (ºC)
40
41
30
40
20
39
10
0 38
18:28:4818:29:0518:29:2318:29:4018:29:5718:30:1418:30:3218:30:4918:31:0618:31:24 18:31:24 18:31:41 18:31:58 18:32:15 18:32:33 18:32:50 18:33:07 18:33:24
Period (hours: minutes: seconds) Period (hours: minutes: seconds)
a) First DHT22 test b) Second DHT22 test
Source: Authors, 2020.
Figure 16: Concentration data for flammable gases MQ2 sensor
Third test - MQ2 - part 1 Third test - MQ2 - part 2
200 150
Analog value (0-1023)
Analog value (0-1023)
150
100
100
50
50
0
0 18:31:24 18:31:41 18:31:58 18:32:15 18:32:33 18:32:50 18:33:07 18:33:24
18:28:48 18:29:31 18:30:14 18:30:58 18:31:41
Period (hours: minutes: seconds) Period (hours: minutes: seconds)
a) First MQ2 test b) Second MQ2 test
Source: Authors, 2020.
Figure 17: MQ7 sensor carbon monoxide concentration data
Third test - MQ7 - part 1 Third test - MQ7 - part 2
500 250
400 200
P.P.M. of CO
P.P.M. of CO
300 150
200 100
100 50
0 0
18:28:48 18:29:31 18:30:14 18:30:58 18:31:41 18:31:41 18:31:58 18:32:15 18:32:33 18:32:50 18:33:07 18:33:24
Period (hours: minutes: seconds) Period (hours: minutes: seconds)
a) First MQ7 test b) Second MQ7 test
Source: Authors, 2020.
1254. Conclusion
The relevance of the research is showed by the proof that the prototype, with the association
of the evaluated technologies, could present a structure capable of meeting security demands,
in addition to providing relevant information to the security demands of a living / lodging
environment. The experiments attest to the effectiveness (given to the coherent responses of the
architecture) and efficiency of the micro controlled system, where the response of the sensors
proved to be satisfactory. The reaction time of the system is around 2 to 4 seconds after the
detection of the problem, which for human safety is an acceptable speed, since carbon
monoxide, even in conditions of high concentration, takes around one hour to cause attenuation
of senses and more severe damages.
Improvements can be implemented, which would allow greater autonomy of the
environment to be controlled, such as: service for sending messages (SMS) and pre-recorded
calls to security agencies. In addition to a possible expansion, with the implantation of an
artificial intelligence capable of managing the system, taking the necessary measures to
safeguard human life.
References
[1] Brasil (2019) Ministério Público do Estado do Rio de Janeiro. Digitalização doc. ação civil
pública Nº 0117405-30.2015.8.19.0001. Available in:
http://www.mprj.mp.br/documents/20184/540394/decisao_ct_flamengo_acp_0117405_30
_2015_8_190001.pdf. Accessed in 5 May 2019.
[2] Batista, D T, Ferreira, T A S, Mellim, R D, De Carvalho, L M, De Souza, F H B and Rocha,
V A R (2020) Mobile Applications and Discrete Event Systems: Low Cost Technology to
Assist Stock Management in an Orthopaedic Clinic. Proceedings of the 10th International
Conference On Research In Engineering, Science And Technology. ISBN: 978-609-8239-
95-9. Rome.
[3] Varghese, B. and Buyya, R. (2018) Next generation cloud computing: New trends and
research directions. Future Generation Computer Systems, v. 79, p. 849-861.
[4] Minchev, D and Dimitrov, A (2018). Home automation system based on ESP8266. In 2018
20th International Symposium on Electrical Apparatus and Technologies (SIELA) (pp. 1-
4). IEEE.
[5] Souza, F H B, Mata, G H C D, Araújo, L G D (2019) Proposta De Automatização Para
Viabilizar A Rastreabilidade em Uma Linha De Produção De Injeção Plástica para O
Reconhecimento IATF. Proceeding in XXXIX Encontro Nacional De Engenharia De
Produção, Santos.
[6] Gostin, L O and Wiley, L F (2020). Governmental public health powers during the COVID-
19 pandemic: stay-at-home orders, business closures, and travel restrictions. Jama, 323(21),
2137-2138.
126[7] Heidari, M., Robert, F., Lange, D. and Rein, G (2019). Probabilistic study of the resistance
of a simply-supported reinforced concrete slab according to eurocode parametric fire. Fire
Technology, 55(4), 1377-1404.
[8] Kaefer, E C and Silva, V P (2003) Análise paramétrica de um incêndio conforme o novo
Eurocode 1. Proceeding in XXIV Iberian latin-american congress on computational
methods in engeneering–CILAMCE. Ouro Preto.
[9] Peres, F d F (2005) Meio Ambiente e Saúde: os efeitos fisiológicos da poluição do ar no
desempenho físico - o caso do monóxido de carbono (CO). Arquivos em movimento, Rio de
Janeiro, v. I, n. 1.
[10] ELETROGATE (2020). Available in https://www.eletrogate.com. Access in 05 Apr
2020.
127You can also read