COVID-19 and the Seafood Industry May 28th Update - Atlantic Policy Congress of First Nations ...
←
→
Page content transcription
If your browser does not render page correctly, please read the page content below
May 28th, 2020
COVID-19 and the Seafood Industry
May 28th Update
Developed for: Atlantic Policy Congress of First Nation Chiefs Secretariat
Recent Developments
As of the 28th of May, there are over 5.7 million confirmed cases of COVID-19 worldwide and 350,000
deaths. The USA currently has the highest case load with over 1.1 million active cases and 100,000 deaths.
This report is part of an ongoing series of weekly updates, the last of which was provided on May 21st.
USA
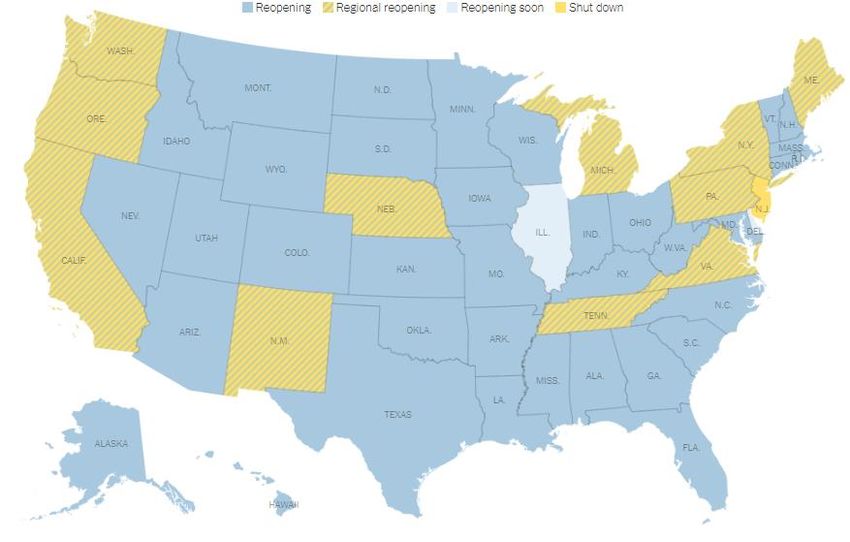
With the exception of New Jersey, all states have now implemented some form of reopening measures
even as the country continues to report over 15,000 new cases on a daily basis (Figure 1). New Jersey’s
state of emergency is set to expire June 5th. Restaurants and retail stores have been opened in many states
with reduced capacity, but in harder hit areas like New York City and Los Angeles they remain closed. US
public health officials and some politicians have warned that reopening the economy this soon could lead
to a more severe second wave of outbreaks. Reports of large crowds on reopened beaches have
contributed to this concern, as it appears as though large swathes of the population are ignoring public
health officials’ call to stay six feet away from others. As of May 28th, the US has officially exceeded
100,000 deaths from the virus.
The Trump administration has announced an indefinite extension of travel restrictions for the US land
borders. The US has enacted a travel ban on individuals from Brazil, two days earlier than was originally
planned. Both state and local governments have seen their budgets severely reduced because of the
pandemic, forcing them to layoff thousands of employees. More than two million Americans filed for
unemployment this past week, making it the 10th week in a row where new claims exceeded two million.
1May 28th, 2020
Figure 1. Map of US State closures, partial re-openings, and planned re-openings. Graphic taken from The
New York Times.
2May 28th, 2020
Canada
The federal government is in the process of acquiring more personal protective equipment as Canadians
are set to begin returning to work in short order as provinces continue to gradually reopen. Concern
remains over the possibility of a second wave of infections as over half of all COVID-19 infections are from
an unknown origin. Ontario and Quebec currently account for 95% of all new daily cases in Canada, and
densely populated regions such as Toronto and Montreal appear to be the epicenters of the disease in
Canada. All provinces and territories have announced re-opening plans, and most are either in the stages
of re-opening or will enter re-opening stages by early June.
Table 1. List of opening dates for retail and restaurants by province.
Province Retail/restaurant re-opening date
Alberta Re-opened with capacity restrictions
British Colombia Re-opened with capacity restrictions
Retail: Partially re-opened
Saskatchewan
Restaurant: TBD
Retail: Partially re-opened
Manitoba Restaurant: Patio – Partially re-opened
Indoor – June 1
Retail: Partially reopened
Ontario
Restaurants: TBD
Retail: Partially re-opened
Quebec
Restaurants: TBD
Retail: Partially reopened
New Brunswick Restaurants: Partially re-opened, social distancing
measures required
Nova Scotia Retail and Restaurants: June 5th with capacity restrictions
Retail: Partially re-opened
P.E.I.
Restaurant: June 1
Newfoundland and Retail: Partially re-opened
Labrador Restaurants: June 8
Retail: Partially re-opened
Territories
Restaurants: TBD, no dates announced
The most recent figures released reveal that Canada’s unemployment rate is 13 percent, the second-
highest rate on record. Most provinces are seeing steady declines in the number of new cases; however,
Quebec continues to struggle with containing the disease. Both Newfoundland and PEI have gone multiple
days without any new cases, and Nova Scotia and New Brunswick are seeing only low, sporadic single digit
increases in new cases.
3May 28th, 2020
China
China’s economy shrank 6.8% during the first quarter of 2020 compared to the same period in 2019. China
has also pledged to inject the equivalent of $500 billion USD into its economy, aiming to create 9 million
urban jobs. Experts believe Chinese unemployment now stands at 10%, which is 4% higher than the figure
released by the Chinese government. China plans to spend $200 billion on US imports as part of the US
China trade deal.
EU
The European Commission announced a new $826 billion (USD) coronavirus-related stimulus package on
Wednesday. Approximately $550 billion of this will be offered as free grants to the EU member states.
The remainder would be made available as loans. This is the biggest aid package in European history,
outstripping the post-World War II Marshall Plan. Germany and France have proposed raising the common
European debt in an effort to provide funds for recovery packages in the bloc. This is notable as Germany
has historically been very opposed to raising debt. There is, however, opposition from four fiscally
conservative countries including Austria, the Netherlands, Sweden and Denmark.
The Commission predicts that GDP will contract by 7.75% in the 19 countries that use the Euro in 2020.
High debt countries such as Italy may find it difficult to burden increasing levels of debt as spending grows
and tax revenue decreases. There is concern that this debt burden may cause divisions within the EU.
Spain has moved quickly through its reopening plan and is currently allowing customers to frequent dine-
in restaurants at 40% capacity. Spanish officials hope to have the country open to tourism soon, as the
tourism industry accounts for nearly 12% of Spain’s total GDP. Greece has also reopened restaurants in a
similar attempt to attract tourists. It is currently unknown how the tourism industry will fare as consumers
demonstrate nervousness about returning to public places.
4May 28th, 2020
Seafood Market Status
This section of the report will discuss the current state of the seafood market by species as of May 28th,
2020.
Lobster
After a somewhat slow start, catches for spring Canadian lobster are high. Supply has overtaken demand
and price continues to decline on live lobster. After a spike to $8.58/lb (USD) for Mother’s Day, price has
fallen each of the past three weeks to $6.38/lb (USD) as of May 27. While this is in keeping with the
historical trends, it is worth noting that the current price is a 5-year low. This indicates that factors beyond
the usual supply increase are affecting the price, in this case the coronavirus pandemic. Weekly price
change can be seen in Figure 2.
Figure 2. Weekly lobster prices since 2017 in $USD/lb. Data source: Urner Barry.
2017 2018 2019 2020 $CAD/lb 2020
14
13
Price per pound
12
11
10
9
8
7
6
Date
Shore price for lobster is variable, with SW Nova Scotia and Gulf harvesters receiving between $3.00-
4.00/lb (CAD) depending on the quality. Daily quotas have been implemented in PEI and in other
provinces by different buyers. Due to the limits set by processors/buyers, harvesters are finding it difficult
to sell all of their catch. Some LFA 34 and 33 harvesters have landed their traps several days before the
close of the season on Sunday.
Lobster destined for processing is particularly difficult to sell as processors are operating at 50% or less
capacity, attempting to supply a market that is severely depressed. Buying lobster to process raises the
5May 28th, 2020
risk of being unable to process and sell the product before it has to be thrown out, which would result in
raised costs with no additional revenue.
The exchange rate between the US and Canada has been notably volatile in 2020. It has ranged from a
high of $0.77 USD per CAD at the beginning of 2020 to $0.69 USD per CAD in the middle of March. The
most recent trend has indicated a slow strengthening of the Canadian dollar, with the current rate the
highest it has been since March 11 at $0.7257 USD per CAD as of May 28th. The table on the following
page illustrates the market price and exchange rate differences for the winter and spring of 2019 and
2020.
Table 2. Market price and exchange rate for 1 ¼ lb lobster for the winter and spring of 2019 and 2020.
Data source: Urner Barry. Note that blank entries represent periods where no market data was
available.
$USD/lb $CAD/lb $USD/lb Exchange $CAD/lb
Date 2019 Exchange 2019 2019 2020 2020 2020
6-Jan 8.15 0.752 10.84 10.05 0.770 13.05
13-Jan 8.15 0.753 10.82 10.05 0.766 13.12
20-Jan 8.15 0.750 10.85 10.25 0.766 13.38
27-Jan 8.25 0.755 10.92 9.80 0.758 12.93
3-Feb 9.00 0.761 11.81 9.13 0.753 12.12
10-Feb 9.28 0.752 12.34 8.75 0.750 11.65
17-Feb 9.80 0.755 12.97 8.75 0.754 11.60
24-Feb 9.80 0.759 12.91 8.75 0.753 11.62
2-Mar 9.90 0.750 13.18 8.73 0.748 11.66
9-Mar 10.00 0.745 13.41 8.11 0.735 11.03
16-Mar 10.00 0.748 13.35 7.98 0.705 11.31
23-Mar 9.45 0.743 12.72
30-Mar 9.10 0.743 12.24
6-Apr 8.60 0.743 11.57 7.38 0.707 10.43
13-Apr 7.96 0.745 10.68 7.38 0.717 10.28
20-Apr 7.73 0.743 10.39 6.98 0.710 9.83
27-Apr 7.73 0.746 10.36 7.00 0.717 9.77
4-May 7.73 0.753 10.26 8.55 0.710 12.04
11-May 7.53 0.745 10.10 8.48 0.714 11.88
18-May 7.35 0.757 9.70 7.10 0.701 10.01
25-May 7.24 0.762 9.50 6.38 0.715 8.92
At the beginning of the year, the exchange rate was $0.77 USD per CAD, and Canadian exporters were
receiving a premium of $3.00/lb (CAD) when selling to the US. As of the 25 th of May, Canadian exporters
are receiving a premium of $2.54/lb (CAD), despite price dropping by $3.67/lb (USD). This is due to the
weakening of the Canadian dollar against the USD to $0.715. This has helped buffer Canadian exporters
from further losses. If the exchange rate had remained at $0.77 USD per CAD, lobster exporters would
only be receiving $8.29/lb (USD) at this time.
6May 28th, 2020
The pandemic has severely affected labour availability, with plant capacity down to between 30% and
50% in PEI and New Brunswick. Notably, a processing plant in Val Comeau, NB caught fire and was an
80% loss. This will disrupt operations of up to 100 harvesters that supply the plant. These harvesters may
find it difficult to find buyers for their product as capacity among processing is tight due to severely
reduced operations and staffing. The additional supply under further reduced capacity could impact on
available locations to sell lobster on the shore.
US imports of Canadian lobster products were 9.7% lower thus far in 2020 as compared to 2019, driven
by the sharp decline in live shipments. More recently, there has been an uptick in demand for lobster
products from distributors that ship to restaurants in the US. This is likely to be anticipatory buying as
restaurants prepare for reopening, and it may take some time for these restaurants to properly gage the
level of consumer demand.
Lobster was successfully branded as a luxury item over the past two decades and has commanded high
prices as a result. Distributors were able to wield influence over the market price, and the lobster industry
was considered to be a price maker. Due to the decline in demand due to the pandemic, harvesters,
processors, and distributors have grown increasingly desperate to find sources of demand to offload
inventory and generate revenue. Buyers in countries such as China, which are in more advanced stages of
re-opening, may recognize that they can offer lower prices for lobster and wield influence over the market
price. This could mark a change in the status quo if the market situation continues to be poor for extended
periods of time. Industry participants are growing increasingly concerned that prolonged periods of low
selling prices will downgrade the perception of lobster as an expensive luxury good to a cheaper
commodity good. This could act to place a new, significantly lower ceiling on the price consumers are
willing to pay for lobster for months or years.
One method of preventing the above scenario from materializing would be to significantly reduce the
volume of catches to prevent price deflation. Due to the decentralized nature of the lobster fishery, this
strategy has proven difficult as each individual harvester has a short-term financial incentive to fish.
Industry participants have directed some of the blame for this situation at the Federal Government and
DFO, as there were initially requests to have the fishery shut down in exchange for federal aid.
7May 28th, 2020
Crab
The price for Gulf crab has remained unchanged, staying at a 3-year low price of $7.03/lb (USD) (Figure
3). To date little of the Newfoundland caught crab has become available on the market, which has kept
supply more in line with the current levels of demand. As Newfoundland crab becomes more available
over the coming weeks, downward pricing pressure is expected. Unlike lobster, snow crab is trading at
prices well below the recent historical levels, despite a relatively robust retail market.
Figure 3. Weekly Gulf of St. Lawrence snow crab (5-8oz) prices since 2017 in $USD/lb. Data source:
Urner Barry. Note that blank entries represent periods where no market data was available.
2017 2018 2019 2020
10
Price per pound (USD)
9.5
9
8.5
8
7.5
7
6.5
Date
Similar to lobster, the exchange rate is an important consideration for harvesters of Canadian snow crab
as the US market is the primary destination for product. A weak Canadian dollar allows Canadian exporters
to earn a significant premium on the product they sell to the US. Despite the weakening of the Canadian
dollar against the USD as the virus spread, harvesters have been unable to earn revenue similar to that of
2019 due to reduced demand (Table 3).
8May 28th, 2020
Table 3. Weekly market prices and exchange rate for 5-8 oz. Gulf snow crab clusters for the winter and
spring of 2019 and 2020. Data source: Urner Barry.
$USD/lb Exchange $CAD/lb $USD/lb Exchange $CAD/lb
Date
2019 2019 2019 2020 2020 2020
6-Jan 8.75 0.752 11.63 9.43 0.770 12.31
13-Jan 8.63 0.753 11.45 9.43 0.766 12.25
20-Jan 8.63 0.750 11.49 9.43 0.766 12.31
27-Jan 8.63 0.755 11.43 9.43 0.758 12.31
3-Feb 8.70 0.761 11.42 9.45 0.753 12.47
10-Feb 8.78 0.752 11.67 9.48 0.751 12.58
17-Feb 8.78 0.755 11.62 9.48 0.754 12.63
24-Feb 8.78 0.759 11.57 9.48 0.753 12.57
2-Mar 8.85 0.750 11.79 9.48 0.749 12.59
9-Mar 8.93 0.745 11.98
16-Mar 8.93 0.748 11.92
23-Mar 8.93 0.743 11.98
30-Mar 8.93 0.743 11.91
6-Apr 8.93 0.743 11.90
13-Apr 8.83 0.745 11.78
20-Apr 8.73 0.743 11.66
27-Apr 8.70 0.746 11.71
4-May 8.23 0.753 11.07 7.03 0.710 9.90
11-May 8.13 0.745 10.94 7.03 0.714 9.85
18-May 8.13 0.757 10.90 7.03 0.710 9.91
25-May 8.25 0.762 11.09 7.03 0.715 9.83
Similar to lobster, the exchange rate has offered exporters of crab some protection from the decline in
price. At the beginning of the year, prices were $9.43/lb (USD) and $12.31/lb ($CAD). This meant
Canadian exporters received a premium of $2.88/lb (CAD). Prices are currently $7.03/lb (USD) and
$9.83/lb (CAD). As of May 25th, exporters are now receiving a premium of $2.80/lb (CAD), despite price
having dropped by $2.40/lb (USD). If the exchange rate had remained constant from the start of the year,
exporters would only be receiving $9.13/lb (CAD), a decline of $0.70/lb (CAD).
Shrimp
Fishing activity for shrimp remains virtually non-existent due to ongoing price disputes between
harvesters and processors being driven by a soft market. It is worth noting that some inventory from the
previous year’s fishing effort remains. Harvesters have received increasingly grim messages from
processors regarding the state of the market, which now some say is non-existent. Some processors in
Quebec have suggested that there may be no desire to conduct shrimp trade for the remainder of the
year. As a result, a group of harvesters that includes both First Nation/Indigenous fishing groups and non-
indigenous fishers has come together to request immediate financial aid for the federal government. The
proposal includes the following:
9May 28th, 2020
• Eliminate the cost of fishing licenses for the 2020 season;
• Modify all the support programs that have been announced to make them accessible to First
Nations;
• Extend the applicability of the wage subsidy program by 75% to cover the entire shrimp fishing
season;
• Modify the accessibility criteria of the employment insurance program to ensure that workers in
the catching sector are not left without income because of the delay in the start of the season or
because of a fishing season shorter;
• Compensate First Nations communities for the loss of income from fishing activities caused by
the Covid-19 crisis;
• Increase the maximum amount of the business support program from $40,000 to $120,000, and
increase the non-repayable portion of the loan.
Bivalves
Scallop prices remain low, however as restrictions across the US have slowly begun to be lifted there has
been a slight uptick in sales. This has kept the price from declining further. As of May 28th, 20-30 ct.
scallops are selling for $9.50/lb (USD) on the market, which is the lowest price since 2010. Prices are
typically closer to between $10.50-10.75/lb (USD) in May, based on data for the past three years. U-10
prices are the second lowest in the past five years at $13.25/lb (USD). 10-20 ct. scallops, which are popular
in retail, have fared batter and prices are in line with recent historical norms (Figure 4).
Figure 4. Weekly market price ($USD/lb) for 10-20 ct. scallops since 2017. Data source: Urner Barry.
2017 2018 2019 2020
14.5
Price per pound (USD)
13.5
12.5
11.5
10.5
9.5
8.5
7.5
6.5
Date
10May 28th, 2020
In the Maritimes, smaller scallop harvesters are operating out of Digby while the offshore fleets remain
moored in Yarmouth. Fresh scallop peddlers in the Digby area have been selling scallop for $17.00/lb
(CAD), or $12.35/lb (USD).
In Massachusetts, auction prices have seen recent upticks on high volumes. The majority of scallop sold
on May 28 in New Bedford were 10-20 ct. and U-10 ct. scallops, and price was above $9.00/lb (USD) for
all sizes, with some offers of greater than $10.00/lb (USD) being noted. In the Middle of April, these same
sizes of scallop were selling for between $7.65-8.95/lb (USD). This increase is likely due to a recent
increase in the size of caught scallops, many of which are the retail-sized 10-20 ct. scallop. There have also
been very modest improvements in foodservice activities, and this is expected to continue very gradually.
Canadian production of scallop has declined by 14% in Q1 of 2020 compared to Q1 of 2019. Demand for
Canadian scallop dropped dramatically, as Canadian scallop is typically larger (U-10 ct.) and destined for
fine dining restaurants. While foodservice demand for scallop initially dropped to virtually zero, demand
has crept back up to approximately 20% of normal levels as re-opening continues in the USA and Canada.
Retail demand for scallop increased during the early part of the pandemic and rose by 25-30% in some
markets.
Oyster producers have seen 90-95% of the demand for their product evaporate as a result of the crisis.
North American producers are wary of pivoting to processed oyster, as this would put them into
competition with the well-establish Asian oyster industry. The Asian supplies are able to offer processed
oyster product at very low prices, and it is unlikely that the live oyster producers in North American are
capable of quickly and effectively switching to processed product.
Finfish
Prices for some finfish have shown signs of recovery, though this is in part due to reduced fishing effort
and landings. Halibut prices remain low but have shown a volatile trend depending on supply availability.
Tuna and swordfish prices have recovered to historical norms as well, though the trading volume is
currently unknown. Frozen fish such as haddock, cod, and pollock have remained relatively resilient
throughout the pandemic as these tend to be sold more to retail outlets compared to other species such
as lobster and crab.
11May 28th, 2020
Closing Comments
The global economy is slowly beginning to re-open as countries with large economies are gradually
bringing the pandemic under control. There is concern that a second wave of outbreaks will occur,
particularly as the disease is beginning to spread unchecked in other regions of the world. This may create
disease reservoirs that make preventing subsequent surges challenging without a vaccine.
Demand for seafood products is slowly beginning to rise as restaurants take the tentative first steps in re-
opening. Capacity restrictions are one of the most widespread regulations for re-opening restaurants
across the globe, and it will likely be months before demand rises to anything near pre-pandemic levels.
As many as 25% of all restaurants in the US and Canada may have gone out of businesses due to
quarantine measures, and the loss of demand from these sources may not be recovered for years. Despite
the reopening measures, many restaurants may choose to remain closed as they operate on thin margins
and could not profitably operate with the current capacity restrictions in place in most states and
provinces.
Some industries may see a permanent reduction in consumer interest, such as the cruise ship industry.
This is notable as cruise ships account for a significant portion of the demand for both lobster and snow
crab from Atlantic Canada. Seafood producers may find that diversifying into retail markets may provide
a safer outlet for supply in the future, as retail seafood sales have increased during the pandemic. This
would be a trade-off of security vs. maximum potential revenue, however, as retail consumers are much
more sensitive to price increases.
The early stages of re-opening are likely to only see modest increases in seafood demand from restaurant
patrons as consumers remain skittish of public spaces. Countries such as China have given indication it
may take as long as two months for demand to recover to 50% of historical norms. Assuming a similar
trajectory in the US and Canada, demand will be reach 50% of normal levels by late summer. It is important
to note, however, that prolonged periods of significant unemployment or second surges of the virus could
significantly hamper the recovery period.
12You can also read