Financing india's 100 GW - solar target - Germi
←
→
Page content transcription
If your browser does not render page correctly, please read the page content below
Financing india’s
     100 GW
  solar target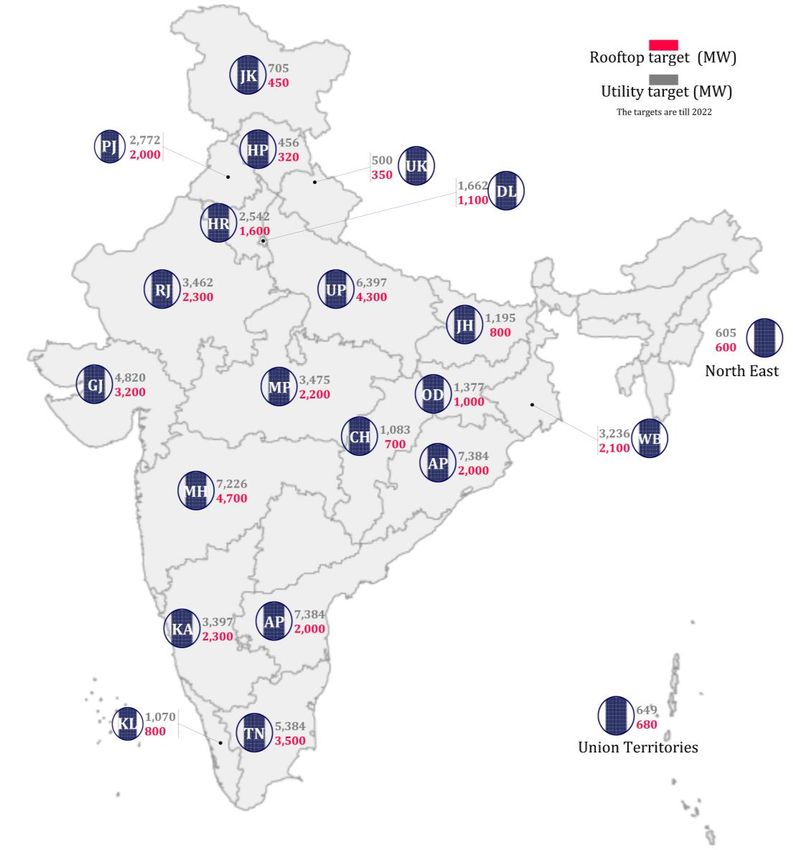
Table of Contents
Executive Summary ............................................................ 3
Tough Targets ...................................................................... 6
Ample Equity ..................................................................... 11
Deficient Debt .................................................................... 13
Penurious PPAs ................................................................ 17
Key Takeaways ................................................................. 21
About GERMI ...................................................................... 22
Author .................................................................................. 22

                                                           A GERMI White Paper | 2
Executive Summary
                                    India has revised its solar targets under the National
                                    Solar Mission (NSM) from 20 GW by 2022 to 100 GW
                                    over the same period. This report looks at the financing
                                    implications of that target.

                                    The total capital required to fund the 100 GW target is
                                    estimated to be around INR 550,000 cr. (USD 85 bn.) 1.
                                    Out of which the equity component is estimated to be
                                    INR 165,000 cr. (USD 25 bn.) and the total debt
                                    requirement is INR 385,000 cr. (USD 60 bn.).

                                    There are three aspects to financing this target – equity,
                                    debt and Power Purchase Agreements (PPAs). The
                                    inability of India’s power utilities to purchase ‘expensive’
                                    solar power is the weakest link in the financing chain.

                                    There isn’t a dearth for equity. Several prominent
                                    developers have committed to capacities far exceeding
                                    the government’s goals at the Government’s flagship
                                    Renewable Energy Investment Summit (REInvest) that
                                    took place in February 2015. The cumulative interest for
                                    developing solar energy projects in India exceeds 171
                                    GW.

                                    Raising debt remains a moderate challenge. Publically
                                    and privately owned Indian banks committed to finance
                                    around 70 GW of renewable energy projects at REInvest.
                                    Meanwhile, the participation of foreign banks in the
                                    Indian solar sector has been limited and 85% of all loans
                                    raised so far have come from Indian banks.

                                    Most importantly, a majority of Indian banks have
                                    already reached limits to lend to power projects as
                                    prescribed by the Reserve Bank of India (RBI). Most of
                                    these projects are thermal projects that are in the red
                                    due to unavailability of domestic coal and steep hike in
                                    cost of imported coal.

                                    There is a significant build-up on Non Performing Assets
                                    (NPA) on the bank’s books from other conventional
                                    power projects. Power projects form nearly 16% of all
                                    stressed assets in the banking sector. This severely

1   An exchange rate of 1 USD = 65 INR has been assumed throughout this report

                                                                                 A GERMI White Paper | 3
restricts the banks’ ability to issue fresh loans to solar
power projects. A couple of initiatives by the Reserve
Bank of India such as classifying renewable energy as a
priority lending sector and introducing interest rate
subvention can alleviate some of these problems – but
cannot fundamentally change the root cause.

Meanwhile, YES Bank has announced green bonds in an
attempt to raise public money to fund renewable energy
projects. These bonds have been received extremely well
and been over subscribed by 7.2 times. Despite this, there
are genuine concerns on the availability of debt,
especially non-recourse debt.

The major challenge though, is presented by the poor
financial health of the country’s publically owned
distribution companies (DISCOMs). The ability of the
DISCOMs to fund the purchase of ‘expensive’ solar power
remains the single biggest challenge for the success of
India’s solar program. This report estimates that a total
subsidy of INR 10,000 cr. (USD 1.5 bn.) is required to
bridge the viability gap in order to fund the purchase of
the ‘expensive’ solar power.

The poor financial health of these companies can be
attributed to the copious amount of subsidies disbursed
to the agricultural sector, lack of stringent metering of
energy and monopoly due to state patronage. The ideal
solution is to end the monopoly of the state DISCOMs,
which would result in rational power tariffs and improve
the financial health of these companies. However, this is
also the most unlikely solution due to the political nature
of farmer power subsidies. The easier interim solution
would be for an intermediary agency like the Solar
Energy Corporation of India (SECI) or a Central Public
Sector Unit (CPSU) like the NTPC Vidyut Vikas Nigam
(NVVN) to act as a power trader and repackage power to
pass it on to DISCOMs. This would protect the interests of
the investors and make the PPAs far more bankable. A
long-term solution could be to use using direct cash
transfers to disburse power subsidies. This will prevent
state DISCOMs from taking these financial losses on their
accounting books.

So far the only budget allocation that can help finance the
purchase of expensive solar power is the National Clean
Energy Fund (NCEF), which has a corpus of 16,388 crore

                                    A GERMI White Paper | 4
(USD 2.73 bn)2. The NCEF is funded by a cess on coal
mined in India. Although the government has doubled
the coal cess from INR 100 per tonne to 200 per tonne in
the FY 2015-16 budget, this may not be adequate since
the NCEF is not solar specific; it would have to fund other
clean energy and environment programs in the country.
Considering the rising Average Pooled Purchase Cost
(APPC) for DISCOMs and the rapidly falling solar prices in
the Indian market, utility scale solar could reach grid
parity as early as 2018-19. This could be the saving grace
and reduce the need for subsidies and cushion the impact
on DISCOMs.
I trust that this report helps initiate a data driven
dialogue between policy makers, bankers, developers
and interested stakeholders as India calibrates its path
towards the 100 GW solar goal.
Akhilesh Magal
2 Ministry of New and Renewable Energy. ‘National Clean Energy Fund’. 06th August 2015. http://bit.ly/1fJELy0
A GERMI White Paper | 5Tough Targets
India’s 100 GW solar target is unprecedented. In the next
seven years, India will have to annually add roughly 15
GW to achieve the target. In contrast, India has
historically added less than 1 GW a year (figure 1).
1,200 1,112
Annual Installed Capacity (MW) 1,000 946
896
800 754
600
400
200
0
2011-12 2012-13 2013-14 2014-15
Figure 1: Year on year capacity addition of solar PV in India3
This is a 15-fold increase. No other country has ever
attempted such a massive scale up of solar capacity.
China, in comparison, has set itself a target of adding 15
GW every year4.
The target is split in two ways,
a) 40 GW of rooftop solar projects
b) 60 GW of ground mounted utility scale projects
3Data from MNRE
4Global Data. ‘China Will Lead Global Solar Installations by Adding 17.6 Gigawatts in 2015’. 09 June 2015.
http://bit.ly/1NHovfS
A GERMI White Paper | 612,000
Projected year on year capacity
10,000 10,000 10,000 9,500
10,000 9,000
8,500
8,000 7,200 8,000
addition (MW)
7,000
6,000 6,000
4,800 5,000
4,000
1,800
2,000
200
0
2015-16 2016-17 2017-18 2018-19 2019-20 2020-21 2021-22
Rooftop Projects Utility Scale Projects
Figure 2: Projected year on year capacity addition – utility scale and rooftop scale5
Although utility scale projects make up a large part of
this target, it is planned that rooftop projects shall exceed
utility projects by 2022 (figure 2). This makes sense, as
the impact of centralized solar projects on the grid would
be harder to manage once the penetration of solar PV on
the grid increases6.
What is less clear is the split up of these targets across
different schemes announced by the government. The
Government has already apportioned the 100 GW target
to different states (see MAP below)
5Data from MNRE.
6Akhilesh Magal, Tobias Engelmeier, George Mathew, Ashwin Gambhir, Shantanu Dixit, Anil Kulkarni, B.G.Fernandes,
Ranjit Deshmukh. ‘Grid Integration of Distributed Solar Photovoltaics (PV) in India’. July 2014. http://bit.ly/1L2bagp
A GERMI White Paper | 7Rooftop Solar Projects
The MNRE has allocated the target of 40 GW according to
the state’s Renewable Purchase Obligation (RPO).
Targets bring clarity to the investor community,
provided they are realizable. For instance, Uttar Pradesh
has been assigned a target of 4,300 MW. Given UP’s
power deficit, high theft and lower per capita income, it is
highly unlikely that these targets would be met. Targets
should rather be a reflection on the drivers for rooftop
solar. The primary reason why consumers would want to
shift to solar is to save on their electricity bills.
Consequently, the states with the highest tariffs must be
the best markets. Rooftop solar should make sense is
A GERMI White Paper | 8states such as Maharashtra, Delhi, Tamil Nadu and
Karnataka7.
Utility Scale Projects
The 60 GW target under utility scale projects are split as
follows.
Utility Scale Projects (all figures in MW)
Ongoing Farmer and
programs and State unemployed Private
SECI PSU
past allocations youth IPP
achievements scheme
10,000 5000 20,000 10,000 10,000 5,000
60,000 MW
Table 1: Revised targets of 60 GW under the National Solar Mission (NSM)8
There are a few key observations on these targets:
Private companies’ can participate in a total of 30
GW of projects i.e. half the planned capacity. This is
under - NSM Phase II Batch II & III (5,000 MW),
Private IPP (5,000 MW) and under state allocations
(20,000 MW) i.e. a total of 30,000 MW. Going by the
investment commitments made during MNRE’s
flagship conference, REInvest, private companies are
willing to do much more. Out of the total solar
commitment of 171 GW, 90% is from private
developers and only about 20 GW from publically
owned companies of India9.
A majority of this target is allocated to states. This
means that the onus would be on India’s state
distribution companies to purchase solar power.
Unless backed by the Central Government, given the
poor financial health of these DISCOMs, these
projects could be non-starters – or would not attract
7 BRIDGE TO INDIA. India Solar Handbook June 2015. Page 18. http://bit.ly/1L2c78q
8 Government of India. Ministry of New and Renewable Energy. New Solar Power Policy. http://bit.ly/1inq9qd
9 These commitments were made during the RE-Invest, 2nd Renewable Energy Global Investors Meet & Expo
conference held in New Delhi, India between 18th – 20th February 2015. The complete list of commitments can be found
here: http://bit.ly/1EurZ2i
A GERMI White Paper | 9serious players. As a consequence quality of the
plants may suffer.
The farmer and unemployed scheme, while good in
spirit, may be a channel for unscrupulous people
masquerading as farmers to ‘grab’ projects.
Certifying unemployed youth and farmers can be
very difficult and leaves room for corruption.
Overall, there is very little clarity on how these
different schemes fit with the overall targets that
have been assigned to states (table 1). The funding
mechanisms (who funds the state targets?) are also
unclear.
A GERMI White Paper | 10Ample Equity
The total investment required to meet the 100 GW target
is estimated at INR 550,000 cr. (USD 85 bn.). Accordingly,
the equity requirement between now and 2022 is
estimated at 1.6 lakh Cr. (USD 25 bn).
1,00,000 92,597 94,483 93,627
90,250 90,416
90,000
77,520
80,000
70,000
60,000
INR Cr
50,000 Debt
40,000 Equity
30,000
20,000
12,400
10,000
-
FY 2015 - FY 2016 - FY 2017 - FY 2018 - FY 2019 - FY 2020- FY 2021 -
16 17 18 19 20 21 22
Figure 3: Total debt and equity required to support the 100
GW target
The key assumptions in arriving at the number are:
Debt : Equity ratio Unit 70:30
Cost of rooftop INR/kW 80,000
scale system (2015)
Cost of utility scale INR Cr./MW 6
system (2015)
Annual decline of % 5
capital cost
Table 2: Assumptions for capital requirement
The key question here is that, “Is there adequate equity
to fund these projects?”
Going by the current investment climate in India, the
appetite for equity investment in solar energy projects is
much higher than 100 GW. Private and public companies
made an overall investment commitment of 271 GW.
80% of these commitments (171 GW) were towards
A GERMI White Paper | 11solar PV projects10. This goes to show that equity should
not be a constraint in India meeting the 100 GW goal.
Other
Renewables
Commitments
20%
Solar Specific
Commitments
80%
Figure 4: Split of the 271 GW investment commitments
made during RE-Invest 2015
The Government should apportion a greater part of the
60 GW target to private company participation in order
to harness both foreign and domestic equity.
10These commitments were made during the RE-Invest, 2nd Renewable Energy Global Investors Meet & Expo
conference held in New Delhi, India between 18th – 20th February 2015. The complete list of commitments can be found
here: http://bit.ly/1EurZ2i
A GERMI White Paper | 12Deficient Debt
The total debt required is estimated at INR 385,000 cr.
(USD 60 bn.) (see figure 1). Private and public lenders
in India have committed to finance 70 GW worth of
renewable energy projects. A large portion of this is
likely to be taken up by solar and wind energy projects.
Further, these commitments may not translate to actual
advances to projects, which is a function of the
promoters financial capability and the strength of the
PPA.
The Indian market has seen most of the solar PV
projects being funded by debt raised from Indian banks.
The participation of foreign banks has remained limited
(some estimates suggest 15% of all projects
commissioned in India). Despite the loans being raised
from foreign banks, it tends to be a part debt with an
Indian counterpart11.
A key constraint in lending to solar power projects is
that most Indian banks are over exposed to the power
sector. The Reserve Bank of India (RBI) prescribes
sectorial lending limits that constraints lending to the
power sector. Most of these projects are now being
classified as stressed assets or are having their loans
recast. According to India’s central bank, the Reserve
Bank of India, the power sector (both generation and
distribution) contributed to 16.1% of stressed advances
of all Indian commercial banks. Indian banks have
restructured a total of INR 530 bn. (USD 8.8 bn.) of
loans to the power sector12.
Solar as a priority lending sector
Indian banks are restricted to lend only 10-15% of all
their advances to the infrastructure sector as per the
RBI’s prudential lending norms. This translates to about
4% for the power sector as a whole. Most public and
private banks in India have already reached the ceiling
lending limits from funding large coal power projects13.
This had left banks with very little room to fund
renewable energy projects. In April 2015, the RBI
announced that renewable energy projects would fall
11 BRIDGE TO INDIA. Telephonic Interview. August 2015.
12 Reserve Bank of India. Financial Stability Report. June 2015. http://bit.ly/1IOlClw
13 Climate Policy Initiative. Meeting India’s Renewable Energy Targets: The Financing Challenge. Page 12. November
2012. http://bit.ly/1EXaFTy
A GERMI White Paper | 13under the priority sector14. What this means is that,
banks would have to set aside 40% of all advances to
sectors that the RBI determines as being ‘priority’ to
India’s growth – renewable energy projects being one of
them. Renewable energy projects would no longer be
restricted to the 4% ceiling limit.
Unfortunately, the RBI has also set a maximum cap of
INR 15 Cr. (USD 2.3 mn.) per borrower. This translates
to a solar system capacity of just over 3 MW. Given that
the minimum project sizes in India is around 25 MW15,
this limit is woefully inadequate and would shut-off
larger developers from accessing these funds. The
industry has already requested the RBI to increase this
limit to INR 500 cr. (USD 77 mn.)16.
14 Reserve Bank of India. Priority Sector Lending - Targets and Classification. April 23rd 2015. http://bit.ly/1EX9HXt
15 The minimum project size under SECI tender for 250 MW at Charanka Solar Park, Gujarat is 25 MW. Tender Number
SECI/JNNSM/P-2/B-3/RfS/GJ/082015. 31st August 2015
16 The Economic Times. Clean energy industry hails inclusion of renewables in priority sector lending; progressive move
says Suzlon. April 24th 2015. Accessed on: September 10, 2015. http://bit.ly/1EXcQ9L
A GERMI White Paper | 14The Green Bond Market
An interesting development has been the issue of Green
Bonds in the market. YES bank, one of the mid sized
banks in India (market capitalization of INR 29,682 Cr)
has issued two rounds of green bonds. The first round
was issued in February 2015 and the bank raised 7,200
crore (USD 1.2 bn.) against an issuance of INR 1,000 Cr.
(USD 0.16 bn)17.
The bank issued a second round of bonds worth INR
315 Cr. (USD 50 mn.) in August 2015 to the
International Finance Corporation (IFC). This comes in
the wake of Yes Bank committing funding for 5,000 MW
of solar power projects during the RE-Invest
Conference conducted in February 2015.
The Government owned Indian Renewable Energy
Development Agency (IREDA) was perhaps the first to
issue a bond for renewable energy projects. It issued
bonds worth INR 500 Cr (USD 83 mn.) in February
2014 and has since then issued bonds worth 2,207 Cr.
(USD 367 mn.)18. The Export-import Bank of India also
earlier in March 2015 issued green bonds worth USD
500 mn. This was India’s first dollar denominated green
bonds. This too was over-subscribed nearly 3.2 times.
Being an Export-Import bank, this corpus of funds is not
likely to be used to fund solar projects in India19.
17 YES Bank. ‘YES BANK Places INR 315 Crore (USD 50 MM equivalent) of Green Infrastructure Bond With International
Finance Corporation, Washington’. August 5th 2015. http://bit.ly/1EypLPI
18 IREDA. ‘Resource Mobilization as on 31.3.2015’.http://bit.ly/1KZTkpS
19 Exim Bank India. Press Releases. Exim Bank Raises US $ 500 Million 5 Year Tenor Reg S Green Bond At a Coupon 2.75%
p.a. March 24th 2015. http://bit.ly/1Kcx4bK
A GERMI White Paper | 15Interest Rate /
Lending Bond Value Coupon Rate Tenure Issuing
Institution (%) (years) Currency
8.16 10
INR 500 cr.
IREDA 8.55 15 INR
(USD 77 mn.)
8.55 20
EXIM Bank of
USD 500 mn 2.75% 5 USD
India
Round 1|
8.85% 10
INR 7,200 cr.
(USD 1.2 bn.)
YES Bank
Round 2| EUR
INR 315 cr.
6.45% 5
(USD 50 mn.)
Table 3: Overview of Green Bonds in India
A GERMI White Paper | 16Penurious PPAs
An equally important aspect of financing is the
ability of the off-takers i.e. DISCOMs to purchase
power. According to a recent report released by the
Ministry of Power, Government of India, only 7 out
of 40 utilities surveyed are rated in the category of
A+ / A (‘Very High / High Operational and Financial
Performance Capability’)20. The remaining 33 rated
utilities had cost coverage ratio of less than 0.9021,
which indicates that these utilities not earning
enough to meet their expenses. The cumulative
losses from all DISCOMs in India are estimated to be
around INR 200,000 cr. (USD 30 bn.)22.
State Utilities State Utilities
with Grade C with Grade A+
5% 12% State Utilities
with Grade A
5%
State Utilities
with Grade C+
20%
State Utilities
with Grade B+
State Utilities
25%
with Grade B
33%
Figure 5: Ratings of DISCOMs in India (for a full
description of the grading’s, refer to the report)23
20 Ministry of Power. ‘State Distribution Utilities Third Annual integrated Rating’. http://bit.ly/1EO8UbH
21 Coverage ratio is a ratio of total revenues / total expenditure for any given financial year. Ideally, this ratio should be
greater than 1.0
22 TERI. Crisis in India’s Electricity Distribution Sector: Time to Reboot for a Viable Future. January 2015.
http://bit.ly/1KLy5ho
23 Ministry of Power. ‘State Distribution Utilities Third Annual integrated Rating’. http://bit.ly/1EO8UbH
A GERMI White Paper | 17A common benchmark that utilities use to evaluate
the cost effectiveness of solar power versus
traditional power is the Average Pooled Purchase
Cost (APPC). The APPC is essentially the weighted
average of the price of power that a DISCOM buys
from different sources. Since renewable energy has
not traditionally contributed significantly to the
energy mix, this metric does not (yet) include
purchase from expensive sources of power. It is
important to note that short-term power purchases
(day ahead) from the exchange are also not
included in this metric, although DISCOMs are
increasingly moving to short-term power purchases
for the want of access to stable long-term reserves.
This has effectively meant that the APPC no longer
reflects the true weighted cost of power. It tends to
be slightly lower than the actual cost of power.
When utilities make decisions to purchase power
from different sources of energy, they benchmark it
against the APPC. Solar energy – from both rooftop
and utility scale systems – is still much more
expensive than the APPC. This coupled with the
poor financial health make DISCOMs hesitant to
purchase expensive solar power.
9.0 8.0
8.0 7.6
7.2
6.9 6.5
7.0 6.2
Price (INR/kWh)
6.0 5.7
6.0 5.4
5.0 4.6 5.9
4.0 4.9 4.4
5.1
3.0
2.0
1.0
0.0
FY 2015 - FY 2016 - FY 2017 - FY 2018 - FY 2019 - FY 2020- FY 2021 -
16 17 18 19 20 21 22
Average PPA - Rooftop Average PPA - Utility Average APPC
Figure 6: Projected development of APPC and solar tariffs in India FY 2015-16 to FY
2021-22
Figure 6 depicts this trend. However, with APPC
increasing rapidly at 9% per year (all India average),
and solar prices rapidly nose-diving, grid parity with
APPC isn’t too far away. The calculations show that
A GERMI White Paper | 18by FY 2018-19, solar power purchased from utility
scale plants should be at parity with APPC. Solar
power from rooftop plants should reach parity by FY
2021-22. The cumulative subsidy required in order
to fund the purchase of solar power until FY 2021-22
would amount to just over 10,000 cr. (USD 1.5 bn.).
Key Assumptions
Assumption Value
Average solar tariff – INR 6.00/kWh
Utility Projects (2015)
Average solar tariff – INR 8.00/kWh
Rooftop Projects (2015)
Average APPC (2015) INR 4.00/kWh
Average annual decline in 5%
solar tariffs
Average annual increase 9%24
in APPC
Table 4: Overview of assumption for analysis
presented in figure 6
This figure is still quite large and DISCOMs may not be
able to absorb the additional expense. Until then, one
option is for the Central Government to bridge the gap.
The National Clean Energy Fund (NCEF) was
established in 2010 precisely for this purpose. The
fund, though, is not solar specific and is used to fund
many initiatives. The fund is populated by a tax on
coal mined in India. The cess has been progressively
increased from INR 50 per ton of coal mined in 201025
to INR 200 per ton of coal mined in 201526. The fund
has a corpus of INR 16,388 Cr (USD 2.5 bn.) as on
August 6th 201527.
Figure 7 shows the NCEF receives approximately INR
10,000 cr. (USD 1.5 bn.) from the coal cess (see table
5). The orange bar shows the cumulative subsidy that
needs to be disbursed every year to bridge the
viability gap (difference between the solar PPA tariff
and the APPC). The subsidy increases rapidly as
projects are cumulatively added on a yearly basis and
starts to taper off as grid parity (with APPC) is reached
by FY 2018-19 (figure 6).
24 Compiled using data from Page 12 of http://bit.ly/1O2O9Zv and Page IX of http://bit.ly/1O2OgEn
25 Ministry of Finance, Government of India. Budget 2010-11, Speech of Pranab Mukherjee, Minister of Finance. February
26th 2010. Clause 154. http://bit.ly/1Mg9UaU
26 LiveMint. Union Budget 2015: Full text of finance minister’s speech. Clause 123. http://bit.ly/1MgaO7n
27 Government of India. Ministry of New and Renewable Energy. Clean Energy Fund. http://bit.ly/1fJELy0
A GERMI White Paper | 1912,000
Amount (INR Cr.)
10,000
8,000
6,000
4,000
2,000
-
FY 2015 - FY 2016 - FY 2017 - FY 2018 - FY 2019 - FY 2020- FY 2021 -
16 17 18 19 20 21 22
NCEF Funds Available Subsidy Required
Figure 7: Comparison of NCEF funds available with the total subsidy required to
bridge the grid parity gap (see in conjunction with figure 6 above)
Coal production in India has gradually increased and
is now expected to increase much faster due to the
allocation of coal blocks from the recently concluded
auctions (see table 5). However, for the purpose of this
report, we have assumed a uniform annual output of
500 million metric tones as a “base case scenario”.
FY 12 FY 13 FY 14 FY 15
435.84 452.21 462.42 494.24
Table 5: Annual Coal Production in million metric
tones28
The MNRE has allocated 20,000 MW to states (see
table 1) that means that the state DISCOMs take on
the burden to finance the expensive solar PPAs. It
would rather be prudent for the Central Government
to use an intermediary such as SECI or NVVN to act
as a trader and back these PPAs using funds from the
National Clean Energy fund.
28 Business Standard. Coal Output on a High but demand dries up. September 7th 2015. http://bit.ly/1L21IJT
A GERMI White Paper | 20Key Takeaways
India would require a total of 550,000 cr. (USD 85
bn.) to fund the capital expenditure for the 100 GW
plan.
The Government should announce a firm plan on
how it intends to achieve the 100 GW target. How
would the state wise targets apportioned by the
MNRE be met? How would SECI and NVVN come
into the picture? What is the future of the NSM
Phase 3? Currently allocations are happening on an
ad-hoc basis and there appears to be no clarity to
the public on how these allocations fit into the
larger framework of the 100 GW goal.
Given the overwhelming interest among private
developers and investors to invest in solar in India,
the Government should allocate a greater portion of
the targets to the private sector. Public sector
companies such as the railways, oil marketing
companies and even defense establishment need
not invest into non-core business to enable India
achieve the 100 GW target.
Equity is not a concern. There appears to be
overwhelming interest to invest in solar energy
projects in India.
Debt is a constraint in India, primarily because
most banks have reached ceiling limits to lend to
the power sector. The recent move by the RBI to
include renewable energy into the priority sector
does not help the sector because of the inadequate
ceiling limit of INR 15 cr. (USD 2.3 mn.) per project.
The weakest link in the chain is the ability of the
DISCOMs to purchase ‘expensive’ solar power. Only
seven of India’s DISCOMs are financially sound. The
cumulative losses among all DISCOMs in India
stands at INR 200,000 cr. (USD 90 bn.)
The total subsidy required until 2022 in order to
bridge the gap between ‘expensive’ solar power and
the APPC is estimated to be INR 10,000 cr. (USD 1.5
bn.). The NCEF could meet this subsidy
requirement, however, it must be kept in mind that
the NCEF funds other renewable energy and
environmental programs in India. The Government
might need to secure other sources to bridge the
gap.
A GERMI White Paper | 21About GERMI
Gujarat Energy Research & Management Institute
(GERMI) is a center of excellence in industry learning
and has set up to develop human resource assets to
cater to the petroleum and allied energy sectors,
improve knowledge base of policy makers and
technologists and provide a competitive edge to
leaders to compete in the global arena.
http://www.germi.org
Author
Akhilesh Magal is the Head Advisor – Solar Energy at
GERMI. He is an environment engineer from Carnegie
Mellon University and is an expert on solar policies
and grid integration of renewable energy. His interests
include renewable energy policies, regulations and
markets with a focus on how these metrics can enable
business in India. He can be reached at
akhilesh.m@germi.res.in
A GERMI White Paper | 22You can also read