The Inhomogeneity of Composition Along the Magnetic Cloud Axis - Frontiers
←
→
Page content transcription
If your browser does not render page correctly, please read the page content below
ORIGINAL RESEARCH
                                                                                                                                                  published: 15 July 2021
                                                                                                                                          doi: 10.3389/fphy.2021.684345

                                             The Inhomogeneity of Composition
                                             Along the Magnetic Cloud Axis
                                             Hongqiang Song 1,2*, Qiang Hu 3, Xin Cheng 4, Jie Zhang 5, Leping Li 2, Ake Zhao 6, Bing Wang 1,
                                             Ruisheng Zheng 1 and Yao Chen 1
                                             1
                                               Shandong Provincial Key Laboratory of Optical Astronomy and Solar-Terrestrial Environment, and Institute of Space Sciences,
                                             Shandong University, Weihai, China, 2CAS Key Laboratory of Solar Activity, National Astronomical Observatories, Chinese
                                             Academy of Sciences, Beijing, China, 3Department of Space Science and CSPAR, University of Alabama in Huntsville, Huntsville,
                                             AL, United States, 4School of Astronomy and Space Science, Nanjing University, Nanjing, China, 5Department of Physics and
                                             Astronomy, George Mason University, Fairfax, VA, United States, 6College of Physics and Electric Information, Luoyang Normal
                                             University, Luoyang, China

                                             Coronal mass ejections (CMEs) are one of the most energetic explosions in the solar
                                             system. It is generally accepted that CMEs result from eruptions of magnetic flux ropes,
                                             which are dubbed as magnetic clouds (MCs) in interplanetary space. The composition
                          Edited by:
                                             (including the ionic charge states and elemental abundances) is determined prior to and/or
                       Markus Roth,
  Albert Ludwigs Universität Freiburg,       during CME eruptions in the solar atmosphere and does not alter during MC propagation
                             Germany         to 1 AU and beyond. It has been known that the composition is not uniform within a cross
                         Reviewed by:        section perpendicular to the MC axis, and the distribution of ionic charge states within a
                      Wageesh Mishra,
 Indian Institute of Astrophysics, India
                                             cross section provides us an important clue to investigate the formation and eruption
                         Bhuwan Joshi,       processes of flux ropes due to the freeze-in effect. The flux rope is a three-dimensional
  Physical Research Laboratory, India
                                             magnetic structure intrinsically, and it remains unclear whether the composition is uniform
                  *Correspondence:
                                             along the flux rope axis as most MCs are only detected by one spacecraft. In this study, we
                     Hongqiang Song
                  hqsong@sdu.edu.cn          report an MC that was observed by Advanced Composition Explorer at ∼1 AU during
                                             March 4–6, 1998, and Ulysses at ∼5.4 AU during March 24–28, 1998, sequentially. At
                    Specialty section:       these times, both spacecraft were located around the ecliptic plane, and the latitudinal and
         This article was submitted to
            Stellar and Solar Physics,       longitudinal separations between them were ∼2.2° and ∼5.5°, respectively. It provides us
               a section of the journal      an excellent opportunity to explore the axial inhomogeneity of flux rope composition, as
                    Frontiers in Physics
                                             both spacecraft almost intersected the cloud center at different sites along its axis. Our
           Received: 23 March 2021
                                             study shows that the average values of ionic charge states exhibit significant difference
            Accepted: 17 June 2021
            Published: 15 July 2021          along the axis for carbon, and the differences are relatively slight but still obvious for charge
                            Citation:        states of oxygen and iron as well as the elemental abundances of iron and helium. Besides
Song H, Hu Q, Cheng X, Zhang J, Li L,        the means, the composition profiles within the cloud measured by both spacecraft also
Zhao A, Wang B, Zheng R and Chen Y
        (2021) The Inhomogeneity of          exhibit some discrepancies. We conclude that the inhomogeneity of composition exists
    Composition Along the Magnetic           along the cloud axis.
                         Cloud Axis.
              Front. Phys. 9:684345.         Keywords: coronal mass ejection, magnetic flux rope, interplanetary coronal mass ejection, magnetic cloud, ionic
     doi: 10.3389/fphy.2021.684345           charge state, elemental abundance

Frontiers in Physics | www.frontiersin.org                                           1                                             July 2021 | Volume 9 | Article 684345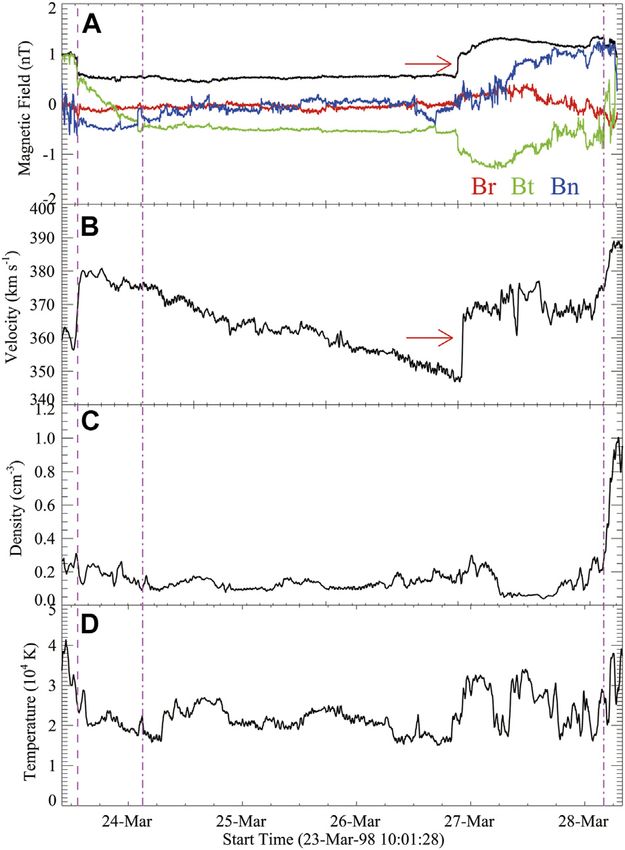
Song et al.                                                                                                                          Inhomogeneity of Composition

1 INTRODUCTION
Coronal mass ejections (CMEs) are an energetic explosive
phenomenon in the solar atmosphere [1–4], and they are
called interplanetary coronal mass ejections (ICMEs) after
leaving the corona. When ICMEs interact with the Earth’s
magnetosphere, they can cause geomagnetic storms [5–7] and
influence the normal work of high-tech equipments, such as
satellites, power grids, and GPS navigation systems [8, 9].
Therefore, it is of great significance to grasp the trigger
mechanisms and eruption processes of CMEs.
   The researchers of the solar physics community have reached a
consensus that CMEs result from eruptions of magnetic flux
ropes (MFRs), which refer to a volumetric current channel with
the helical magnetic field lines wrapped around the central axial
                                                                               FIGURE 1 | Schematic drawing of the spacecraft trajectory crossing an
field [10, 11]. In white light coronagraph images, CMEs often                   ICME. The black dashed and solid lines represent the shock and MFR,
exhibit a three-part structure, that is, a bright front, a dark cavity,        respectively. The red dotted lines delineate the MFR axis. The ICME nose portion
and a bright core [12]. The cavity and core have been considered               is marked with the blue rectangle in Panel (A), which is enlarged for details
as the MFR cross section and erupted filament, respectively, for                in Panel (B). The blue, black, and red arrows describe the different trajectories of
                                                                               spacecraft, and the green dots denote the center of each cross section.
several decades. However, recent studies clearly demonstrated
that both the filaments and hot channel MFRs can appear as the
bright core [13–16]. The hot channels are first revealed through
extreme ultraviolet passbands sensitive to high temperatures (e.g.,           C/O) than slow ones. Owens [48] analyzed the charge states of
131 and 94 Å) [17], and they can also be observed in hard X-ray               carbon, oxygen, and iron within 215 ICMEs, including 97 MCs
[18] and microwave [19] images. Researchers also suggest that the             and 118 non-cloud events, and found that MCs exhibit higher
dark cavity corresponds to a low-density region with a sheared                ionic charge states than non-cloud events. Zurbuchen et al. [49]
magnetic field in the early eruption stage [16].                               performed a comprehensive analysis of the elemental abundances
   Both theoretical and observational studies reveal that MFRs                of 310 ICMEs from 1998 March to 2011 August. They reported
can form prior to [17, 20–23] and during [24–28] solar eruptions,             that the abundances of low-FIP elements within ICMEs exhibit a
while they might exist before eruptions in more events [29]. The              systematic increase compared to the solar wind, and the ICMEs
numerical simulations demonstrate that the repetitive magnetic                with elevated iron charge states possess higher FIP fractionation
reconnections could play an important role during the MFR                     than the other ICMEs. Very recently, Song et al. [50] reported that
evolution [30]. The remote-sensing observations have been                     all the ICME compositions possess the solar cycle dependence.
widely used to investigate the MFR formation process [26, 31,                     In the meantime, some attentions are paid on the composition
32]. The charge states within ICMEs are frozen-in near the Sun                distribution inside each MC. Song et al. [37] found that the
[33], and the relative abundances of elements with different first             average values of iron charge states () can present four
ionization potentials (FIPs) are different obviously in the corona            regular profiles along the spacecraft trajectories throughout MCs,
and photosphere [34, 35]. As the composition does not alter                   that is, (i) a bimodal profile with both peaks higher than 12+, (ii) a
during CME propagation to 1 AU and beyond [36], the in situ                   unimodal profile with peaks higher than 12+, and (iii) and (iv) the
data are also employed to analyze the MFR formation [28, 37, 38]               profile remains beyond and below 12+ throughout the
and plasma origin [39, 40] of CMEs. So far, the most complete                 spacecraft trajectory inside an MC, respectively. Their studies
composition data of ICMEs are provided by the solar wind ion                  demonstrated that the charge states can be non-uniform within
composition spectrometer (SWICS) aboard Advanced                              the cross section of a specified MC and suggested that the above
Composition Explorer (ACE) and Ulysses, which can provide                     profiles are tightly correlated with both the impact factor of
the charge states and elemental abundances of ∼10 elements [41].              spacecraft trajectories and the formation process of MFRs. For
   When an ICME has its nose pass through a spacecraft, the                   example, the bimodal profile implies that the MFR exists prior to
MFR will be detected as a magnetic cloud (MC) [42–44]. This is                eruption; see Figure 8 in [37] for more details. In addition, the
schematically shown in Figure 1A (also see [45, 46] for a similar             elemental abundances are not uniform within one cross section
cartoon), where the purple arrow depicts a spacecraft trajectory              either [39]. Therefore, a spacecraft can detect different
crossing one ICME through its nose portion as marked with the                 composition profiles when it crosses one MC along the blue
blue rectangle. Figure 1B displays the MFR within the rectangle,              and black arrows as shown in Figure 1B, which are located in the
and the green dots represent the center of each cross section. The            same cross section perpendicular to the axis but with different
black, blue, and red arrows depict three different trajectories.              impact factors. However, whether the inhomogeneity of
   Several statistical studies have been conducted on ICME                    composition exists along the MC axis remains unclear because
composition. Huang et al. [47] analyzed the composition                       most MCs are detected only by either ACE or Ulysses. Given the
inside 124 MCs and reported that fast MCs have higher                         MC is a three-dimensional (3D) structure intrinsically, the axial
charge states and relative elemental abundances (except the                   distribution of composition can reveal whether different portions

Frontiers in Physics | www.frontiersin.org                                2                                                  July 2021 | Volume 9 | Article 684345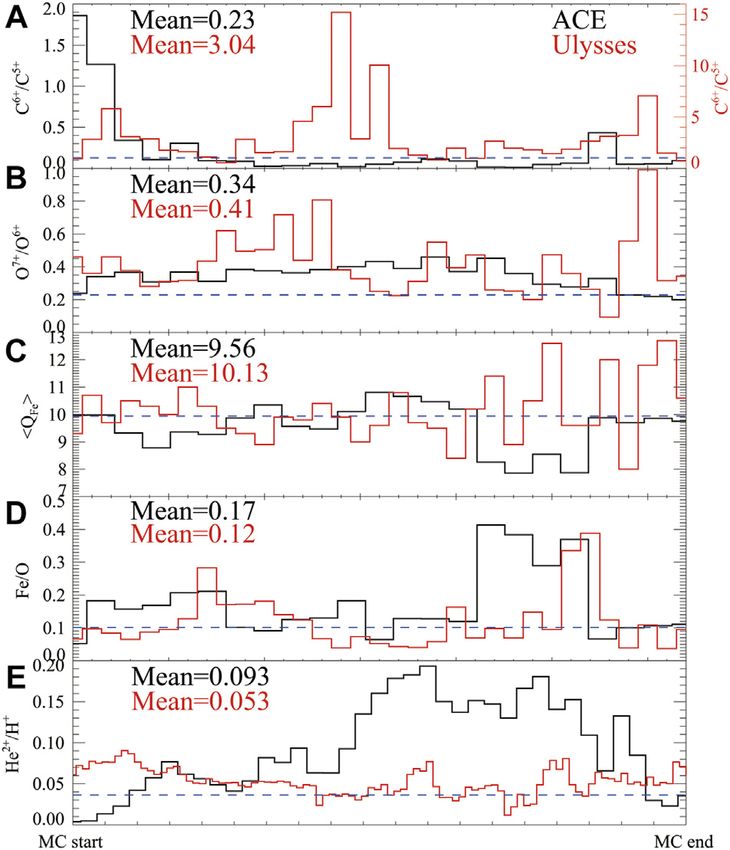
Song et al.                                                                                                                   Inhomogeneity of Composition

along the MFR axis experience different eruption processes in the
corona.
    In this study, we report an intriguing event, in which an MC
was observed by ACE at ∼1 AU during March 4–6, 1998, and
Ulysses at ∼5.4 AU during March 24–28, 1998. At these times,
both spacecraft were located around the ecliptic plane, and the
latitudinal and longitudinal separations between them were ∼2.2°
and ∼5.5°, respectively. The Grad–Shafranov (GS) reconstruction
[51, 52] demonstrated that the MC axis oriented in an
approximate east–west direction with the axis direction at
Ulysses being tilted slightly away from that at ACE, and both
spacecraft almost intersected the MC center [53]. This implies
that the two spacecraft cross the MC along two trajectories
resembling the black and red arrows in Figure 1B,
respectively, and provide us an excellent opportunity to
explore whether the composition is uniform along the axis.
We introduce the data in Section 2 and give the observations
in Section 3. Section 4 presents the conclusion and discussion.

2 DATA
The data used in this study are provided by several payloads on
board the ACE and Ulysses spacecraft. ACE is in a halo orbit
around the first Lagrangian point between the Earth and the Sun
since it was launched in 1997. Ulysses was launched in 1990 and
entered an elliptical and heliocentric orbit with an aphelion at
∼5.4 AU from the Sun and a perihelion distance of ∼1.34 AU.
Magnetic field data are provided by ACE/MAG [54] and Ulysses/
                                                                             FIGURE 2 | Magnetic field and solar wind parameters measured by ACE
magnetic field [55] instruments. The bulk solar wind properties
                                                                             near 1 AU. (A) Total magnetic field strength (black) and its three components
and the helium abundances are from the Solar Wind Electron,                  in RTN coordinate and (B–D) velocity, density, and temperature of solar wind.
Proton, and Alpha Monitor (SWEPAM) [56] on board ACE and                     The vertical dashed line denote the shock, and the dash-dotted lines
the Solar Wind Observations Over the Poles of the Sun                        demarcate the MC boundaries.
(SWOOPS) [57] on board Ulysses. The SWICS instruments
on board both spacecraft [58, 59] offer the composition of
heavy ions.                                                                 velocity, density, and temperature of the ICME sequentially. The
                                                                            declining profile of velocity indicates that the MFR is expanding.
                                                                               Ulysses detected an MC during March 24–28 [62] as shown in
3 OBSERVATIONS                                                              Figure 3, where the magnetic field, velocity, density, and
                                                                            temperature are presented from top to bottom panels
The criteria used to identify MCs near 1 AU mainly include the              sequentially. The velocity profile in Figure 3B shows that the
enhanced magnetic field strength, smoothly changing of                       MC keeps expansion during the propagation to 5.4 AU. Due to
magnetic field direction, declining profile of solar wind                     the continuous expansion, the total magnetic field intensity
velocity, low proton temperature (or low plasma β), and                     within this MC decreased obviously near 5.4 AU compared to
elevated He2+/H+ ratio [42, 60, 61]. ACE detected an MC                     ∼1 AU, see Figures 2A, 3A. A shock exists within the MC as
during March 4–6, 1998, as shown in Figure 2. The vertical                  depicted with the red arrows in Figures 3A,B, and the MC rear
dashed line denotes the shock driven by the ICME, and the two               boundary can be identified through the He2+/H+ ratio and the
dash-dotted lines demarcate the MC boundaries.                              plasma β value [53]. Note that the shock does not influence our
   Figure 2A shows the total magnetic field strength and its three           analyses about the ionic charge states and elemental abundances.
components in RTN coordinate, where the x-axis (R) points from                 Previous studies [53, 63] have confirmed that the MC
Sun center to spacecraft, the y-axis (T) is the cross product of            displayed in Figure 3 corresponds to that in Figure 2. Skoug
solar rotational axis and X axis, lying in the solar equatorial plane       et al. [63] fitted both MCs using a force-free model of the
towards the west limb, and the z-axis (N) is the cross product of x         magnetic field [64] and found that their central speed and
and y axes. The total magnetic field strength (black) increased              cloud axis direction were very similar. The increase in MC
obviously compared to the background solar wind, and the Bn                 diameter between 1 and 5.4 AU was also consistent with an
component (blue) changed its direction gradually within the MC,             expanding MC. Besides, both MCs had left-handed field
which are the typical features of MCs. Figures 2B–D present the             structure and contained the similar magnetic fluxes, which

Frontiers in Physics | www.frontiersin.org                              3                                              July 2021 | Volume 9 | Article 684345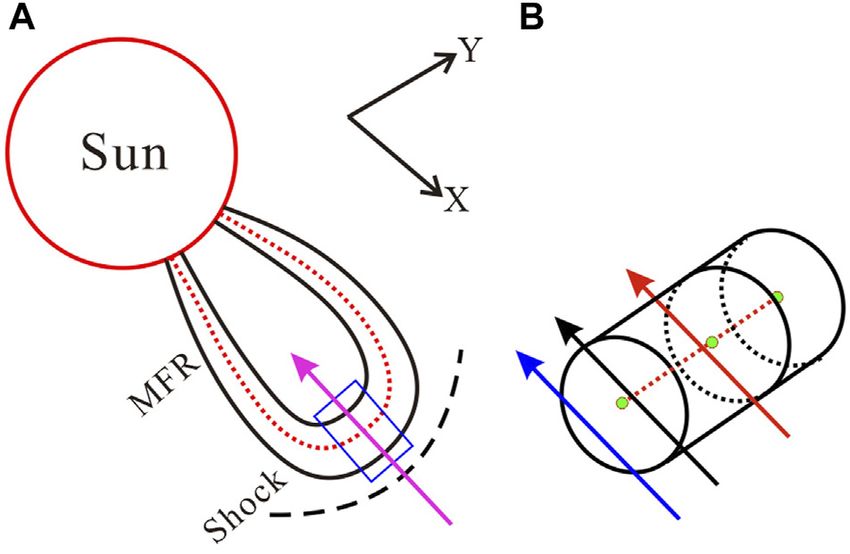
Song et al. Inhomogeneity of Composition
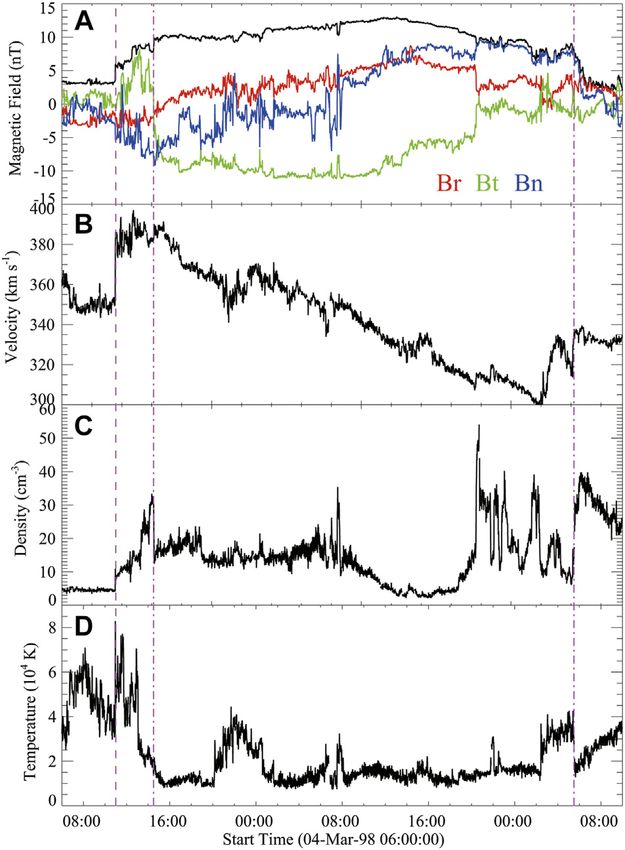
FIGURE 4 | Composition within the MC provided by SWICS aboard ACE
(black) and Ulysses (red). Panels (A–E) show the C6+/C5+, O7+/O6+,,
Fe/O, and He2+/H+ sequentially, and their average values are also presented in
each panel. Note that the Ulysses values in Panel (A) correspond to the
right ordinate. The blue horizontal dashed lines depict the corresponding
FIGURE 3 | Magnetic field and solar wind parameters measured by means of slow wind during solar maximum [65]. The MC started from 14:30
Ulysses near 5.4 AU. (A) Total magnetic field strength (black) and its three UT on March 4 (3:00 UT on March 24) and ended at 5:30 UT on March 6 (4:00
components in RTN coordinate and (B–D) velocity, density, and temperature UT on March 28) for ACE (Ulysses).
of solar wind. The vertical dashed line denotes the shock, and the dash-
dotted lines demarcate the MC boundaries. The red arrows in (A) and (B)
depict the shock inside the MC.
charge states (C6+/C5+, O7+/O6+, and and elemental
abundances (Fe/O and He2+/H+) are presented in
were further confirmed by Du et al. [53] with the GS Figure 4A–E. The average values within the MC are also
reconstruction technique. In addition, Du et al. [53] input the shown in each panel. The blue horizontal dashed lines
plasma and magnetic field data observed by ACE to their represent the corresponding means in the slow solar wind
magnetohydrodynamic model to simulate the MC propagation during solar maximum [65] for reference and comparison.
and evolution to the Ulysses location. They compared the model Our study shows that the average values of composition within
predictions and the Ulysses observations, and identified further an MC can possess significant differences along the axis. For
that Ulysses and ACE observed the same MC. As mentioned, the example, the C6+/C5+ ratio measured by Ulysses (3.04) is 12 times
ACE (at ∼1 AU) and Ulysses (at ∼5.4 AU) were located near the higher than that by ACE (0.23). In the meantime, the differences
ecliptic plane with a latitudinal separation of ∼2.2° and a could be relatively slight for some compositions. For example, the
longitudinal separation of ∼5.5° when they detected the MC. O7+/O6+, ratio measured by Ulysses (0.41) is higher than that of
The GS reconstruction showed that the MC axis oriented in an ACE (0.34) by ∼21%. The means of detected by both
approximate east-west direction, and both spacecraft almost spacecraft are nearly identical (∼10). As to the elemental
intersected the MC center [53], which support that ACE and abundance, the Fe/O ratio by ACE (0.17) is ∼42% higher than
Ulysses crossed the MC at different sites along its axis and provide that by Ulysses (0.12), and the He2+/H+ ratio of ACE (0.093) is
us an excellent opportunity to explore whether the axial higher than that of Ulysses (0.053) by ∼75%.
composition is uniform. Besides the average values, the composition profiles measured
We compare the composition measured by both spacecraft in by both spacecraft also exhibit discrepancy. Figure 4A shows that
Figure 4, where the black and red lines represent the results of the C6+/C5+ of Ulysses elevated at the MC center, while the ACE
ACE and Ulysses, respectively. Please note that we only plot the profile did not exhibit the central peak. The O7+/O6+ of Ulysses
composition within the MC, that is, the left/right boundary of presented a multi-peak profile, while ACE did not detect obvious
each panel corresponds to the MC start/end time. The ionic peaks as shown in Figure 4B. The He2+/H+ of ACE elevated in the
Frontiers in Physics | www.frontiersin.org 4 July 2021 | Volume 9 | Article 684345Song et al. Inhomogeneity of Composition
second half as displayed in Figure 4E, different from the profile of axial inhomogeneity of elemental abundances implies that the
Ulysses that did not have large variation along the whole path. abundances are not uniform throughout the MC source region on
These can rule out the possibility that the inhomogeneity of the Sun.
composition is induced by the erosion [66] completely during Our study demonstrated that the axial composition is non-
propagation from 1 to 5.4 AU. Moreover, the erosion effect should uniform inside an MC, while we cannot conclude that this large
be small for this event as both MCs have the similar magnetic fluxes inhomogeneity exists within each MC. More events are necessary
as mentioned. The profiles of and Fe/O measured by both to investigate the inhomogeneity of composition along the MC
spacecraft also exhibit some different fluctuation characteristics as axis, which needs a CME being detected by several spacecraft
displayed in Figures 4C,D. The above results prove that the sequentially or simultaneously at different locations. This becomes
composition is inhomogeneous along the MC axis. more realizable as Solar Orbiter was launched in 2020 [71]. Besides,
Chinese solar physicists are proposing several space missions [72]
to explore the Sun and solar eruption further. The Lay a Finger on
4 CONCLUSION AND DISCUSSION the Sun [73] will launch a spacecraft to explore the solar eruption
near the Sun; thus, it will provide more MC cases that are measured
An MC was detected by ACE at ∼1 AU and Ulysses at ∼5.4 AU sequentially near the Sun and around 1 AU combined with other
sequentially during March 1998, when both spacecraft were spacecraft. The Solar Ring [74] plans to deploy six spacecraft,
located around the ecliptic plane. The latitudinal and grouped in three pairs, on a sub-AU orbit around the Sun. The two
longitudinal separations between them were ∼2.2° and ∼5.5°, spacecraft in each group are separated by ∼30° and every two
respectively. The GS reconstruction [53] showed that the axis groups by ∼120°, which can provide more cases that are measured
oriented in an approximate east–west direction, and both simultaneously by two or more spacecraft around the ecliptic
spacecraft almost intersected the MC center, which provided plane. All of these missions will facilitate the studies of solar
an excellent opportunity to explore whether the composition is eruptions and other related issues.
uniform along the axis. We compared the ionic charge states of
carbon, oxygen, and iron (C6+/C5+, O7+/O6+, and ), as well
as the elemental abundances of iron and helium (Fe/O and He2+/ AUTHOR CONTRIBUTIONS
H+) along the two trajectories. The results showed that the
average values of C6+/C5+ exhibit significant difference along HS led the analysis and drafted the manuscript. QH contributed to
the axis, while the differences are relatively slight but still obvious further understand the GS reconstruction results in [53]. XC, JZ, LL,
for O7+/O6+, , Fe/O, and He2+/H+. Besides the means, the and AZ provided suggestions to improve the research. BW helped to
composition profiles within the MC measured by both spacecraft plot Figure 1. RZ and YC contributed to improve the manuscript.
also exhibit obvious discrepancies. We conclude that the
inhomogeneity of composition exists along the MC axis.
The magnetic field within the MC measured by Ulysses did not DATA AVAILABILITY STATEMENT
exhibit the obvious changing of direction compared with the
measurements of ACE, see Figures 2A, 3A. This might indicate The plasma and magnetic field data of both ACE and Ulysses are
that Ulysses passed through the ICME along a path a little far from publicly available at the ACE science center (http://www.srl.
the MC center than ACE. Figure 4A showed that Ulysses detected caltech.edu/ACE/ASC/level2/index.html) and the Ulysses Final
high C6+/C5+ at its central portion, which should also be observed Archive (http://ufa.esac.esa.int/ufa/), respectively.
by ACE if the composition is uniform along the MC axis. However,
the C6+/C5+ profile of ACE did not present the elevated center.
Therefore, if assuming there were some uncertainties about the FUNDING
spacecraft path in the GS reconstruction, it will not change our
conclusion about the axial inhomogeneity of MC composition. This work was supported by CAS grants XDA-17040507 and NSFC
The charge states of carbon, oxygen, and iron are frozen-in grants U2031109, 11790303 (No. 11790300), and No. 12073042. HS
sequentially in the corona, that is, the frozen-in altitudes of was also supported by the open research program of the CAS Key
carbon and iron are the lowest and highest, respectively, in Laboratory of Solar Activity, KLSA202107.
these three elements. For example, carbon is frozen-in below
1.5 solar radii [67, 68], while the iron around three to four solar
radii [69, 70]. Therefore, the obvious differences of C6+/C5+ along ACKNOWLEDGMENTS
the MC axis imply that the different portions of MFR along the
axis experience eruption processes with different physical The authors thank the referees for their constructive comments
parameters (e.g., temperature, density, and velocity) in the low and suggestions which helped improve the original manuscript
corona. The similar values of indicate that the physical considerably. The authors acknowledge the use of data provided
parameters along the axis approached in the high corona. These by ACE and Ulysses missions. HS thanks Dr Ying D. Liu for the
should be taken into account in 3D simulations of CMEs. The helpful discussions.
Frontiers in Physics | www.frontiersin.org 5 July 2021 | Volume 9 | Article 684345Song et al. Inhomogeneity of Composition
REFERENCES Destabilization of a Magnetic Flux Rope. ApJ (2013) 764:125. doi:10.1088/
0004-637X/764/2/125
23. Cheng X, Zhang J, Ding MD, Liu Y, and Poomvises W. The Driver of Coronal
1. Chen PF. Coronal Mass Ejections: Models and Their Observational Basis. Mass Ejections in the Low Corona: A Flux Rope. ApJ (2013) 763:43.
Living Rev Solar Phys (2011) 8:1. doi:10.12942/lrsp-2011-1 doi:10.1088/0004-637X/763/1/43
2. Webb DF, and Howard TA. Coronal Mass Ejections: Observations. Living Rev 24. Mikic Z, and Linker JA. Disruption of Coronal Magnetic Field Arcades. ApJ
Solar Phys (2012) 9:3. doi:10.12942/lrsp-2012-3 (1994) 430:898. doi:10.1086/174460
3. Cheng X, Guo Y, and Ding M. Origin and Structures of Solar Eruptions I: 25. Antiochos SK, DeVore CR, and Klimchuk JA. A Model for Solar Coronal Mass
Magnetic Flux Rope. Sci China Earth Sci (2017) 60:1383–407. doi:10.1007/ Ejections. ApJ (1999) 510:485–93. doi:10.1086/306563
s11430-017-9074-6 26. Song HQ, Zhang J, Chen Y, and Cheng X. Direct Observations of Magnetic
4. Guo Y, Cheng X, and Ding M. Origin and Structures of Solar Eruptions II: Flux Rope Formation during a Solar Coronal Mass Ejection. ApJ (2014) 792:
Magnetic Modeling. Sci China Earth Sci (2017) 60:1408–39. doi:10.1007/ L40. doi:10.1088/2041-8205/792/2/L40
s11430-017-9081-x 27. Ouyang Y, Yang K, and Chen PF. Is Flux Rope a Necessary Condition for the
5. Gosling JT, McComas DJ, Phillips JL, and Bame SJ. Geomagnetic Activity Progenitor of Coronal Mass Ejections?. Astrophys J (2015) 815:72. doi:10.1088/
Associated with Earth Passage of Interplanetary Shock Disturbances and 0004-637X/815/1/72
Coronal Mass Ejections. J Geophys Res (1991) 96:7831–9. doi:10.1029/ 28. Wang W, Liu R, Wang Y, Hu Q, Shen C, Jiang C, et al. Buildup of a Highly
91JA00316 Twisted Magnetic Flux Rope during a Solar Eruption. Nat Commun (2017) 8:
6. Zhang J, Richardson IG, Webb DF, Gopalswamy N, Huttunen E, and Kasper 1330. doi:10.1038/s41467-017-01207-x
JC. Solar and Interplanetary Sources of Major Geomagnetic Storms (DstSong et al. Inhomogeneity of Composition
45. Gopalswamy N. Properties of Interplanetary Coronal Mass Ejections. Space Sci 62. Du D, Zuo PB, and Zhang XX. Interplanetary Coronal Mass Ejections
Rev (2007) 124:145–68. doi:10.1007/s11214-006-9102-1 Observed by Ulysses through its Three Solar Orbits. Sol Phys (2010) 262:
46. Kim R-S, Gopalswamy N, Cho K-S, Moon Y-J, and Yashiro S. Propagation 171–90. doi:10.1007/s11207-009-9505-8
Characteristics of CMEs Associated with Magnetic Clouds and Ejecta. Sol Phys 63. Skoug RM, Feldman WC, Gosling JT, McComas DJ, Reisenfeld DB, Smith CW,
(2013) 284:77–88. doi:10.1007/s11207-013-0230-y et al. Radial Variation of Solar Wind Electrons inside a Magnetic Cloud Observed
47. Huang J, Liu Y, Feng H, Zhao A, Abidin ZZ, Shen Y, et al. A Statistical Study of at 1 and 5 AU. J Geophys Res (2000) 105:27269–75. doi:10.1029/2000JA000095
the Plasma and Composition Distribution inside Magnetic Clouds: 1998-2011. 64. Lepping RP, Jones JA, and Burlaga LF. Magnetic Field Structure of
ApJ (2020) 893:136. doi:10.3847/1538-4357/ab7a28 Interplanetary Magnetic Clouds at 1 AU. J Geophys Res (1990) 95:
48. Owens MJ. Solar Wind and Heavy Ion Properties of Interplanetary Coronal 11957–65. doi:10.1029/JA095iA08p11957
Mass Ejections. Sol Phys (2018) 293:122. doi:10.1007/s11207-018-1343-0 65. Lepri ST, Landi E, and Zurbuchen TH. Solar Wind Heavy Ions over Solar Cycle
49. Zurbuchen TH, Weberg M, von Steiger R, Mewaldt RA, Lepri ST, and 23:Ace/swics Measurements. ApJ (2013) 768:94. doi:10.1088/0004-637X/768/
Antiochos SK. Composition of Coronal Mass Ejections. ApJ (2016) 826:10. 1/94
doi:10.3847/0004-637X/826/1/10 66. Ruffenach A, Lavraud B, Owens MJ, Sauvaud J-A, Savani NP, Rouillard AP, et al.
50. Song H, Li L, Sun Y, Lv Q, Zheng R, and Chen Y. Solar Cycle Dependence of Multispacecraft Observation of Magnetic Cloud Erosion by Magnetic Reconnection
ICME Composition. arXiv:2106.03003 (2021). during Propagation. J Geophys Res (2012) 117:a. doi:10.1029/2012JA017624
51. Hu Q, and Sonnerup BUÖ. Reconstruction of Magnetic Clouds in the Solar 67. Chen Y, Esser R, and Hu Y. Formation of Minor-Ion Charge States in the Fast
Wind: Orientations and Configurations. J Geophys Res (2002) 107:1142. Solar Wind: Roles of Differential Flow Speeds of Ions of the Same Element. ApJ
doi:10.1029/2001JA000293 (2003) 582:467–74. doi:10.1086/344642
52. Hu Q. The Grad-Shafranov Reconstruction in Twenty Years: 1996-2016. Sci 68. Landi E, Gruesbeck JR, Lepri ST, Zurbuchen TH, and Fisk LA. Charge State
China Earth Sci (2017) 60:1466–94. doi:10.1007/s11430-016-9052-110.1007/ Evolution in the Solar Wind. II. Plasma Charge State Composition in the Inner
s11430-017-9067-2 Corona and Accelerating Fast Solar Wind. ApJ (2012) 761:48. doi:10.1088/
53. Du D, Wang C, and Hu Q. Propagation and Evolution of a Magnetic Cloud 0004-637X/761/1/48
from ACE to Ulysses. J Geophys Res (2007) 112:a. doi:10.1029/2007JA012482 69. Buergi A, and Geiss J. Helium and Minor Ions in the Corona and Solar Wind -
54. Smith CW, L’Heureux J, Ness NF, Acuña MH, Burlaga LF, and Scheifele J. The Dynamics and Charge States. Solar Phys (1986) 103:347–83. doi:10.1007/
ACE Magnetic Fields Experiment. Space Sci Rev (1998) 86:613–32. BF00147835
doi:10.1023/A:100509221666810.1007/978-94-011-4762-0_21 70. Boe B, Habbal S, Druckmüller M, Landi E, Kourkchi E, Ding A, et al. The First
55. Balogh A, Beek TJ, Forsyth RJ, Hedgecock PC, Marquedant RJ, Smith EJ, Empirical Determination of the Fe10+ and Fe13+ Freeze-In Distances in the
et al. The Magnetic Field Investigation on the ULYSSES mission - Solar Corona. ApJ (2018) 859:155. doi:10.3847/1538-4357/aabfb7
Instrumentation and Preliminary Scientific Results. Astron Astrophys 71. Müller D, Marsden RG, Marsden RG, St. Cyr OC, and Gilbert HR. Solar
Suppl (1992) 92:221–36. Orbiter. Sol Phys (2013) 285:25–70. doi:10.1007/s11207-012-0085-7
56. McComas DJ, Bame SJ, Barker P, Feldman WC, Phillips JL, Riley P, et al. Solar 72. Gan W, Yan Y, and Huang Y. Prospect for Space Solar Physics in 2016-2030.
Wind Electron Proton Alpha Monitor (SWEPAM) for the Advanced Scientia Sinica Physica, Mechanica & Astronomica (2019) 49:059602.
Composition Explorer. Space Sci Rev (1998) 86:563–612. doi:10.1023/A: doi:10.1360/SSPMA2018-00301
100504023259710.1007/978-94-011-4762-0_20 73. Lin J, Wang M, Tian H, Song H, Fu H, and Huang M. In Situmeasurements of
57. Bame SJ, McComas DJ, Barraclough BL, Phillips JL, Sofaly KJ, Chavez JC, et al. the Solar Eruption. Scientia Sinica Physica, Mechanica & Astronomica (2019)
The ULYSSES Solar Wind Plasma experiment. Astron Astrophys Suppl (1992) 49:059607. doi:10.1360/SSPMA2018-00308
92:237–65. 74. Wang Y, Ji H, Wang Y, Xia L, Shen C, Guo J, et al. Concept of the Solar Ring
58. Gloeckler G, Cain J, Ipavich FM, Tums EO, Bedini P, Fisk LA, et al. Investigation of mission: An Overview. Sci China Technol Sci (2020) 63:1699–713. doi:10.1007/
the Composition of Solar and Interstellar Matter Using Solar Wind and Pickup Ion s11431-020-1603-2
Measurements with SWICS and SWIMS on the ACE Spacecraft. Space Sci Rev
(1998) 86:497–539. doi:10.1023/A:100503613168910.1007/978-94-011-4762-0_18 Conflict of Interest: The authors declare that the research was conducted in the
59. Geiss J, Gloeckler G, Balsiger H, Fisk LA, Galvin AB, Gliem F, et al. Plasma absence of any commercial or financial relationships that could be construed as a
Composition in Jupiter’s Magnetosphere: Initial Results from the Solar Wind potential conflict of interest.
Ion Composition Spectrometer. Science (1992) 257:1535–9. doi:10.1126/
science.257.5076.1535 Copyright © 2021 Song, Hu, Cheng, Zhang, Li, Zhao, Wang, Zheng and Chen. This is
60. Cane HV, and Richardson IG. Interplanetary Coronal Mass Ejections in the an open-access article distributed under the terms of the Creative Commons
Near-Earth Solar Wind during 1996-2002. J Geophys Res (2003) 108:1156. Attribution License (CC BY). The use, distribution or reproduction in other
doi:10.1029/2002JA009817 forums is permitted, provided the original author(s) and the copyright owner(s)
61. Chi Y, Shen C, Wang Y, Xu M, Ye P, and Wang S. Statistical Study of the are credited and that the original publication in this journal is cited, in accordance
Interplanetary Coronal Mass Ejections from 1995 to 2015. Sol Phys (2016) 291: with accepted academic practice. No use, distribution or reproduction is permitted
2419–39. doi:10.1007/s11207-016-0971-5 which does not comply with these terms.
Frontiers in Physics | www.frontiersin.org 7 July 2021 | Volume 9 | Article 684345You can also read