How Transportation Restriction Shapes the Relationship Between Ambient Nitrogen Dioxide and COVID-19 Transmissibility: An Exploratory Analysis ...
←
→
Page content transcription
If your browser does not render page correctly, please read the page content below
BRIEF RESEARCH REPORT
                                                                                                                                                 published: 29 July 2021
                                                                                                                                       doi: 10.3389/fpubh.2021.697491

                                              How Transportation Restriction
                                              Shapes the Relationship Between
                                              Ambient Nitrogen Dioxide and
                                              COVID-19 Transmissibility: An
                                              Exploratory Analysis
                                              Lefei Han 1† , Shi Zhao 2,3† , Peihua Cao 4 , Marc K. C. Chong 2,3 , Jingxuan Wang 2 , Daihai He 5 ,
                                              Xiaobei Deng 6* and Jinjun Ran 6*
                                              1
                                               School of Global Health, Chinese Center for Tropical Diseases Research, Shanghai Jiao Tong University School of Medicine,
                                              Shanghai, China, 2 The Jockey Club (JC) School of Public Health and Primary Care, Chinese University of Hong Kong,
                                              Hong Kong, China, 3 The Chinese University of Hong Kong (CUHK) Shenzhen Research Institute, Shenzhen, China, 4 Clinical
                                              Research Center, Zhujiang Hospital, Southern Medical University, Guangzhou, China, 5 Department of Applied Mathematics,
                                              Hong Kong Polytechnic University, Hong Kong, China, 6 School of Public Health, Shanghai Jiao Tong University School of
                                              Medicine, Shanghai, China

                            Edited by:
                Kin Bong Hubert Lam,          Background: Several recent studies reported a positive (statistical) association between
 University of Oxford, United Kingdom
                                              ambient nitrogen dioxide (NO2 ) and COVID-19 transmissibility. However, considering
                     Reviewed by:
                       Simone Lolli,
                                              the intensive transportation restriction due to lockdown measures that would lead
National Research Council (CNR), Italy        to declines in both ambient NO2 concentration and COVID-19 spread, the crude or
                       M. A. Karim,
                                              insufficiently adjusted associations between NO2 and COVID-19 transmissibility might
           Kennesaw State University,
                      United States           be confounded. This study aimed to investigate whether transportation restriction
                  *Correspondence:            confounded, mediated, or modified the association between ambient NO2 and
                             Jinjun Ran       COVID-19 transmissibility.
                   jinjunr@sjtu.edu.cn
                          Xiaobei Deng        Methods: The time-varying reproduction number (Rt ) was calculated to quantify the
              dengxiaobei@sjtu.edu.cn
                                              instantaneous COVID-19 transmissibility in 31 Chinese cities from January 1, 2020, to
     † These authors have contributed         February 29, 2020. For each city, we evaluated the relationships between ambient NO2 ,
    equally to this work and share first
                                              transportation restriction, and COVID-19 transmission under three scenarios, including
                            authorship
                                              simple linear regression, mediation analysis, and adjusting transportation restriction as
                   Specialty section:         a confounder. The statistical significance (p-value < 0.05) of the three scenarios in 31
         This article was submitted to        cities was summarized.
 Environmental health and Exposome,
               a section of the journal       Results: We repeated the crude correlational analysis, and also found the significantly
             Frontiers in Public Health
                                              positive association between NO2 and COVID-19 transmissibility. We found that little
              Received: 20 April 2021
                                              evidence supported NO2 as a mediator between transportation restriction and COVID-
             Accepted: 28 June 2021
             Published: 29 July 2021          19 transmissibility. The association between NO2 and COVID-19 transmissibility appears
                             Citation:        less likely after adjusting the effects of transportation restriction.
  Han L, Zhao S, Cao P, Chong MKC,
    Wang J, He D, Deng X and Ran J
                                              Conclusions: Our findings suggest that the crude association between NO2
(2021) How Transportation Restriction         and COVID-19 transmissibility is likely confounded by the transportation restriction in
    Shapes the Relationship Between
                                              the early COVID-19 outbreak. After adjusting the confounders, the association between
        Ambient Nitrogen Dioxide and
        COVID-19 Transmissibility: An         NO2 and COVID-19 transmissibility appears unlikely. Further studies are warranted to
                 Exploratory Analysis.        validate the findings in other regions.
       Front. Public Health 9:697491.
    doi: 10.3389/fpubh.2021.697491            Keywords: COVID-19, nitrogen dioxide, reproduction number, transportation, China

Frontiers in Public Health | www.frontiersin.org                                    1                                              July 2021 | Volume 9 | Article 697491
Han et al. NO2 , Transportation, and COVID-19 Transmissibility
INTRODUCTION
Since the coronavirus disease 2019 (COVID-19) was first
reported in December 2019 in China, the cumulative cases
and death cases, as of May 2021, have been over 160
million and 3.4 million, respectively (1). In response to
the rapid transmission of COVID-19, many authorities
enforced lockdown measures regionally aiming to restrict
the social contact and limit the virus transmission to
reduce the morbidity and mortality caused by COVID-19
(2). In China, intensive non-pharmaceutical interventions,
including city lockdown measures, have been implemented
at both the provincial and city levels about three weeks
after the first cases were reported, i.e., by the end of
January 2020.
Recent evidence shows that the city lockdown measures,
especially for transportation restriction, have resulted in a
reduction in the levels of air pollution, including nitrogen
dioxide (NO2 ) (3–5). Ambient NO2 is mainly generated
from fossil fuels burning through automobile exhaust and
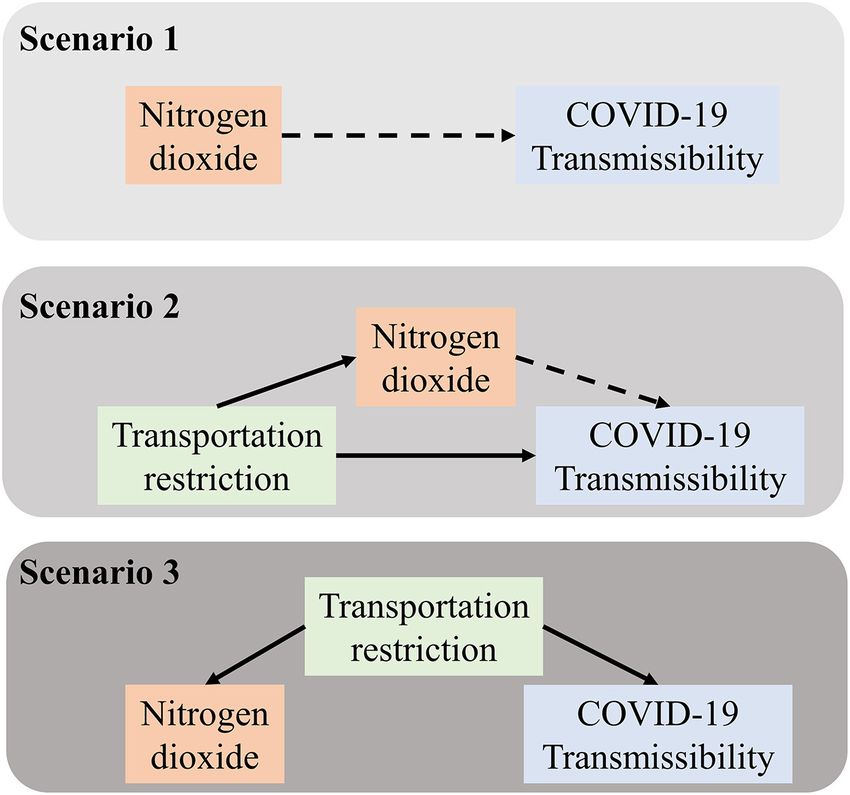
industrial emissions. Several studies indicate that NO2 positively FIGURE 1 | Directed acyclic graphs of Scenario 1, Scenario 2, and Scenario
associates with the COVID-19 transmissibility (6–9), though 3. Scenario 1 shows the possible association between NO2 and COVID-19
results were not always consistent (10, 11). An experimental transmissibility; Scenario 2 shows the direct association between
transportation restriction and COVID-19 transmissibility as well as the indirect
study found NO2 exposure increased the expression of
association mediated by NO2 ; and Scenario 3 shows that the possible
angiotensin-converting enzyme 2 (ACE2), which might lead to confounding of transportation restriction on the association between NO2 and
increased susceptibility to virus infections (12, 13). Exposing COVID-19 transmissibility.
to a higher concentration of NO2 also lead to respiratory
functionality damage, including decreased levels in lung
volume and expiratory flow (14). Given that the impact
of transportation restriction on ambient NO2 and COVID- COVID-19 Transmissibility
19 transmissibility have been well understood (15, 16), we We adopted the time-varying reproduction number (Rt ) to
speculate that the statistical association between ambient quantify the instantaneous COVID-19 transmissibility in each
NO2 and COVID-19 transmissibility obtained from previous Chinese city (17). Following the estimation framework developed
evidences may be undermined without considering the effect of in previous studies (17–19), the epidemic growth of COVID-
transportation restriction. 19 was modeled as a branching process, and thus, Rt can be
This study aimed to explore whether transportation expressed by using the renewable equation as follows:
restriction during the implementation of COVID-19 lockdown
C(t)
measures would modify the association between ambient NO2 R(t) = R ∞ ,
on COVID-19 transmissibility in different scenarios. 0 w k C t − k dk
where C(t) is the number of COVID-19 cases at the t-th date.
METHODS The function w(·) is the distribution of the generation time (GT)
of COVID-19. By averaging the GT estimates from the existing
Data literature (20–24), we considered w as the Gamma distribution
Daily counts of cumulative COVID-19 deaths for each
with a mean (±SD) value of 5.3 (±2.1) days. Slight variations in
Chinese city were obtained from the China National Health
the settings of the GT did not affect our main findings.
Commission and the Chinese provincial health agencies. Cities
with cumulative cases over 100 on February 5, 2020 were Statistical Analysis
included in our analysis. The study period was set from January We explored the role of ambient NO2 in affecting the R(t) with
1, 2020 to February 29, 2020. Daily mean concentrations three different scenarios. They included the following (Figure 1):
of NO2 during the same period were obtained from the Scenario 1: simple linear regression (naïve scenario); Scenario 2:
China National Environmental Center. Information on the mediation analysis; and Scenario 3: adjusting for confounding.
date and control measures of ‘the first-level response’, i.e.,
when the transportation restriction was implemented, was Scenario 1: Simple Linear Regression
collected from the government website or official media The associations between air pollutants and epidemiological
of each province. We set a time-varying binary variable outcomes at population scale are commonly explored by using
(i.e., 0 and 1) before and after the date of lockdown for regression models, which link the two terms directly in one
each city. formula with or without adjusting other common covariables
Frontiers in Public Health | www.frontiersin.org 2 July 2021 | Volume 9 | Article 697491Han et al. NO2 , Transportation, and COVID-19 Transmissibility
(25). The ambient NO2 is found positively associated with the bootstrapping sampling with 1,000 runs of the simulation. All
COVID-19 transmissibility in recent literature (6). As for a tests are one-sided. A p-value < 0.05 is considered as statistical
start-up, we repeatedly adopted the simple linear regression significance. We summarized the percentage distribution of all
models and reproduced the positive association between NO2 statistically significant p-values across all the 31 selected cities
and COVID-19 transmissibility using the dataset in this study. yielded from our models for comparison.
We attempted three schemes to quantify this association, All analyses were carried out using R statistical program
including: (i) univariate regression; (ii) multivariate regression language (version 3.6.0) (28).
with temperature and relative humidity adjusted (26); and (iii)
Pearson and Spearman ranked correlations. To be consistent with
previous findings, a positive and significant association between RESULTS
ambient NO2 and COVID-19 transmissibility was desired.
Of the 31 selected Chinese cities included in our analysis, 13
cities were from Hubei province and 18 cities from other regions.
Scenario 2: A Mediation Analysis
The date of lockdown intervention in the included cities was
In the hypothesized mediation framework, we considered
distributed from January 23, 2020 (e.g., Wuhan) to January 27,
transportation restriction, ambient NO2 , and COVID-19
2020 (e.g., Shenzhen). The ambient average concentration of
transmissibility as the independent variable, mediator, and the
NO2 ranged from 14.0 µg/m3 (Enshi) to 47.3 µg/m3 (Tianjin)
dependent variable, respectively. The assumption is based on
during the study period.
the well-studied evidence that (i) transportation restriction
The percentage distribution of p-values on the association
causes a reduction in ambient NO2 (3) and (ii) transportation
between NO2 and COVID-19 transmissibility by different
restriction may also reduce the transmissibility of COVID-19
measurements across the 31 selected cities are summarized
(15, 16). According to the mediation framework by the classic
in Table 1. In Scenario 1, 77.4–87.1% cities show that
requirements of Baron and Kennys (27), NO2 would be a
the relationship between NO2 and COVID-transmissibility
mediator to explain the relationship between transportation
reached statistical significance (p-value < 0.05) with regards to
restriction and COVID-19 transmissibility if the hypothesis
either Pearson, Spearman correlation coefficients or regression
yielded in Scenario 1 was true.
coefficients. In Scenario 2 where NO2 is treated as a
We examined the mediation effects by two measurements,
mediator between transportation restriction and COVID-19
which are as follows: (i) absolute mediation effect and (ii)
transmissibility, we find that the p-value of either absolute effect
proportional mediation effect. If there exists an association
or proportional effect lost statistical significance in most of the
between ambient NO2 and COVID-19 transmissibility, the direct
cities. In Scenario 3 where transportation restriction is treated
association between transportation restriction and COVID-19
as a confounder in the regression model, little evidence about
after considering ambient NO2 (indirect association) is expected
the association between NO2 and COVID-19 transmissibility
to reduce. Otherwise, the association yielded in Scenario 1 is
is observed.
suspicious and unlikely to imply causality, but merely reflects the
relationship caused by transportation restriction.
DISCUSSION
Scenario 3: Adjusting Transportation Restriction as A
Confounder This study evaluated the association between NO2 and COVID-
In the situation that the mediation effect is not of statistical 19 transmissibility with and without considering the impact
significance, we suspect that transportation restriction might of transportation restriction in the three different scenarios.
confound the relation yielded in Scenario 1. We adopted the two Our results did not support that NO2 was a mediator between
regression models to examine the adjusted association between transportation restriction and COVID-19 transmissibility. We
ambient NO2 and they are as follows: (i) multivariate regression did not observe that NO2 was independently associated with
with transportation restriction adjusted and (ii) multivariate COVID-19 transmissibility after adjusted for transportation
regression with transportation restriction, temperature, and restriction either.
relative humidity adjusted. Here, the adjusted association Our study adopted three hypothesis scenarios to evaluate the
indicates an impact on COVID-19 transmissibility that is solely association of NO2 and COVID-19 transmissibility by several
contributed by NO2 . statistical approaches in each scenario. The results were stable in
The three different analytical scenarios are nested both the analytic approaches and hypothesis framework. Instead
progressively. Specifically, the estimating outcomes in Scenario 1 of using the daily number of cases as the outcome, we adopted
serve as the presumption of the modeling framework in Scenario Rt to represent the disease transmissibility, which would avoid
2. The estimating outcomes in Scenario 2 may support the autocorrelation among cases and avoid over interpreting the
intuition of the formulation in Scenario 3. association between environmental factors and COVID-19 (29).
We conducted statistical analysis across 31 selected cities, Our result in Scenario 1 was consistent with the previous study
and obtained the city-level statistical significance (p-value) in in China (9). However, the statistical model used in the previous
three different scenarios. For regression models, p-values are study was limited to the control of population movement
calculated by using the Student’s t-test. For mediation analysis and transportation restriction due to the data availability. An
and non-parametric statistics, p-values are calculated by using ecological study in Milan, Italy showed NO2 was inversely
Frontiers in Public Health | www.frontiersin.org 3 July 2021 | Volume 9 | Article 697491Han et al. NO2 , Transportation, and COVID-19 Transmissibility
TABLE 1 | Summary of p-values of all N = 31 selected cities, and comparison of the percentage distribution of p-values by different measurements across the 31 cities.
Framework Measurement Covariable p-values (of N = 31 cities) Prop. of p-value < 0.05
adjustment (out of N = 31 cities)
First-quarter Median Third-quarter
Scenario 1 Correlation Pearson coefficient NAHan et al. NO2 , Transportation, and COVID-19 Transmissibility
REFERENCES 17. Cori A, Ferguson NM, Fraser C, Cauchemez S. A new framework
and software to estimate time-varying reproduction numbers during
1. WHO. WHO Coronavirus Disease (COVID-19) Dashboard. epidemics. Am J Epidemiol. (2013) 178:1505–12. doi: 10.1093/aje/
(2021) Available online at: https://covid19.who.int/?gclid= kwt133
CjwKCAiAgJWABhArEiwAmNVTB4_PyhXQd1-HwF- 18. Wallinga J, Teunis P. Different epidemic curves for severe acute respiratory
6SjgmJvn69WqhJemNkVTPYHGbNj_Gvv610yr_mRoCJF0QAvD_BwE. syndrome reveal similar impacts of control measures. Am J Epidemiol. (2004)
2. Pepe E, Bajardi P, Gauvin L, Privitera F, Lake B, Cattuto C, et 160:509–16. doi: 10.1093/aje/kwh255
al. COVID-19 outbreak response, a dataset to assess mobility 19. Pasetto D, Lemaitre JC, Bertuzzo E, Gatto M, Rinaldo A. Range
changes in Italy following national lockdown. Scientific Data. (2020) of reproduction number estimates for COVID-19 spread. Biochem
7:230. doi: 10.1038/s41597-020-00575-2 Biophys Res Commun. (2021) 538:253–8. doi: 10.1016/j.bbrc.2020.
3. Venter ZS, Aunan K, Chowdhury S, Lelieveld J. COVID-19 12.003
lockdowns cause global air pollution declines. PNAS. (2020) 20. Ferretti L, Wymant C, Kendall M, Zhao L, Nurtay A, Abeler-Dorner L, et
117:18984–90. doi: 10.1073/pnas.2006853117 al. Quantifying SARS-CoV-2 transmission suggests epidemic control with
4. Jain CD, Madhavan BL, Singh V, Prasad P, Sai Krishnaveni A, Ravi digital contact tracing. Science. (2020) 368:eabb6936. doi: 10.1126/science.ab
Kiran V, et al. Phase-wise analysis of the COVID-19 lockdown b6936
impact on aerosol, radiation and trace gases and associated 21. He X, Lau EHY, Wu P, Deng X, Wang J, Hao X, et al. Temporal dynamics in
chemistry in a tropical rural environment. Environ Res. (2020) viral shedding and transmissibility of COVID-19. Nat Med. (2020) 26:672–5.
194:110665. doi: 10.1016/j.envres.2020.110665 doi: 10.1038/s41591-020-0869-5
5. Hernández-Paniagua IY, Valdez SI, Almanza V, Rivera-Cárdenas C, Grutter 22. Zhao S. Estimating the time interval between transmission generations
M, Stremme W, et al. Impact of the COVID-19 lockdown on air quality when negative values occur in the serial interval data: using COVID-19
and resulting public health benefits in the mexico city metropolitan as an example. Math Biosci Eng. (2020) 17:3512–9. doi: 10.3934/mbe.20
area. Front Public Health. (2021) 9:642630. doi: 10.3389/fpubh.2021. 20198
642630 23. Zhao S, Gao DZ, Zhuang Z, Chong MKC, Cai YL, Ran JJ, et al.
6. Copat C, Cristaldi A, Fiore M, Grasso A, Zuccarello P, Signorelli Estimating the serial interval of the novel coronavirus disease (COVID-
SS, et al. The role of air pollution (PM and NO(2)) in COVID- 19): a statistical analysis using the public Data in Hong Kong from january
19 spread and lethality: a systematic review. Environ Res. (2020) 16 to february 15, 2020. Front Phys. (2020) 8:347. doi: 10.3389/fphy.2020.
191:110129. doi: 10.1016/j.envres.2020.110129 00347
7. Zhu Y, Xie J, Huang F, Cao L. Association between short-term exposure 24. Ma S, Zhang J, Zeng M, Yun Q, Guo W, Zheng Y, et al. Epidemiological
to air pollution and COVID-19 infection: evidence from China. parameters of COVID-19: case series study. J Med Internet Res. (2020)
Sci Total Environ. (2020) 727:138704. doi: 10.1016/j.scitotenv.2020. 22:e19994. doi: 10.2196/19994
138704 25. Villeneuve PJ, Goldberg MS. Methodological considerations
8. Ogen Y. Assessing nitrogen dioxide (NO2 ) levels as a for epidemiological studies of air pollution and the SARS and
contributing factor to coronavirus (COVID-19) fatality. Sci COVID-19 coronavirus outbreaks. Environ Health Perspect. (2020)
Total Environ. (2020) 726:138605. doi: 10.1016/j.scitotenv.2020. 128:95001. doi: 10.1289/ehp7411
138605 26. Ran J, Zhao S, Han L, Liao G, Wang K, Wang MH, et al. A re-
9. Yao Y, Pan J, Liu Z, Meng X, Wang W, Kan H, et al. Ambient analysis in exploring the association between temperature and COVID-19
nitrogen dioxide pollution and spreadability of COVID-19 in Chinese transmissibility: an ecological study with 154 Chinese cities. Eur Respir J.
cities. Ecotoxicol Environ Saf. (2021) 208:111421. doi: 10.1016/j.ecoenv.2020.1 (2020) 56:2001253. doi: 10.1183/13993003.01253-2020
11421 27. Baron RM, Kenny DA. The moderator-mediator variable distinction in social
10. Ran J, Zhao S, Han L, Peng Z, Wang MH, Qiu Y, et al. Initial psychological research: conceptual, strategic, and statistical considerations.
COVID-19 transmissibility and three gaseous air pollutants (NO2 , SO2 , J Pers Soc Psychol. (1986) 51:1173–82. doi: 10.1037//0022-3514.51.
and CO): a nationwide ecological study in China. Front Med. (2020) 6.1173
7:575839. doi: 10.3389/fmed.2020.575839 28. Computing R. R: A language and environment for statistical computing. R
11. Lolli S, Chen YC, Wang SH, Vivone G. Impact of meteorological Foundation for Statistical Computing: Vienna, Austria (2020) Available online
conditions and air pollution on COVID-19 pandemic transmission at: https://www.R-project.org/.
in Italy. Sci Rep. (2020) 10:16213. doi: 10.1038/s41598-020- 29. Zhao S. To avoid the noncausal association between environmental
73197-8 factor and COVID-19 when using aggregated data: simulation-
12. Huang L, Zhou L, Chen J, Chen K, Liu Y, Chen X, et al. based counterexamples for demonstration. Sci Total Environ. (2020)
Acute effects of air pollution on influenza-like illness in Nanjing, 748:141590. doi: 10.1016/j.scitotenv.2020.141590
China: A population-based study. Chemosphere. (2016) 147:180– 30. Zoran MA, Savastru RS, Savastru DM, Tautan MN. Assessing the relationship
7. doi: 10.1016/j.chemosphere.2015.12.082 between ground levels of ozone (O3 ) and nitrogen dioxide (NO2 )
13. Alifano M, Alifano P, Forgez P, Iannelli A. Renin-angiotensin with coronavirus (COVID-19) in Milan, Italy. Sci Total Environ. (2020)
system at the heart of COVID-19 pandemic. Biochimie. (2020) 740:140005. doi: 10.1016/j.scitotenv.2020.140005
174:30–3. doi: 10.1016/j.biochi.2020.04.008 31. Chen TM, Gokhale J, Shofer S, Kuschner WG. Outdoor air pollution:
14. Mölter A, Agius RM, de Vocht F, Lindley S, Gerrard W, Lowe L, nitrogen dioxide, sulfur dioxide, and carbon monoxide health effects.
et al. Long-term exposure to PM10 and NO2 in association with Am J Med Sci. (2007) 333:249–56. doi: 10.1097/MAJ.0b013e31803
lung volume and airway resistance in the MAAS birth cohort. b900f
Environ Health Perspect. (2013) 121:1232–8. doi: 10.1289/ehp. 32. Yuan Z, Xiao Y, Dai Z, Huang J, Zhang Z, Chen Y. Modelling the effects
1205961 of Wuhan’s lockdown during COVID-19, China. Bull World Health Organ.
15. Murano Y, Ueno R, Shi S, Kawashima T, Tanoue Y, Tanaka (2020) 98:484–94. doi: 10.2471/blt.20.254045
S, et al. Impact of domestic travel restrictions on transmission 33. Rocklöv J, Sjödin H. High population densities catalyse the spread of COVID-
of COVID-19 infection using public transportation network 19. J Travel Med. (2020) 27:taaa038. doi: 10.1093/jtm/taaa038
approach. Sci Rep. (2021) 11:3109. doi: 10.1038/s41598-021- 34. Diao Y, Kodera S, Anzai D, Gomez-Tames J, Rashed EA, Hirata A.
81806-3 Influence of population density, temperature, and absolute humidity
16. Chen Q, Pan S. Transport-related experiences in China in response on spread and decay durations of COVID-19: a comparative study of
to the Coronavirus (COVID-19). Transp Res Interdisc Perspec. (2020) scenarios in China, England, Germany, and Japan. One Health. (2021)
8:100246. doi: 10.1016/j.trip.2020.100246 12:100203. doi: 10.1016/j.onehlt.2020.100203
Frontiers in Public Health | www.frontiersin.org 5 July 2021 | Volume 9 | Article 697491Han et al. NO2 , Transportation, and COVID-19 Transmissibility
35. Ran J, Zhao S, Han L, Chong MKC, Qiu Y, Yang Y, et al. The Publisher’s Note: All claims expressed in this article are solely those of the authors
changing patterns of COVID-19 transmissibility during the social unrest and do not necessarily represent those of their affiliated organizations, or those of
in the United States: a nationwide ecological study with a before-and- the publisher, the editors and the reviewers. Any product that may be evaluated in
after comparison. One Health. (2021) 12:100201. doi: 10.1016/j.onehlt.2020.1 this article, or claim that may be made by its manufacturer, is not guaranteed or
00201
endorsed by the publisher.
Author Disclaimer: The funding agencies had no role in the design and conduct
of the study; collection, management, analysis, and interpretation of the data; Copyright © 2021 Han, Zhao, Cao, Chong, Wang, He, Deng and Ran. This is an
preparation, review, or approval of the manuscript; or decision to submit the open-access article distributed under the terms of the Creative Commons Attribution
manuscript for publication. License (CC BY). The use, distribution or reproduction in other forums is permitted,
provided the original author(s) and the copyright owner(s) are credited and that the
Conflict of Interest: The authors declare that the research was conducted in the original publication in this journal is cited, in accordance with accepted academic
absence of any commercial or financial relationships that could be construed as a practice. No use, distribution or reproduction is permitted which does not comply
potential conflict of interest. with these terms.
Frontiers in Public Health | www.frontiersin.org 6 July 2021 | Volume 9 | Article 697491You can also read