Species diversity and composition, and above-ground carbon of mangrove vegetation in Jor Bay, East Lombok, Indonesia
←
→
Page content transcription
If your browser does not render page correctly, please read the page content below
B IOD I V E R S I TA S ISSN: 1412-033X
Volume 22, Number 4, April 2021 E-ISSN: 2085-4722
Pages: 2066-2071 DOI: 10.13057/biodiv/d220455
Species diversity and composition, and above-ground carbon of
mangrove vegetation in Jor Bay, East Lombok, Indonesia
ZULHALIFAH1, ABDUL SYUKUR1,2,, DIDIK SANTOSO1,2, KARNAN2
1Graduate Program of Science Education. Universitas Mataram. Jl. Majapahit No. 62, Mataram 83126, West Nusa Tenggara, Indonesia
2Department of Science Education. Faculty of Teacher Training and Education, Universitas Mataram. Jl. Majapahit No. 62, Mataram 83126, West Nusa
Tenggara, Indonesia. Tel.: +62-370-623873, Fax.: +62-370-634918,email: syukurbiologi@unram.ac.id
Manuscript received: 16 February 2021. Revision accepted: 28 March 2021.
Abstract. Zulhalifah, Syukur A, Santoso D, Karnan. 2021. Species diversity and composition, and above-ground carbon of mangrove
vegetation in Jor Bay, East Lombok, Indonesia. Biodiversitas 22: 2066-2071. Mangroves play a very important role to mitigate global
warming. This study aimed to assess the species diversity and composition as well as the above-ground biomass and carbon content of
mangroves in Jor Bay (Teluk Jor), Lombok Island, Indonesia. A purposive sampling method was implemented using transects and
square plots as data collection techniques. The data was analyzed to reveal the frequency, density, dominance, above-ground biomass,
and carbon content. The results of this study found seven mangrove species, namely Avicennia marina, Ceriops tagal, Rhizophora
apiculata, Rhizophora stylosa, Sonneratia alba, Sonneratia caseolaris, and Lumnitzera racemosa. In general, Sonneratia alba was the
most important species in terms of frequency, density, and dominance followed by Rhizophora apiculata. In total, mangrove vegetation
in Jor Bay stored 697.45 ton C/ha, or equivalent to carbon monoxide uptake of 2559.63 CO 2/ ha. In accordance with species
composition, Sonneratia alba had the largest contribution to total carbon content with 453.76 tons C/ha), followed by Rhizophora
apiculata with 74.47 tons C/ha. These findings suggest that mangrove vegetation in Jor Bay stored large amount of carbon in the
form of above-ground biomass, implying the importance to preserve this area for carbon conservation.
Keywords: Conservation, content of carbon, mangrove species, mangroves
INTRODUCTION While mangrove forests have a crucial role in
mitigating climate change, the existing management and
Carbon emissions have been a major concern utilization are not necessarily resembling the efforts to
worldwide since their rapid increase in the atmosphere preserve their persistence (Iksan et al. 2019). For example,
which triggers global warming (Florides et al., 2009; in Indonesia, the rate of degradation and loss of mangrove
Hansen et al. 2013; Shakun et al. 2021). Global warming is forests is high, almost 50-60%, which is caused by
the condition of warmer climate of the earth compared to anthropogenic activities, such as logging, settlements,
the historical condition due to the accumulation of mining, salt ponds, fisheries, and other industrial projects
greenhouse gases, such as CO2 (around 50%), (Malik et al. 2015; Murdiyarso et al.2015; Ilman et al.2016;
chlorofluorocarbon (CFC, 25%), methane gas (10%), and Malik et al. 2017). These problems have caused the
other gases (Anderson et al. 2016; Kweku et al. 2017). management of mangroves for the conservation of coastal
Nonetheless, the impacts of global warming could be areas to become very complicated.
reduced through organic carbon sequestered from One parameter commonly used to assess the success in
photosynthesis and stored in woody biomass, such as mangrove management and conservation is the diversity of
mangrove forest tree stands (Estrada et al. 2014; Santos et fauna associated with mangrove species (Idrus et al.
al. 2017; Virgulino-Júnior et al. 2020). 2019a). An example from ecological aspect highlights the
Mangrove forests are among ecosystems with the presence of mangroves that have vital function in the
richest in carbon content globally (Alongi 2012), with most connectivity of the diversity of fish species associated with
of the carbon stored underground (Kristensen et al. 2008; seagrass (Syukur et al. 2021). In some cases, the
Mcleod et al. 2011). Several studies have presented the management and conservation of mangrove ecosystems
carbon cycle in mangrove forests and the primary would involve reforestation programs to ensure that the
production of synthesis, biomass, litter production, mangroves are in good condition and grow continuously,
decomposition, carbon emissions, and other variables from such as in Pasar Banggi, Rembang District, Indonesia
them (Bouillon et al. 2008; Breithaupt et al. 2012). (Saputro et al. 2019).
Mangroves can store more carbon than terrestrial forests In other instances, the success of mangrove
(Alemaheyu et al. 2014; Banuwa et al. 2019; Iksan et al. revegetation can be seen from social aspect through how
2019). Each mangrove species has a different capacity for local communities obtain livelihoods from the mangrove
storing carbon (Donato et al. 2011). ecosystem (Idrus et al. 2019a). While some indicators have
been explored to assess the sustainability of mangroveZULHALIFAH et al. – Species diversity, composition, and above-ground carbon of mangrove vegetation 2067
conservation as mentioned above, another indicator that for mangroves for tree, sapling, and seedling categories.
can be used is carbon content in mangrove species. Plot size 10 x 10 m for trees (height> 1.5 m), 5 x 5 m for
Studies on carbon content in mangrove species have saplings (height> 1.5 m), and 2 x 2 m for seedlings (height
been rarely conducted, moreover in a lesser-known region ≤ 1.5 m) (Figure 2) with 10 m spacing between squares. In
such as in Lesser Sunda Islands, including Lombok, each plot, all mangrove species were recorded and
Indonesia. Thus, this study aimed to assess the species identified along with the number of trees, saplings, and
diversity and composition as well as the above-ground seedlings. The circumference of the tree trunk was
biomass and carbon content of mangroves in Jor Bay measured at 1.3 m from the ground. The data was then
(Teluk Jor), Lombok Island. The results of this study can analyzed to calculate the frequency, density and area of
be a source of information for the management in the area, cover (dominance). An analysis of carbon content was then
especially as an ecological monitoring tool to support carried out by calculating the volume and biomass.
mangrove conservation programs.
MATERIALS AND METHODS
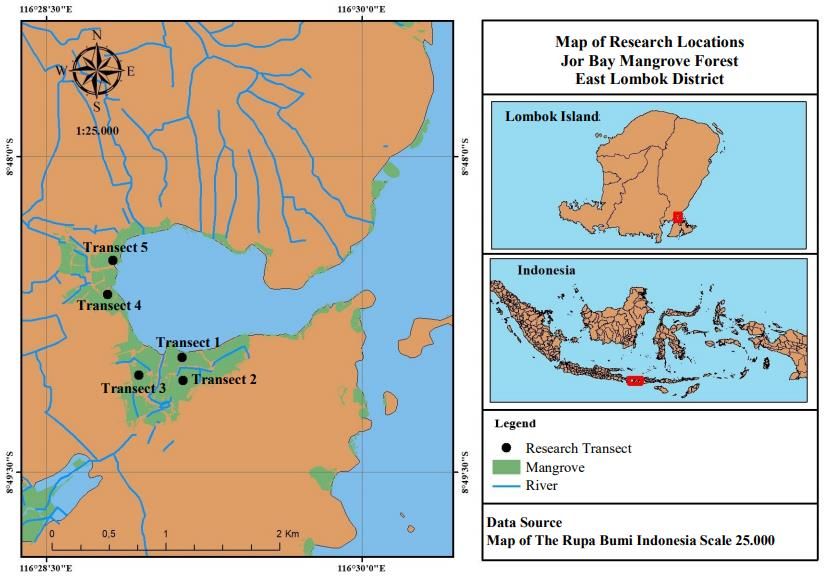
Study area and period
The study was conducted in Jor Bay (Teluk Jor), East
Lombok District, Lombok Island, Indonesia (Figure 1). Jor
Bay is located in the southeastern part of Lombok Island.
This research was conducted for five months, from January
to May 2020. The study location has an area of 61.52 ha
(Idrus et al. 2019b), which is a buffer zone of the
Mandalika Special Economic Zone on the southern coast of
Lombok Island.
Data collection and analysis
Data was collected using transect method. Five
locations were selected to establish a line transect with
length of 100 m perpendicular to the coastline (Figure 1). Figure 2. Mangrove plots
In each transect three sample plots (squares) were made so
that a total of fifteen plots were made. Plot sizes differed
Figure 1. Map of the study sites in Jor Bay, Lombok Island, Indonesia which consisted of five transects2068 B I OD I V E R S ITA S 22 (4): 2066-2071, April 2021
Frequency
Frequency is the intensity of finding a species in a Biomass = V x wood density
community or ecosystem. For the purposes of plant
community analysis, the Relative Frequency of a species Where: the wood density of Rhizophora = 0.92;
(FR-i) was used and calculated using the following formula Bruguiera = 0.91; Avicennia = 0.74; Sonneratia dan
(Alongi, 2012): Xylocarpus = 0.74; Ceriops = 0.85; Lumnitzera = 0.88;
(Alongi, 2012).
Then the carbon content was calculated following IPCC
(2003):
Density
Density is the number of individuals per unit area or Carbon content = biomass x 50%
unit volume. The density of the species can be calculated as
K-i and the relative density of each species to the total The calculation of carbon dioxide (CO2) absorption
density can be calculated as KR-i. The formula for used the formula:
calculating Relative Density of a species is as follow:
CO2 = Mr.CO/Ar. C x carbon content
Where:
CO2 : Carbondioxia uptake
Coverage area Mr : Relative molecule
The coverage area is the proportion between the area Ar : Relative atom
covered by plant species and the total habitat area. Relative
species closure is the ratio between the area of type i cover
and the total area covered for all species. The formula is as RESULTS AND DISCUSSION
follows:
Composition of mangrove species
The results of the study found seven natural mangrove
species apart from the mangrove vegetation species,
namely Avicennia marina, Ceriops tagal, Lumnitzera
The potential carbon content of mangrove species was racemosa, Rhizophora apiculata, Rhizophora stylosa,
determined using non-destructive sampling method Sonneratia alba and Sonneratia caseolaris (Table 1). The
prescribed by the IPCC (IPCC 2003). The volume of most dominant mangrove species was Sonneratia alba, as
mangrove was first calculated to produce biomass value, this species prefers muddy habitats and areas of high
which was then converted into carbon content. The volume salinity to achieve optimal growth (Idrus et al. 2019a).
was calculated using the following formula: Lumnitzera racemosa less dominated since this species has
low adaptability in the location. Hence, it can be assumed
V = 1/4. Π.d2.t.f that environmental conditions have a direct effect on the
growth and development of mangrove vegetation. Among
Where:
all transects, Transect III had the highest abundance of
V : volume of trees (m3)
mangrove species which is due to the location having a
Π : constant (3,14)
muddy substrate.
d : diameter at breast height
t : total height (m)
f : tree shape number (0,6)
Then the biomass was calculated as follow:
Table 1. The composition and abundance of mangrove species in Jor Bay, Lombok, Indonesia
Species Transect I Transect II Transect III Transect IV Transect V Total individuals
Avicennia marina - 10 10 - 4 24
Ceriops tagal - - 17 - 17 34
Lumnitzera racemosa - - 10 - - 10
Rhizophora apiculata 10 95 - 2 11 118
Rhizophora stylosa 22 - 13 - - 35
Sonneratia alba 39 10 116 45 22 232
Sonneratia caseolaris - - 22 - - 22ZULHALIFAH et al. – Species diversity, composition, and above-ground carbon of mangrove vegetation 2069
followed by the class of 1-5.5 cm with 80 individuals.
While classes of 20.6-25.5 cm, and 25.6-30.5 cm had only
three individuals. The mangrove density graph forms an
inverted but imperfect J curve. The high and low number of
individuals at specific diameter classes illustrates that the
forest experienced structural changes. These changes affect
the sustainability of the subsequent regeneration of forest
stands. The 5.6-10.5 cm diameter class was mostly found in
Jor Bay due to tree felling activities where people generally
used mangrove wood excessively, or this can be due to
uprooted by the wind (Din et al. 2008; Osti et al. 2009).
Other destructive activities included the conversion of
Figure 3. Number of mangrove individuals across diameter classes mangrove land into ponds and illegal logging in the area.
Other studies in the Regional Marine Protected Area in
Gili Sulat, East Lombok showed that mangrove vegetation
Table 2. Relative Frequency (FR), Relative Density (KR) and
Relative Dominance (DR) of trees of mangrove species in Jor
structure resembles an inverted J curve where the seedling
Bay, Lombok, Indonesia had the highest number of individuals while the trees had
the lowest (Setiawan and Mursidin 2018). Similarly,
Species FR (%) KR (%) DR (%)
mangrove stands on Tanakeke Island, South Sulawesi
showed that the number of trees decreases with the curve
Avicennia marina 5.26 2.38 3.31
resembled an inverted J; these characteristics indicate that
Ceriops tagal 5.26 2.38 1.90
Rhizophora apiculata 10.53 5.95 1.50
the forest is balanced (Suwardi et al. 2013). The availability
Rhizophora stylosa 5.26 2.38 1.86 of stands in community-managed forests will form a very
Sonneratia alba 68.42 83.33 87.51 high inverted J curve to guarantee the future (Ontorael et
Sonneratia caseolaris 5.26 3.57 3.93 al. 2012).
Total 100 100 100 The relative frequency, relative density, and relative
dominance of tree categories for each mangrove species are
different (Table 2). Sonneratia alba had the highest relative
Table 3. Relative Frequency (FR), Relative Density (KR) and frequency (68.42%), followed by the Rhizophora apiculata
Relative Dominance (DR) of saplings of mangrove species in Jor (10.53%), while the four other types were the lowest
Bay, Lombok, Indonesia
(5.26%). Similarly, the highest relative density value was
seen in Sonneratia alba (83.33%), followed by the
Species FR (%) KR (%) DR (%) Rhizophora apiculata (5.95%), and the lowest was three
Avicennia marina 6.90 4.20 7.16 other species (2.38%). Again, the Sonneratia alba had the
Ceriops tagal 6.90 8.74 5.41 highest relative dominance of tree (87.51%), followed by
Lumnitzera racemosa 3.45 3.50 1.02 Sonneratia caseolaris (3.93%), and the lowest was the
Rhizophora apiculata 27.59 26.57 25.76
Rhizophora apiculata (1.50%) (Table 2).
Rhizophora stylosa 10.35 3.50 3.56
Sonneratia alba 41.38 46.85 48.34 The highest value of relative frequency in the sapling
Sonneratia caseolaris 3.45 6.64 8.76 category was Sonneratia alba (41.38%), followed by
Total 100 100 100 Rhizophora apiculata (27.59%), and the lowest were two
other species (3.45%) (Table 3). Similarly, the highest
relative density was Sonneratia alba (46.85%), followed by
Table 4. Relative Frequency (FR), Relative Density (KR), and the Rhizophora apiculata (26.57%), and the lowest were
Relative Dominance (DR) of seedlings of mangrove species in Jor other two species (3.50%). Again, Sonneratia alba had the
Bay, Lombok, Indonesia highest value of relative dominance (48.34%), and
Rhizophora apiculata (25,76%) ranked second, and
Species FR (%) KR (%) Lumnitzera racemosa (1.02%) was the lowest.
Avicennia marina 5.56 10.00 The high relative frequency and relative density of
Ceriops tagal 5.56 2.00 Sonneratia alba at tree and sapling levels are due to the
Rhizophora apiculata 27.78 37.00 higher adaptability to environmental factors which support
Rhizophora stylosa 22.22 23.00 the optimal growth of this species compared to other
Sonneratia alba 38.89 28.00 species. The highest relative dominance of this species is
Total 100 100
also caused by their ability to obtain more nutrients to
ensure that the stem volume is large enough and the canopy
Diameter distribution is wide, resulting in its dominance over other types;
The density of mangroves varied across diameter additionally, it also prefers muddy substrates and tolerates
classes (Figure 2). Mangrove with diameter class of 5.6- high salt level (Ardiansyah et al. 2012; Nurdin et al. 2015;
10.5 cm had the highest density with 220 individuals, Urrego et al. 2014 ).2070 B I OD I V E R S ITA S 22 (4): 2066-2071, April 2021
Table 5. Volume, biomass, carbon content and CO2 uptake of mangrove vegetation in Jor Bay, Lombok, Indonesia
Species Volume Biomass Carbon content Absorption
(m3/ha) (ton/ha) (ton C/ha) CO2 (ton CO2 /ha)
Avicennia marina 2.45 36.72 18.36 67.38
Ceriops tagal 5.64 93.58 46.79 171.72
Lumnitzera racemosa 0.68 15.99 8.00 29.35
Rhizophora apiculata 7.52 148.92 74.47 273.30
Rhizophora stylosa 2.75 58.80 29.40 107.90
Sonneratia alba 66.49 907.52 453.76 1665.30
Sonneratia caseolaris 7.51 127.26 66.67 244.68
Total 93.04 1388.79 697.45 2559.63
At sapling level, Sonneratia alba had the highest Mangrove forests can mitigate climate change by absorbing
relative frequency (38.89%), followed by Rhizophora CO2 from the atmosphere and oceans at a much higher rate
apiculata (27.78%) (Table 4). However, the highest than terrestrial forests (Mcleod et al. 2011). Therefore,
relative density was Rhizophora apiculata (37%), while mangrove forests are one of the natural resources that must
Sonneratia alba ranked second. The highest relative be preserved to reduce the impact of climate change.
density of the seedling category of Sonneratia alba is likely In conclusion, mangrove forest resources have made
due to environmental factors that support the distribution of important contributions to the environment. One of them is
the seed compared to others. On the other hand, the highest as a carbon sink. The mangroves in Jor Bay consisted of
relative frequency of Rhizophora apiculata at seedling seven species (Sonneratia alba, Sonneratia caseolaris,
category is because they can survive better in the Rhizophora stylosa, Rhizophora apiculata, Ceriops tagal,
environment during the juvenile stage than other species Avicennia marina, and Lumnitzera racemosa). Sonneratia
(Abino et al. 2014; Mitra et al. 2011 ). alba was the most significant species in the studied area,
followed by the Rhizophora apiculata. The analysis of
Biomass and carbon content biomass and carbon content suggests that the mangrove
The results of the analysis of volume, biomass, carbon vegetation in Jor Bay has potential capacity in absorbing
content and carbon dioxide uptake are presented in Table 5. carbon dioxide.
Sonneratia alba had the highest volume (66.49 m3/ha) and
Lumnitzera racemosa was the lowest (0.68 m3/ha).
Similarly, Sonneratia alba had the highest biomass value ACKNOWLEDGEMENTS
(907.52 m3/ha), followed by Rhizophora apiculata (148.92
m3/ha), and Lumnitzera racemosa being the lowest (15.99 The authors thank the Rector of Mataram University,
m3/ha). Sonneratia alba had the highest biomass (907.52 Indonesia who helped provide laboratory facilities and
ton/ha) and carbon content due to its large trunk diameter research funding through the PNBP Mataram University
and tree height. So that the greater the tree biomass, the for the fiscal year of 2020. Z, AS, DS, and K conducted all
greater the carbon absorbed. Thus, the total carbon content experiments, participated in data analysis and wrote the
in aboveground vegetation in Teluk Jor is 697.45 ton C/ha manuscript.
(equivalent to 2559.63 CO2/ ha).
Biomass and carbon content in Teluk Jor is higher than
those in Bahowo, Bunaken District with biomass of 433.69 REFERENCES
ton/ha (equivalent to 748.07 ton of CO2/ha) (Bachmid et al.
2018) and in Kubu Raya, West Kalimantan with biomass of Abino AC, Castillo JAA, Lee YJ. 2014. Assessment of species diversity,
438.79 ton/ha (805.68 ton of CO2/ha) (Prakoso et al. 2017). biomass and carbon sequestration potential of a natural mangrove
stand in Samar, the Philippines. For Sci Technol 10 (1): 2-8. DOI:
Sonneratia alba had the highest tree density value than 10.1080/21580103.2013.814593.
other trees and, thus, had the highest potential carbon stock. Alemaheyu F, Richard O, James MK, Wasonga O. 2014. Assessment of
The higher the mangrove density, the greater the carbon mangroves covers change and biomass in Mide Creek, Kenya. J For 4
(4): 398-413. DOI: 10.4236/ojf.2014.44045.
content, where the stand density, stand composition and
Alongi DM. 2012. Carbon sequestration in mangrove forests. Carbon
structure, and the quality of the mangrove growth sites Manag 3 (3): 313-322. DOI: 10.4155/cmt.12.20.
affect the increase in biomass and carbon content of Alongi DM. 2020. Global significance of mangrove blue carbon in climate
mangrove trees. Mangroves’ ability to store carbon can change mitigation. Science 2 (3): 67. DOI: 10.3390/sci2030067
Anderson TR, Hawkins E, Jones PD. 2016. CO2, the greenhouse effect
reduce the rise in carbon emissions in nature (Alongi, 2020;
and global warming: from the pioneering work of Arrhenius and
Dinilhuda et al. 2018; Turner et al.2009; ). Mangroves per Callendar to today's Earth System Models. Endeavour 40 (3): 178-
hectare can store four times as much carbon as other 187. DOI: 10.1016/j.endeavour.2016.07.002
tropical forests worldwide. The mangrove vegetation in Bachmid F, Sondak C, Kusen J. 2018. Estimasi penyerapan karbon hutan
mangrove bahowo Kelurahan Tongkaina Kecamatan Bunaken. Jurnal
Teluk Jor can absorb carbon dioxide of 2559.63 CO2/ha, Pesisir dan Laut Tropis 6 (1): 8-13. DOI:
equivalent to the carbon dioxide emissions produced by the 10.35800/jplt.6.1.2018.19463. [Indonesian]
transportation of 241.46 ton CO2/ha (Iqbal et al. 2017). Banuwa IS, Utomo M, Yusnaini S, Riniarti M, Sanjaya P, Suroso E,
Hidayat, W. 2019. Estimation of the above-and below-ground carbonZULHALIFAH et al. – Species diversity, composition, and above-ground carbon of mangrove vegetation 2071
stocks in University of Lampung, Indonesia. Biodiversitas 20 (3): Reg Environ Change 17 (1): 157-169. DOI 10.1007/s10113-016-
676-681. DOI: 10.13057/biodiv/d200309 0989-0.
Bouillon S, Borges AV, Castañeda-Moya E, Diele K, Dittmar T, Duke Mcleod E, Chmura GL, Bouillon S, Salm R, Björk M, Duarte CM,
NC, Kristensen E, Lee SY, Marchand C, Middelburg JJ, Rivera- Silliman BR. 2011. A blueprint for blue carbon: Toward an improved
Monroy VH, Smith III TJ, Twilley RR. 2008. Mangrove production understanding of the role of vegetated coastal habitats in sequestering
and carbon sinks: A revision of global budget estimates. J Glob CO2. Front Ecol Environ 9 (10): 552-560. DOI: 10.1890/110004.
Biogeochem 22 (2): 1-12. DOI: 10.1029/2007GB003052. Mitra A, Sengupta K, Banerjee K. 2011. Standing biomass and carbon
Breithaupt JL, Smoak JM, Smith TJ, Sanders III CJ, Hoare A. 2012. storage of above-ground structures in dominant mangrove trees in the
Organic carbon burial rates in mangrove sediments: Strengthening the Sundarbans. For Ecol Manag 261 (7): 1325-1335.
global budget. Glob Biogeochem Cycle 26 (3): GB3011, DOI: doi:10.1016/j.foreco.2011.01.012.
10.1029/2012GB004375. Murdiyarso D, Purbopuspito J, Kauffman JB, Warren MW, Sasmito SD,
Din N, Saenger P, Jules PR, Siegfried DD, Basco F. 2008. Logging Donato DC, Manuri S, Krisnawati H, Taberima S, Kurnianto S. 2015.
activities in mangrove forests: A case study of Douala, Cameroon. The potential of Indonesian mangrove forests for global climate
Afr J Environ Sci Technol 2 (2): 22-030. hange mitigation. Nature Clim Ch 5 (12): 1089-1092.
Dinilhuda A, Akbar AA, Jumiati J. 2018. Peran ekosistem mangrove bagi Nurdin N, Akbar M, Patittingi F. 2015. Dynamic of mangrove cover
mitigasi pemanasan global. Jurnal Teknik Sipil 18 (2): 1-9. DOI: change with anthropogenic factors on small island, Spermonde
10.26418/jtsft.v18i2.31233. [Indonesian] Archipelago. Proc. SPIE 9638, Remote Sensing of the Ocean, Sea Ice,
Donato DC, Kauffman JB, Murdiyarso,D, Kurnianto S, Stidham M, Coastal Waters, and Large Water RegionsIn, Vol. 9638: 96380T.
Kanninen M. 2011. Mangroves among the most carbon-rich forests in DOI: 10.1117/12.2194645
the tropics. Nature Geosci 4 (5): 293-297. DOI: 10.1038/NGEO1123 Ontorael R, Wantasen AS, Rondonuwu AB. 2012. Kondisi ekologi dan
Estrada GCD, Soares MLG, Santos DMC, Fernandez V, Almeida PMM, pemanfaatan sumberdaya mangrove di Desa Tarohan Selatan
de Medeiros Estevam MR, Machado MRO. 2014. Allometric models Kecamatan Beo Selatan Kabupaten Kepulauan Talaud. Jurnal Ilmiah
for aboveground biomass estimation of the mangrove Avicennia PLATAX 1 (1): 07-11. DOI: 10.35800/jip.1.1.2012.492. [Indonesian]
schaueriana. Hydrobiologia 734 (1): 171-185. DOI: 10.1007/s10750- Osti R, Tanaka S, Tokioka T. 2009. The importance of mangrove forest in
014-1878-5. tsunami disaster mitigation. J Disasters 33 (2): 203-213. DOI:
Florides G A, Christodoulides P. 2009. Global warming and carbon 10.1111/j.1467-7717.2008.01070.x.
dioxide through sciences. Environ Intl 35 (2): 390-401. Prakoso TB, Afiati N, Suprapto D. 2017. Biomassa kandungan karbon dan
Hansen J, Kharecha P, Sato M, Masson-Delmotte V, Ackerman F, serapan CO2 pada tegakan mangrove di Kawasan Konservasi
Beerling DJ, Zachos JC. 2013. Assessing “dangerous climate Mangrove Bedoo, Demak. J Maquares 6 (2): 156-163. DOI:
change”: Required reduction of carbon emissions to protect young 10.14710/marj.v6i2.19824. [Indonesian]
people, future generations and nature. PloS One 8 (12): e0081648. Santos D, Estrada GC, Fernandez V, Estevam MR, Souza BT, Soares ML.
DOI: 10.1371/journal.pone.0081648 2017. First assessment of carbon stock in the belowground biomass of
Idrus AA, Syukur A, Zulkifli L. 2019. The diversity of fauna in mangrove Brazilian mangroves. J Anal Acad Bras Ciên 89 (3): 1579-1589. DOI:
community: Success replanting of mangroves species in south coastal 10.1590/0001-3765201720160496.
East Lombok, Indonesia. J Phys: Conf Ser 1402 (3): 033042. DOI: Saputro DA, Purwanti F, Rudiyanti S. 2019. Mangrove tourism conditions
10.1088/1742-6596/1402/3/033042. in Pasar Banggi Village, Rembang Regency. J Maquares 8 (3): 221-
Idrus AA, Syukur A, Zulkifli L. 2019b. The livelihoods of local 225. DOI: 10.14710/marj.v8i3.24259.
communities: Evidence success of mangrove conservation on the Setiawan H, Mursidin. 2018. Karakteristik ekologi dan kesehatan hutan
coast of East Lombok Indonesia. AIP Conf Proc 2199: 050010. DOI: mangrove di Pulau Tanakeke Sulawesi Selatan. Jurnal Penelitian
10.1063/1.5141308. Kehutanan Wallacea 7 (1): 47-58. DOI:
Iksan M, Al Zarliani WOD, La Nare S, Baena F. 2019. Biomass and 10.18330/jwallacea.2018.vol7iss1pp47-58. [Indonesian]
carbon uptake of mangrove forests Pohorua Village, Muna Regency. J Shakun JD, Clark PU, He F, Marcott SA, Mix, A C, Liu Z, Bard E. 2012.
Appl Biol 3 (2): 57-64. Global warming preceded by increasing carbon dioxide
Ilman M, Dargusch P, Dart P .2016. A historical analysis of the drivers of concentrations during the last deglaciation. Nature 484 (7392): 49-54.
loss and degradation of Indonesia’s mangroves’, Land Use Pol 54: DOI: 10.1038/nature10915.
448-459. DOI: 10.1016/j.landusepol.2016.03.010 Suwardi AB. 2013. Komposisi jenis dan cadangan karbon di hutan tropis
Intergovernmental Panel on Climate Change. 2003. IPPC Guidelines for dataran rendah Ulu Gandut Sumatera Barat. Jurnal Biologi 12 (2):
Nation Greenhouse Inventories: Reference Manual IPCC. IGES, 168-176. [Indonesian]
Japan. Syukur A, Idrus AA, Zulkifli L. 2021. Seagrass-associated fish species’
Iqbal M, Sasmita A, Andrio D. 2017. Prediksi emisi karbon dioksida dari richness: Evidence to support conservation along the south coast of
kegiatan transportasi di Kecamatan Bukit Raya Kota Pekanbaru. Lombok Island, Indonesia. Biodiversitas 22 (2): 988-998. DOI:
Jurnal Online Mahasiswa Fakultas Teknik Universitas Riau 4 (2): 1-3. 10.13057/biodiv/d220255.
[Indonesian] Turner W R, Oppenheimer M, Wilcove DS. 2009. A force to fight global
Kristensen E. Bouillon S. Dittmar T, Marchand C. 2008. Organic carbon warming. Nature 462: 278-279. DOI: 10.1038/462278a.
dynamics in mangrove ecosystems: A review. Aquat Bot 89 (2): 201- Urrego LE, Molina EC, Suárez JA. 2014. Environmental and
219. DOI: 10.1016/j.aquabot.2007.12.005 anthropogenic influences on the distribution, structure, and floristic
Kweku DW, Bismark O, Maxwell A, Desmond KA, Danso KB, Oti- composition of mangrove forests of the Gulf of Urabá (Colombian
Mensah EA, Adormaa BB. 2017. Greenhouse effect: greenhouse Caribbean). Aquat Bot 114: 42-49. DOI:
gases and their impact on global warming. J Sci Res Rep 17 (6): 10.1016/j.aquabot.2013.12.006
39630. DOI: 10.9734/JSRR/2017/39630 Virgulino-Júnior PCC, Carneiro DN, Nascimento Jr WR, Cougo MF,
Malik A, Fensholt R, Mertz O. 2015. Mangrove exploitation effects on Fernandes MEB. 2020. Biomass and carbon estimation for scrub
biodiversity and ecosystem services. Biodiv Conserv 24 (14): 3543- mangrove forests and examination of their allometric associated
3557. uncertainties. PloS One 15 (3): e0230008. DOI:
Malik A, Mertz O, Fensholt R. 2017. Mangrove forest decline: 10.1371/journal.pone.0230008.
consequences for livelihoods and environment in South Sulawesi.You can also read