Learning convolutional neural network
←
→
Page content transcription
If your browser does not render page correctly, please read the page content below
International Journal of Advanced Technology and Engineering Exploration, Vol 8(74)
                                                                         ISSN (Print): 2394-5443 ISSN (Online): 2394-7454
      Research Article
                                                                           http://dx.doi.org/10.19101/IJATEE.2020.S1762126

Comparison of deep learning convolutional neural network (CNN)
architectures for CT lung cancer classification
Sarah Mohd Ashhar1, Siti Salasiah Mokri1*, Ashrani Aizzuddin Abd Rahni1, Aqilah Baseri
Huddin1, Noraishikin Zulkarnain1, Nor Aniza Azmi2 and Thanuja Mahaletchumy3
Department of Electrical, Electronic and Systems Engineering, Faculty of Engineering & Built Environment,
Universiti Kebangsaan Malaysia, 43600, UKM Bangi, Selangor, Malaysia1
Center of Diagnostic, Therapeutic and Investigation Studies (CODTIS), Faculty of Health Science, Universiti
Kebangsaan Malaysia, Jalan Raja Muda Abdul Aziz, 50300, Kuala Lumpur, Malaysia 2
Center of Nuclear Imaging and Nuclear Medicine, UKM Medical Center, Jalan Ya'acob Latif, Bandar Tun Razak,
Cheras, 56000 Kuala Lumpur, Malaysia3

Received: 9-October-2020; Revised: 14-January-2021; Accepted: 18-January-2021
©2021 Sarah Mohd Ashhar et al. This is an open access article distributed under the Creative Commons Attribution (CC BY)
License, which permits unrestricted use, distribution, and reproduction in any medium, provided the original work is properly
cited.

  Abstract
  Lung cancer has become one of the most common deaths amongst the cancer patients. World Health Organisation states
  that lung cancer is the second most fatal cancer all over the world in 2014. Alarmingly, most of the lung cancer patients
  are diagnosed at the later stages where the cancer has spreads. Thus, early screening via Computed Tomography scan
  particularly among active smokers is encouraged. Manual diagnosis of the cancer is made feasible through the
  integration of Computer Aided Diagnosis system. For the past few years, deep learning method leads most of the artificial
  based intelligence applications including CAD systems. This paper aims to investigate the performance of five newly
  established Convolutional Neural Network architectures; GoogleNet, SqueezeNet, DenseNet, ShuffleNet and
  MobileNetV2 to classify lung tumours into malignant and benign categories using LIDC-IDRI datasets. Their
  performances are measured in terms of accuracy, sensitivity, specificity and area under the curve of the receiver
  operating characteristic curve. Experimental results show that GoogleNet is the best CNN architecture for CT lung
  tumour classification wih an accuracy of 94.53%, specificity 99.06%, sensitivity of 65.67% and AUC 86.84%.

  Keywords
  Computed tomography, Convolution neural network, Deep learning, Lung cancer.

1.Introduction                                                     Of these three, the non-invasive CT scan is the most
Lung cancer is the second most fatal cancer                        viable method to detect lung lesions. However, it is
worldwide and ranks at the eighth place in the overall             difficult to manually diagnosis small lesions in CT
reported deaths in Malaysia [1]. Almost 90% of lung                images with high accuracy especially when the
cancer patients are both active and passive smokers.               surroundings are unclear and noisy.
As early symptoms of lung cancer are commonly
unnoticeable, most of the diagnosis of these patients              To assist the physicians on cancer diagnosis,
are found out when they are at stage 3 or 4.                       computer aided detection and diagnostic (CAD)
Therefore, early screening is highly anticipated. Lung             system is used. Among the early applications of
cancer screening can be carried out through                        CADs are on the diagnosis and management of
computed tomography (CT) scan, sputum cytology                     breasts and thoracic cancers [3]. Of recent, the CAD
and biopsy [2].                                                    systems are mostly founded based on machine
                                                                   learning methods led by the deep learning method.
                                                                   The main downside of the conventional machine
*Author for correspondence                                         learning methods is the requirement for feature
This work was supported in part by the Center of Research and      extraction process. The process is omitted when
Instrumentation Management (CRIM), Universiti Kebangsaan           using deep learning. Although deep learning requires
Malaysia, Selangor, Malaysia and the Ministry of Education,
                                                                   heavy computing power and large datasets for
Malaysia (MOE) under Grant FRGS/1/2019/TK04/UKM/02/5
126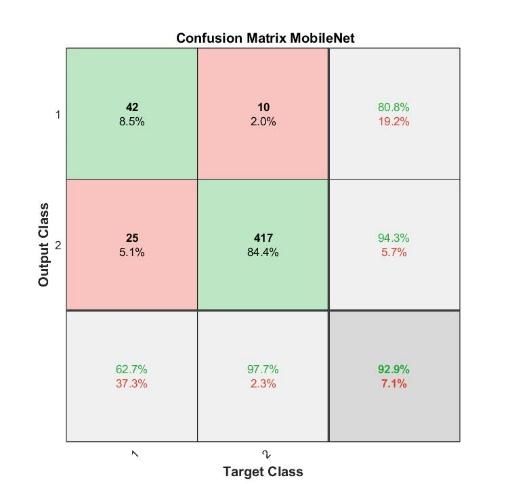
International Journal of Advanced Technology and Engineering Exploration, Vol 8(74)

training, the advancement of computational power,                learn features from CMixNet and together with U-
top notch graphic processing unit (GPU) and large                Net like encoder decoder architecture, nodule
open online database are constantly and readily                  detection is achieved. Classification of the lung
available in order to facilitate deep learning                   lesions takes place by learning the features through
implementation. Therefore, improved deep learning                gradient boosting machine (BGM) from the designed
neural networks can be created to stablish the best              3D CMixNet structure. Their proposed method
CAD system [4−6] to achieve an accurate cancer                   achieves an accuracy of 88.79%, specificity of
diagnosis, for instance in lung lesion diagnosis                 89.83% and sensitivity of 81.35%.
application via CT images.
                                                                 On the other hand, [8] proposed a hierarchical
Up till now, there are several deep learning                     semantic convolutional neural network (HSCNN) in
architectures have been proposed for lung lesion                 predicting the malignancy of CT scan pulmonary
classification. In lieu of this, this paper compares the         nodule. The architecture is based on two level output;
performance of five different deep learning                      one is low-level semantic features and another one is
architectures; GoogleNet, SqueezeNet, DenseNet,                  high level prediction of malignancy of nodule. The
ShuffleNet and MobileNetV2 in the application of                 architecture gives an accuracy of 88.9%, specificity
lung lesion classification into either malignant or              of 83.96% and 81.35%.
benign specifically in CT images.
                                                                 Compared three CNN architectures; namely Alexnet,
2.Literature review                                              VGG16 and their proposed architecture known as
There are several studies in the past literature that use        SilNet [9]. AlexNet is a very popular CNN
deep learning to classify the lung lesions in CT                 architecture for its simplicity whereby it has 5
images. Table 1 shows four recent studies for such               convolution layers and 3 fully connected layers.
application. Has compared three deep learning                    AlexNet has three convolution group which are the
architectures to classify the lung lesions into benign           kernel size of 11x11, 5x5 and 3x3. VGG16 is almost
and malignant [4]. They are convolutional neural                 like AlexNet but with the addition of 3x3 filter that
network (CNN), deep neural network (DNN) and                     replaces large kernel size filter on the AlexNet. It has
sparse auto encoder (SAE). Their study shows that                better accuracy than AlexNet. SilNet consists of a
CNN outperforms the rest of the architectures with               group of layers that makes up a group of
the highest accuracy of 84.15%, specificity of                   convolutions which are convolution layer, batch
83.96% and sensitivity of 84.32%.                                normalization layer, ReLu and pooling layer. This
                                                                 group of convolutions is used five times in the
Proposed a two deep 3D customized mixed link                     architecture.
network (CMixNet) architecture for detecting and
classifying lung nodule [7]. Faster R-CNN is used to

Table 1 Several studies on lung lesions classification using deep learning
Ref          Architecture                    Accuracy                Specificity                 Sensitivity
             CNN                             84.15                   83.96                       84.32
[4]          DNN                             82.37                   80.66                       83.90
             SAE                             82.37                   83.96                       81.35
[7]          CMixNet                         88.79                   89.83                       93.97
[8]          HSCNN                           84.20                   88.90                       70.50
             AlexNet                         79.50                   76.50                       83.04
[9]          VGG16                           97.50                   97.60                       98.26
             SilNet                          98.75                   99.40                       99.56

In addition, [10] proposed 15 layers CNN based                   It achieved an accuracy of 92.75%. Multiple dilated
architecture to classify long nodules into nodules               convolutions are used instead of max-poolings while
and nonnodules types, known as LdcNet. It has both               there is a specific network to capture the input
feature extraction layer of 3 convolutional blocks               features and to determine the suitable dilated
and classifier layer. They achieved a classification             convolution.
accuracy of 97.2%. Also applied their novel Gated-
Dilated (GD) network that is founded on CNN for                  In this paper, we aim to compare five CNN based
benign and malignant lung lesion classification [11].            deep learning architectures which are GoogleNet,
127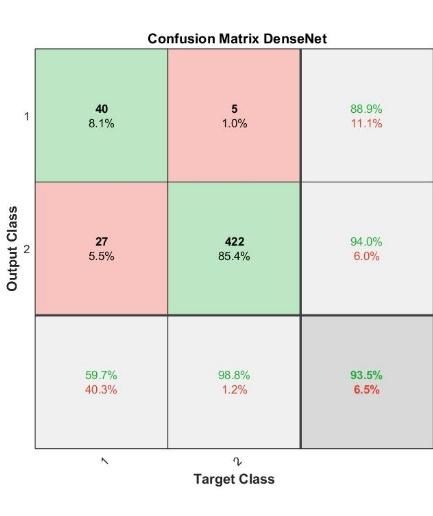
Sarah Mohd Ashhar et al.

SqueezeNet,       ShuffleNet,    DenseNet       and       back to a rendition in low dimension with a linear
MobileNetV2. GoogleNet [12] also known as                 convolution. This architecture is said to be memory
Inception-v1 is created by Google. This architecture      efficient.
introduces a module called inception module that
contains 1x1 convolution used to shrink the               3.Methodology
dimension to lessen the computational bottleneck.         The compared architectures are tested to classify lung
The module also assists in the expansion of the           lesions in CT images in which the datasets are taken
depth and the width of network.                           from the Lung Image Database Consortium image
                                                          collection (LIDC-IDRI) [17]. As many as 1646
SqueezeNet that is introduced by [13] has the             datasets are collected from this database that
advantage of having 50 times less parameters as           comprise of malignant and benign lesions. For each
compared to AlexNet. This architecture uses 1x1           dataset, 4 annotations done by the radiologists are
filter instead of 3x3 filter which makes it 9 times       recorded and the lesion is labelled into 5 categories:
smaller in parameters. It also has a module called fire   1. likely to be benign
module that contains a squeeze convolution layer          2. fairly likely to be benign
with 1x1 filter. This layer is inputted to the expand     3. intermediately likely to be benign and malignant
layer with both 1x1 and 3x3 convolution filters. To       4. fairly likely to be malignant
obtain high accuracy in classification, the               5. likely to be malignant.
downsampling is done later in the network so that the
activation map is large.                                  We extracted this information from the attached
                                                          extensible markup language (XML) file of the
ShuffleNet [14] is created by Megvii Inc. (Face++)        datasets and classify the data into malignant if the
that promotes the CNN to achieve not only high            average label value is more than 2.5 and vice versa.
accuracy but also high computational efficiency. It       From the collected data, 1423 malignant cases and
uses two components; pointwise group convolution          223 benign cases are obtained. These data then are
and channel shuffle to realize the computational          resized to 244x244 and are saved in PNG file. These
efficiency. The shuffle channel is where the feature      data are segregated into 70% training and 30%
map from the previous group is shuffled and feed to       testing. Figure 1 shows the example of two datasets
the different group of the next group convolution         after preprocessing.
layer. They also introduce ShuffleNet Unit where
pointwise group convolution is implemented before
the shuffle operation. To recover the dimension,
pointwise group convolution is added twice and 3x3
average pooling is added to increase the dimension of
the channel with an adequate computation cost.

DenseNet [15] forms a network that achieves high
accuracy with less parameters. This architecture
introduces a method in which every layer receives
input of feature map from all the previous layers.        Figure 1 Example of datasets of the CT lung lesions
Hence, this enables the future layer to have bits of      after pre-processing
information from each layer before it. DenseNet
creates a compact and slimmer network as the              MATLAB R2020a is used to train and test the deep
channel number can be reduced. Other than that, it        learning architectures in classifying the lung lesions.
utilizes    computational      cost    and     memory     Five architectures are tested and compared. They are
systematically. The last architecture is MobileNetV2      GoogLeNet, SqueezeNet, ShuffleNet, DenseNet and
[16] that is created by Google as an improvement of       MobileNetV2. These networks are trained using
the last MobileNetV1. This architecture introduces a      NVIDIA GTX-1060 6 GB GPU. Table 2 shows the
module called inverted residual structure. This           parameters used in the training process for each
module creates a shortcut which is put at the             architecture. The parameters are common for all
bottleneck layer. It is used as input of low dimension    architectures for comparable comparison purpose.
that has been compressed and filtered with simple
depthwise convolution. The feature is being casted

128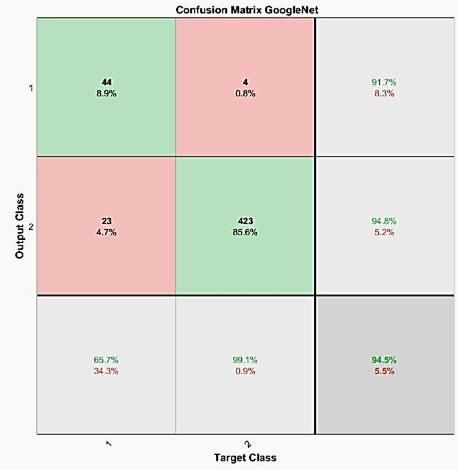
International Journal of Advanced Technology and Engineering Exploration, Vol 8(74)

Table 2 Training parameters
Parameters                                                                                Value
Initial learn rate                                                                        0.01
Validation frequency                                                                      50
Max Epochs                                                                                20
Mini batch size                                                                           64
Learn rate drop factor                                                                    0.2
Learn rate drop period                                                                    5
Momentum                                                                                  0.9

We evaluate the performance of the five networks                                                                        (2)
based on classification metrics such as accuracy,
specificity, sensitivity and area under the curve of the
                                                                    Sensitivity is the number of data correctly labelled as
receiver operating characteristic curve (AUC).
                                                                    positive over the whole positive data. It is calculated
Accuracy is the measurement of the correct data
                                                                    as:
predicted by the network divided by the whole data.
This can be calculated as below:                                                                                        (3)
(TP: True Positive, TN: True Negative; FP: False
positive; FN: False Negative                                        AUC is also being analyzed through the Receiver
                                                                    Operating Characteristics (ROC). This parameter is
                                                       (1)          used to analyze the performance of the network to
                                                                    classify the data into their respective classes. AUC of
                                                                    1 represents a perfect classification while 0 indicates
Specificity is the number of data correctly labelled as
                                                                    a definite classification failure. Figure 2 shows the
negative over the whole negative data. The formula is
                                                                    overall block diagram of the implemented
as stated:
                                                                    classification using the CNN based networks.

  LIDC-IDRI data retrieval, image preprocessing (resampling 2D 244x244); segregation into 70%
                                training data and 30% testing data

  CNN networks training (GoogleNet, SqueezeNet, ShuffleNet, DenseNet and MobileNetV2) on the
                                       training datasets

 Comparison and analysis of classification performance (accuracy, sensitivity, specificity, AUC) of
                               each network on the testing datasets

Figure 2 Block diagram of the classification method using deep learning networks

4.Result                                                            and sensitivity of 65.67%. GoogLeNet able to
Table 3 tabulates the performance of the networks in                perform the best in accordance to the way the
terms of accuracy, specificity, sensitivity and AUC                 architecture is designed that is to limit the
while Figure 3 shows the graphical comparison of                    computational bottleneck. Therefore, there is an ease
the performance for each network. GoogLeNet                         to run the architecture smoothly. The second best
architecture outperforms all the other architectures                performed architecture is SqueezeNet with an
with an accuracy of 94.53%, specificity of 99.06%                   accuracy of 94.13%, specificity of 99.06% and
                                                                    sensitivity of 62.69%. Both architectures implement a
129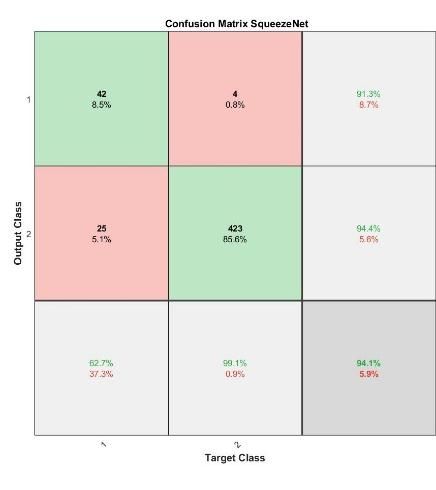
Sarah Mohd Ashhar et al.
1x1 filter in their novel modules. It shows that by area under the ROC curve (AUC) of 86.84%.
integrating 1x1 filter, it can improve the architecture DenseNet achieves AUC of 86.12%, followed by
performance as it lessens the burden of facing SqueezeNet (85.04%), ShuffleNet (82.34%) and
computational bottleneck. lastly MobileNetV2 (82.11%).
The next performed classifier is DenseNet with Figure 5 to Figure 9 show the confusion matrix for
accuracy of 93.52%, specificity of 89.83% and each architecture in the classification task. The
sensitivity of 59.7%. The propagation of input layer confusion matrix is used to recognise the correctly
to the subsequent layers proves to have beneficial labelled data to their respected classes and the
attributes as the front layers able to learn more incorrectly labelled data to their respected classes.
features and increasing its accuracy. However, the This subsequently be calculated in the form of
121 layers that it consists may not be suitable to be specificity and sensitivity.
used on a simple single GPU computer as it can slow
down the running time. ShuffleNet performance is The next simulation result is an example of
not well received compared to the rest as it tackles prediction by each architecture on a specific dataset.
the accuracy of 92.91%, specificity of 98.83% and In this case, the dataset is malignant. Figure 10 to
sensitivity of 55.22%. The last out of all the Figure 14 show the prediction made by each
architectures is MobileNetV2 with an accuracy of architecture together with the accuracy values. It is
92.91%, specificity of 97.65% and sensitivity of seen that GoogLeNet, SqueezeNet and DenseNet
62.64%. However, it still manages to achieve the predicted the data correctly while ShuffleNet and
accuracy of higher than 90%. This show that all the MobileNet missed the prediction. GoogleNet gives
architectures perform greatly with their novelty the highest prediction which is 0.99 while
modules that are designed for high accuracy while MobileNetV2 wrongly classifies the data into benign
maintaining a good number of parameters. with an accuracy of 0.72.
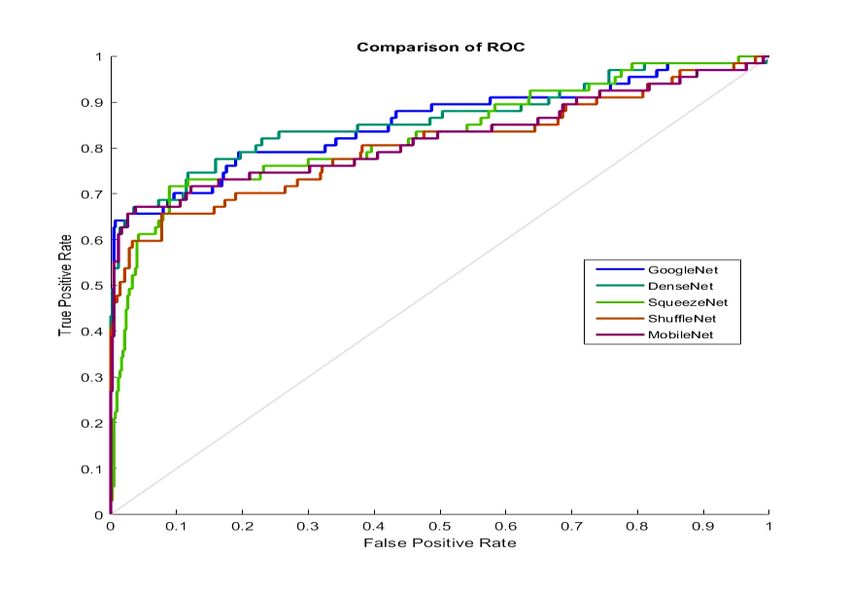
Figure 4 shows the ROC curve for each architecture.
Based on the ROC curves, GoogleNet has the highest
Table 3 Accuracy, specificity, sensitivity, AUC performance
Architecture Accuracy (%) Specificity (%) Sensitivity (%) AUC (%)
GoogleNet 94.53 99.06 65.67 86.84
SqueezeNet 94.13 99.06 62.69 85.04
ShuffleNet 92.91 98.83 55.22 82.34
DenseNet 93.52 98.83 59.7 86.12
MobileNetV2 92.91 97.65 62.64 82.11
Comparison of classification performance
Accuracy (%) Specificity (%) Sensitivity (%) AUC (%)
100
80
Percentage (%)
60
40
20
0
GoogleNet SqueezeNet ShuffleNet DenseNet MobileNetV2
CNN Network
Figure 3 Comparison of accuracy, specificity, sensitivity and AUC of each network
130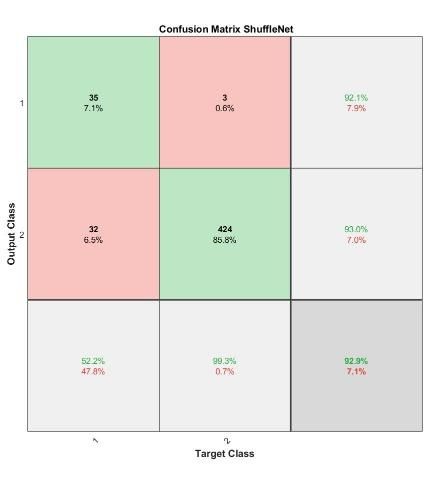
International Journal of Advanced Technology and Engineering Exploration, Vol 8(74)

Figure 4 Comparison of ROC curves between GoogleNet, DenseNet, SqueezeNet, ShuffleNet and MobileNet

Figure 5 GoogLeNet confusion matrix                         Figure 6 SqueezeNet confusion matrix

Figure 7 ShuffleNet confusion matrix                        Figure 8 DenseNet confusion matrix

131
Sarah Mohd Ashhar et al.

Figure 9 MobileNetV2 confusion matrix                           Figure 10 GoogLeNet prediction – malignant 0.99

Figure 11 SqueezeNet prediction -malignant 0.92              Figure 12 DenseNet prediction – malignant 0.95

Figure 13 ShuffleNet prediction – benign 0.65               Figure 14 MobileNet prediction – benign 0.72

In overall, it is observed that GoogLeNet architecture              lastly, MobileNetV2. Here, our results are only based
is the best deep learning classifier to classify the lung           on LIDC-IDRI database. However, the results are
lesions in CT images into benign or malignant lesions               reliable as LIDC-IDRI is the biggest online lung CT
followed by SqueezeNet, DenseNet, ShuffleNet and                    dataset available of all.
132
International Journal of Advanced Technology and Engineering Exploration, Vol 8(74)

5.Conclusion                                                         [8] Shen S, Han SX, Aberle DR, Bui AA, Hsu W. An
In this paper, the performance of five CNN                                interpretable deep hierarchical semantic convolutional
                                                                          neural network for lung nodule malignancy
architectures, namely GoogleNet, SqueezeNet,                              classification. Expert Systems with Applications.
DenseNet, ShuffleNet and MobileNetV2 to classify                          2019; 128:84-95.
the lung lesions in CT images into benign and                        [9] Abraham GK, Bhaskaran P, Jayanthi VS. Lung nodule
malignant lesions have been compared and analyzed.                        classification in CT images using convolutional neural
The experiment results show that the GoogleNet                            network. In 9th international conference on advances
architecture is the best deep learning classifier to                      in computing and communication 2019 (pp. 199-203).
classify the lung lesions in CT images into benign or                     IEEE.
malignant with an accuracy of 94.53%. The least                      [10] Tran GS, Nghiem TP, Nguyen VT, Luong CM, Burie
performed architecture of all is MobileNetV2 with an                      JC. Improving accuracy of lung nodule classification
                                                                          using deep learning with focal loss. Journal of
accuracy of 92.91%. Therefore, further study on the                       Healthcare Engineering. 2019: 1-9.
GoogleNet network is required in order to improve                    [11] Al-Shabi M, Lee HK, Tan M. Gated-dilated networks
the classification accuracy of lung lesions in CT                         for lung nodule classification in CT scans. IEEE
images.                                                                   Access. 2019; 7:178827-38.
                                                                     [12] Szegedy C, Liu W, Jia Y, Sermanet P, Reed S,
Acknowledgment                                                            Anguelov D, et al. Going deeper with convolutions. In
The authors would like to acknowledge the Center of                       proceedings of the IEEE conference on computer
Research and Instrumentation Management (CRIM),                           vision and pattern recognition 2015 (pp. 1-9).
Universiti Kebangsaan Malaysia, Selangor, Malaysia and               [13] Iandola FN, Han S, Moskewicz MW, Ashraf K, Dally
the Ministry of Education, Malaysia (MOE) for the                         WJ, Keutzer K. SqueezeNet: AlexNet-level accuracy
Fundamental Research Grant Scheme (FRGS) with project                     with 50x fewer parameters and< 0.5 MB model size.
code:    FRGS/1/2019/TK04/UKM/02/5 to support this                        arXiv preprint arXiv:1602.07360. 2016.
project.                                                             [14] Zhang X, Zhou X, Lin M, Sun J. Shufflenet: an
                                                                          extremely efficient convolutional neural network for
Conflicts of interest                                                     mobile devices. In proceedings of the IEEE
The authors have no conflicts of interest to declare.                     conference on computer vision and pattern recognition
                                                                          2018 (pp. 6848-56).
References                                                           [15] Huang G, Liu Z, Van Der Maaten L, Weinberger KQ.
[1] Kan Chan Siang MD, John CK. A review of lung                          Densely connected convolutional networks. In
    cancer research in Malaysia. Medical Journal of                       proceedings of the IEEE conference on computer
    Malaysia. 2016; 71(1):70-8.                                           vision and pattern recognition 2017 (pp. 2261-9).
[2] Rossi F, Mokri SS, Rahni AA. Development of a                    [16] Sandler M, Howard A, Zhu M, Zhmoginov A, Chen
    semi-automated combined PET and CT lung lesion                        LC. Mobilenetv2: inverted residuals and linear
    segmentation framework. In medical imaging                            bottlenecks. In proceedings of the IEEE conference on
    biomedical applications in molecular, structural, and                 computer vision and pattern recognition 2018 (pp.
    functional imaging 2017 (p. 101370B). International                   4510-20).
    Society for Optics and Photonics.                                [17] Armato III SG, McLennan G, Bidaut L, McNitt‐Gray
[3] Shukor MZ, Mokri SS. Comparison of segmentation                       MF, Meyer CR, Reeves AP, et al. The lung image
    techniques for nonsmall cell lung cancer (NSCLC) in                   database consortium (LIDC) and image database
    PET images. Solid State Technology. 2020;                             resource initiative (IDRI): a completed reference
    63(1s):958-66.                                                        database of lung nodules on CT scans. Medical
[4] Song Q, Zhao L, Luo X, Dou X. Using deep learning                     Physics. 2011; 38(2):915-31.
    for classification of lung nodules on computed
    tomography images. Journal of Healthcare                                           Sarah Mohd Ashhar is an Electronic
    Engineering. 2017:1-8.                                                             Engineering student at the Department
[5] Chan HP, Hadjiiski LM, Samala RK. Computer‐aided                                   of Electrical, Electronics and Systems
    diagnosis in the era of deep learning. Medical Physics.                            Engineering, Faculty of Engineering
    2020; 47(5): e218-27.                                                              and Built Environment, Universiti
[6] Lee JG, Jun S, Cho YW, Lee H, Kim GB, Seo JB, et                                   Kebangsaan Malaysia majoring in
    al. Deep learning in medical imaging: general                                      Computer       and      Communication
    overview. Korean Journal of Radiology. 2017;                                       Engineering from 2016 to 2020.
    18(4):570-84.                                                    Email: sarahashhar@gmail.com
[7] Nasrullah N, Sang J, Alam MS, Mateen M, Cai B, Hu
    H. Automated lung nodule detection and classification
    using deep learning combined with multiple strategies.
    Sensors. 2019; 19(17):1-19.

133
Sarah Mohd Ashhar et al.
Siti Salasiah Mokri is a Senior Noraishikin Zulkarnain is a Senior
Lecturer at the Department of Lecturer in the Department of
Electrical, Electronics and Systems Electrical, Electronic and Systems
Engineering, Faculty of Engineering Engineering, UKM Bangi, Malaysia.
and Built Environment, Universiti She is having 5 years experience in the
Kebangsaan Malaysia. She obtained teaching field. She received Bachelor of
Bachelor Degree in Electrical Engineering with honour (Electrical
Engineering from University of Malaya and Medical Electronics) degree from
in 2000, MSc in Mechatronics from International Islamic Universiti Teknologi Malaysia. Then, she got the
University Malaysia in 2008 and Phd in Biomedical opportunity to further her study in PhD with a fast track
Engineeing from University Putra Malaysia in 2016. Her programme. She received a PhD degree in Control Systems
research interests are Image Processing, Biomedical from Universiti Teknologi Malaysia in 2016. Her research
Images, Artificial Intelligence, Control System and area of interest is Control System, Image Processing and
Mechatronics. Medical Electronics Engineering.
Email: siti1950@ukm.edu.my Email: shikinzulkarnain@ukm.edu.my
Ashrani Aizuddin Abd. Rahni Nor Aniza Azmi is a Senior Lecturer at
received B.A and M.Eng degrees from the Faculty of Health Sciences,
the University of Cambridge and Ph.D. Universiti Kebangsaan Malaysia. She
from the University of Surrey, United received Bachelor of Diagnostic
Kingdom. He is a Senior Lecturer at Imaging & Radiotherapy from
Universiti Kebangsaan Malaysia Universiti Kebangsaan Malaysia in
(UKM) and a graduate member of the 2005, Master of Research in Health
Board of Engineers Malaysia and the Sciences, University of Liverpool in
IEEE. His research interest are Volumetric Medical Image 2008 and PhD in Health Sciences from Universiti
Computing and Image Guided Computer Aided Medical Teknologi Mara (UiTM) in 2018.
Diagnosis and Intervention. Email: noraniza.azmi@ukm.edu.my
Email: ashrani@ukm.edu.my
Dr Thanuja Mahaletchumy is a
Aqilah Baseri Huddin received her Nuclear Medicine Specialist and
BEng (Hons) in Electrical and currently heads the Department of
Electronics Engineering and her PhD in Molecular Imaging and Nuclear
Electrical and Electronics Engineering Medicine at Universiti Kebangsaan
from the University of Adelaide, Malaysia Medical Center. She obtained
Australia in 2007 and 2015, her medical degree from University
respectively. She is currently a Senior Malaysia Sarawak (UNIMAS) and
Lecturer in the Department of Master of Medicine (Nuclear Medicine) from Universiti
Electrical, Electronics and System Engineering in Sains Malaysia (USM). She is also a fellow of the Asian
Universiti Kebangsaan Malaysia, UKM. Her research Nuclear Medicine Board (ANMB). Her practice mainly
interests are mainly in the field of Image Processing and focuses on oncologic imaging (PET-CT and SPECT-CT).
Artificial Intelligence. Email: mthanu@msn.com
Email: aqilah@ukm.edu.my
134You can also read