CLASSIFYING DIABETIC RETINOPATHY IN RETINAL IMAGES UTILIZING GLCM AND EVOLUTIONARY PSO FEATURES - IJCEA
←
→
Page content transcription
If your browser does not render page correctly, please read the page content below

International Journal of Computer Engineering and Applications,
        Volume XII, Issue III, March 18, www.ijcea.com ISSN 2321-3469

CLASSIFYING DIABETIC RETINOPATHY IN RETINAL IMAGES
  UTILIZING GLCM AND EVOLUTIONARY PSO FEATURES
                                Dr. A. Anitha 1, Dr. T. Sridevi 2
         1
          Asst. Professor, Post Graduate Department of Computer Science and Applications
         2
          Asst. Professor, Post Graduate Department of Computer Science and Applications,
                         D.G Vaishnav College, Chennai, TamilNadu, India

ABSTRACT:
      Diabetic Retinopathy (DR) is an eye ailment which significantly affects the vision and if not
      diagnosed early, subsequently leads to blindness. Early diagnosis and treatment will be more
      valuable to refrain from loss of vision. In this work, methodology for screening of DR from
      colour retinal images using classifiers is proposed. Pre-processing of images is carried out to
      remove noise and substantially image is enhanced enabling better analysis of the image.
      Further texture features of the image are extracted using Gray level Co-Occurrence Matrix
      (GLCM). Optimal features from GLCM are selected using evolutionary Particle Swarm
      Optimization (PSO) algorithm. The optimal features selected are further classified using
      Naïve Bayes (NB), Multi-Layer Perceptron (MLP), Sequential Minimal Optimization (SMO)
      and Random Forest (RF) algorithms to evaluate the prediction accuracy of DR. Experimental
      results reveals that Random Forest has highest prediction than the other classifiers with the
      accuracy of 89.20%. The results have proven that the features selected using PSO
      outperforms than the original set of features. Classification accuracy shown by the classifiers
      proved that the prediction accuracy has significantly improved using the features selected by
      PSO.

 Keywords: Diabetic Retinopathy, PSO, Classification, GLCM, Feature Extraction

 [1] INTRODUCTION
       Diabetic eye disease encompasses variety of eye conditions diagnosed in patients
 affected by diabetic mellitus. Eye diseases aroused from diabetics have prospects to acute

                              Dr A. Anitha and Dr T. Sridevi                                     168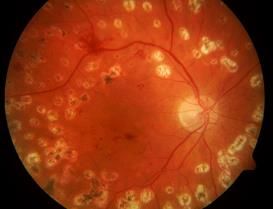
CLASSIFYING DIABETIC RETINOPATHY IN RETINAL IMAGES UTILIZING GLCM AND
                      EVOLUTIONARY PSO FEATURES

blindness and vision loss [1]. Diabetic Retinopathy (DR) is an eye ailment which causes
vision deterioration and blindness in varying population from adults to old aged people. DR
leads changes to blood vessels which cause hemorrhage and deformation in eyesight. The
prospects of grievous vision loss can be drastically reduced by early diagnosis and treatment.
Therefore timely investigation and systematic screening will be valuable in administering the
progress of DR [2]. Intuitive investigation of DR is necessary, since the proportion of people
affected by DR is significantly high. Automated diagnosis of DR is transpiring as
consequential growth in the area of image analysis by reducing the workload, time and cost
associated with manual grading.
      Fundus imaging contributes a predominant role in screening abnormalities that exists in
the retina for diabetes patients [3]. Eye fundus is more sensitive to vascular diseases hence
fundus imaging is considered as the best prospect for investigating DR [4]. The stages and
diversified aspects of DR can be analyzed with the colored retinal images obtained from
fundus imaging system. The first stage of DR is the existence of Microaneurysms identified
as small red dots which are small changes caused by local distensions in the retinal capillary.
Microaneurysms can cause intra retinal hemorrhage. Next stage is the Hard exudates, in
which yellow lipid formations are leaked from the blood vessels. Microinfarcts are formed
when the blood vessels get blocked which are called soft exudates. Final stage is known as
neovascularization which causes development of new fragile vessels due to lack of oxygen.
Neovascularization leads to loss of eyesight.
      [Figure-1] and [Figure-2] show the fundus retinal image of normal patient and retinal
image of patient affected with neovascularization stage of DR.

Figure: 1. Normal Fundus image without DR            Figure: 2. Abnormalities in the Fundus image
                                                                 with neovascularization.

      The image processing application tool can be utilized in screening early automatic
diagnosis of the DR which can prevent further eye ailments. Since DR patients necessitate
regular screening, automatic detection assists the specialist to reduce their manual effort and
prevents the loss of vision.

     The primary contribution of the work is to automatically predict the occurrence of DR
from the fundus images using machine learning strategies. In this paper, high-resolution
fundus images are pre-processed by removing noise from the image, which is further

                              Dr A. Anitha and Dr T. Sridevi                                   169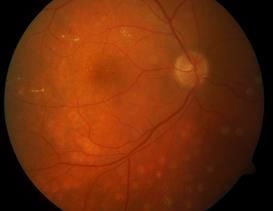
International Journal of Computer Engineering and Applications,
       Volume XII, Issue III, March 18, www.ijcea.com ISSN 2321-3469

processed using enhancement technique to highlight the specific details exist in the image.
Features in the image are extracted using feature extraction technique, which is further
reduced using feature selection technique. Finally, the image is fed into the classifier for
prediction of DR in the classification model built.

[2] MATERIALS AND METHODS

       This section concentrates on the proposed methodology for prediction of DR from the
input retinal image. The overall proposed methodology is elucidated in [Figure-3].

[2.1] Image Pre-Processing
         High resolution fundus images are hard to explicate/interpret, and a pre-processing of
the images is required to improve the quality of the image. Pre-processing is desired when the
pattern to be analyzed is noisy, incomplete and inconsistent. Pre-processing also takes
advantage of effectively classifying the input image. In this work, the input retinal color
image is converted into gray image enabling to process further. The gray image obtained is
resized in order to reduce the skewness that exists in the images acquired. Further, to remove
the noise from the input image, median filtering is applied in order to de-noise the salt and
pepper or impulsive noise from the fundus images. Median filter is a nonlinear spatial
filtering technique which significantly reduces random noise and preserves the edges [5, 6].

                                                     Pre – Processing

Input Image                   Convert RGB to Gray                   De-noise the image
                                                                    using Median Filter

                                                                     Contrast Limited
                                                                    Adapted Histogram
                                                                       Equalization
                                                                        (CLAHE)

                                 Resize the image

  Classification             Feature Selection using              Feature Extraction using
                                      PSO                                 GLCM

               Figure: 3. Proposed Methodology for DR prediction from retinal images

                             Dr A. Anitha and Dr T. Sridevi                                  170
CLASSIFYING DIABETIC RETINOPATHY IN RETINAL IMAGES UTILIZING GLCM AND
EVOLUTIONARY PSO FEATURES
The [Figure-4] shows the sample image with noise and the resultant image obtained
after application of median filter for de-noising random noise.
[2.2] Contrast Limited Adaptive Histogram Equalization (CLAHE)
CLAHE is a variation of Histogram Equalization technique for enhancing local contrast
and enhancing edges in each section of the image [7]. Adaptive Histogram Equalization
(AHE) technique generates series of histograms for each section and enhances by distributing
the lightness component in the image. CLAHE takes advantage over AHE by specifying clip
limit which restricts over noise amplification in the regions of image [8, 9]. CLAHE operates
on smaller sections of the image called ‘tiles’. Every tile is enhanced by improving the
contrast which contributes to the changes in histogram of output region in order to match
with the target histogram specified.
(a) (b)
(c) (d)
Figure: 4. (a) Color Retinal Image (b) Gray Retinal Image (c) Gray image with noise (d) De-noised image
using Median Filter
[Figure-5] shows the sample enhanced image obtained by improving local contrast
using CLAHE from de-noised image.
Dr A. Anitha and Dr T. Sridevi 171International Journal of Computer Engineering and Applications,
Volume XII, Issue III, March 18, www.ijcea.com ISSN 2321-3469
Figure: 5. Enhanced Image using CLAHE
[2.3] Feature Extraction
Feature Extraction is the detection of certain interesting features in the image and can
be represented for further processing [10]. Feature extraction retrieves the information
associated with shape of the pattern which is constructive in classifying the pattern. If the raw
input data is relatively large and redundant then the data is transformed into relevant features
by eliminating irrelevant information [11, 12]. The process of transforming into set of
features is known as Feature Extraction. It is the special category of dimensionality reduction
which effectively represents the features in the image as Feature Vector. These feature
vectors are used in classifying the input pattern with the desired output pattern [13, 14].
Texture is one of the important properties used in identifying a particular object. The texture
of an image can be represented in a matrix. The matrix is considered as a scheme for
representing texture image and the features are computed from the texture discrimination
matrix.
Gray level Co-Occurrence Matrix (GLCM) is used in this work for extracting texture
features of an image. GLCM is a statistical model consisting of set of co-occurrence matrices
and extracts second order statistical texture features [15, 16]. The GLCM has number of rows
and columns equal to the number of intensity levels L in the image. Each element M (r, s | ∆r,
∆s) denotes the relative frequency between two pixels with the specified distance (∆r, ∆s) in
the neighborhood considered [17, 18]. GLCM features extracted from the given input image
are, auto correlation, cluster prominence, cluster shade, contrast, correlation, difference
entropy, difference variance, dissimilarity, energy, entropy, homogeneity, information
measure of correlation1, information measure of correlation2, inverse Difference, maximum
Probability, sum Average, sum Entropy, sum of squares variance, sum variance. The sample
feature values extracted for the sample inputs are shown in [Table-1].
Sample Sample Sample Sample Sample
S.No GLCM Features
Image 1 Image 2 Image 3 Image 4 Image 5
1 Autocorrelation 7.0834 6.0713 4.5674 2.6042 6.9445
2 cluster Prominence 28.6075 24.3888 19.5800 10.0456 51.8759
3 cluster Shade -1.0250 0.9088 1.7644 1.8587 3.3494
4 Contrast 0.0360 0.0309 0.0405 0.0205 0.0373
5 Correlation 0.9812 0.9789 0.9609 0.9723 0.9819
Dr A. Anitha and Dr T. Sridevi 172CLASSIFYING DIABETIC RETINOPATHY IN RETINAL IMAGES UTILIZING GLCM AND
EVOLUTIONARY PSO FEATURES
6 Difference entropy 0.1551 0.1377 0.1695 0.0999 0.1592
7 Difference variance 0.0347 0.0299 0.0389 0.0201 0.0359
8 Dissimilarity 0.0360 0.0309 0.0405 0.0205 0.0373
9 Energy 0.2627 0.3047 0.3779 0.4550 0.2543
10 Entropy 1.4946 1.3893 1.2289 0.9535 1.5632
11 Homogeneity 0.9820 0.9846 0.9798 0.9898 0.9814
12 Information measure of correlation1 -0.8723 -0.8797 -0.8300 -0.8815 -0.8744
13 Information measure of correlation2 0.9492 0.9419 0.9083 0.8818 0.9549
14 Inverse difference 0.9820 0.9846 0.9798 0.9898 0.9814
15 Maximum probability 0.3763 0.3854 0.5431 0.5477 0.3351
16 Sum average 4.9570 4.6276 4.0345 2.9967 4.8718
17 Sum entropy 1.4696 1.3679 1.2008 0.9393 1.5373
18 Sum of squares variance 0.9586 0.7329 0.5184 0.3693 1.0296
19 Sum variance 3.7982 2.9009 2.0331 1.4569 4.0811
Table: 1. GLCM features for sample images
[2.4] Particle Swarm Optimization (PSO)
Feature Selection or attribute selection or variable selection is a process in a machine
learning strategy to select a subset of most irrelevant attributes by eliminating irrelevant and
redundant attributes [19]. Feature selection is enfolded in classification, aims in finding the
important feature as well as minimizes the effort of the classifier which leads to the accurate
classification [20]. In this work Particle Swarm Optimization (PSO) algorithm is used for
selecting relevant features from the extracted features of input image.
Particle Swarm Optimisation is an evolutionary computation technique inspired by
social behaviour proposed by Kennedy and Eberhart (Kennedy and Eberhart, 1995; Shi and
Eberhart, 1998). It is a metaheuristic technique. PSO finds solution to the optimization
problem using a lower level method [21].
PSO works on basics called swarm contemplated from the population of particles and
every swarm is a solution in the search space. Initially PSO assigns position randomly to the
particles in the swarm and each particle is iterated based on the occurrence of the particle and
its neighbour [22, 23]. It recognizes two best positions known as local best and global best.
Local best is the best position of the input particle considered and global best is the position
of all the particles in the solution space [24]. PSO takes advantage in obtaining optimal
solution, since each particle investigates various parts of the solution space.
[2.5] Classification
Classification of images analyses the numerical properties of feature values extracted
and systematically organizes into categories. Classification is an unsupervised machine
learning which is sequenced as a two-phase process namely, training phase and testing phase.
In the training phase, features of the image are identified based on their characteristics and a
decision label is assigned for every category. Classification model is built with the trained
Dr A. Anitha and Dr T. Sridevi 173International Journal of Computer Engineering and Applications,
Volume XII, Issue III, March 18, www.ijcea.com ISSN 2321-3469
features of the image. In testing phase, a new unlabeled test feature is assigned with the class
label by the classifier based on the training data.
In this paper, four classifiers are used for classifying the input images and their
prediction accuracy is evaluated. Naïve Bayes classifier (NB), Multi-Layer Perceptron
(MLP), Sequential Minimal Optimization (SMO) and Random Forest (RF) are used to
classify the extracted features from the input images.
[3] EXPERIMENTAL RESULTS AND DISCUSSIONS
Experiments analysis are carried out for the images acquired from open database
known as DIARETDB0 (Diabetic Retinopathy Database calibration level 0) for
benchmarking diabetic retinopathy from digital images [25]. The database comprises of 130
high resolution fundus color images captured with a 50 degree field-of-view digital fundus
camera. Out of 130 images captured, 20 are normal images without the signs of DR and 110
images are identified as DR (hard exudates, soft exudates, micronaneuyrysms, hemorrhages
and neovascularization). The proposed methodology is implemented using MATLAB
(R2017a).
The fundus color images obtained are converted to gray image and all the images are
resized to [512 512] in order to remove the skewness. Further the resized images are pre-
processed using median filter for de-noising the image. De-noised images are enhanced using
Contrast Limited Adaptive histogram Equalization (CLAHE) enabling better feature
extraction. GLCM is employed to extract the texture features of the image. GLCM extracts
19 features for the input images using co-occurrence matrix of the image. After feature
extraction, Particle Swarm Optimization (PSO) is used to reduce the features extracted by
eliminating irrelevant features.
In PSO, the initial parameters considered are, population value is 100 and 50, similarly
number of iterations chosen is 100 and number of selected features is 5. Setting these initial
values, PSO optimization algorithm is carried out for 10 runs to select the optimal feature
subset for classification from the extracted features. The results of the PSO algorithm for
population value 100 and 50 with the selected features are tabulated in [Table-2]. Based on
the runs of the PSO algorithm, 5 features are identified as optimal features from the 19
features extracted using GLCM. The optimal feature subset selected for the classification is
{3, 4, 7, 8 12}.
S.No Population Features Selected Population Features Selected
1 100 9 8 12 7 3 50 8 12 7 3 4
2 100 8 4 3 7 12 50 7 8 3 9 12
3 100 3 12 8 7 4 50 7 3 12 8 4
4 100 4 8 3 7 12 50 8 4 3 7 12
Dr A. Anitha and Dr T. Sridevi 174CLASSIFYING DIABETIC RETINOPATHY IN RETINAL IMAGES UTILIZING GLCM AND
EVOLUTIONARY PSO FEATURES
5 100 7 3 4 12 8 50 9 8 12 7 3
6 100 3 7 4 8 12 50 4 3 12 8 7
7 100 3 8 12 4 7 50 3 12 7 4 8
8 100 7 12 4 8 3 50 8 12 7 4 3
9 100 4 8 3 7 12 50 3 4 8 12 7
10 100 3 12 8 7 4 50 3 9 7 12 8
Table: 2. Runs of PSO algorithm (Iteration = 100)
The optimal subset of features selected using PSO is fed into the classifier for
evaluating the prediction accuracy. Four classifiers are used for evaluating the accuracy,
namely, Naive Bayes (NB), Multi-Layer Perceptron (MLP), Sequential Minimal
Optimization (SMO) and Random Forest (RF). The results of the classification accuracy of
the images are elucidated in [Table-3].
S.No Classifier Accuracy of the original Accuracy of proposed
dataset methodology
(%) (%)
1 NB 70.76 77.69
2 MLP 76.90 82.30
3 SMO 83.07 85.97
4 RF 77.69 89.20
Table: 3. Classification Accuracy of the Proposed Methodology
[Figure-6] demonstrates the classification accuracy exhibited by the various classifiers
considered.
Dr A. Anitha and Dr T. Sridevi 175International Journal of Computer Engineering and Applications,
Volume XII, Issue III, March 18, www.ijcea.com ISSN 2321-3469
90
80
70
Accuracy (%)
60
50 Accuracy of the original
40 dataset (%)
Accuracy of proposed
30
methodology (%)
20
10
0
NB MLP SMO RF
Classifier
Figure: 6. Performance Analysis of Proposed Methodology
[4] CONCLUSION
In this paper, images acquired from the databases DIARETDB0 (calibration level 0) are
diagnosed for automatic detection of DR. In this work, pre-processing is carried out using
median filter to reduce the noise, further; CLAHE is applied to enhance the image. Thereafter
features are extracted from enhanced image using GLCM. GLCM extracts 19 useful features
of the image which is further reduced to 5 features using evolutionary PSO. Finally, the
optimal features selected are classified using NB, MLP, SMO and RF. The results show that
all the classifiers have exhibited improved prediction accuracy than the original. With respect
to the classifiers considered, RF has shown a highest classification accuracy of 89.20% for
the dataset considered. The obtained results clearly shows that the proposed methodology
classifiers the DR effectively. Although the proposed methodology works effectively for the
dataset employed, it can be extended for high dimensional image dataset. Time complexity
associated with screening of DR can be reduced. Moreover post-processing methods can be
incorporated with the proposed methodology to improve performance further.
REFERENCES
[1] Akram, M. Usman, and Shoab A. Khan. "Multilayered thresholding-based blood vessel
segmentation for screening of diabetic retinopathy." Engineering with computers 29, no. 2
(2013): 165-173.
[2] Gulshan, Varun, Lily Peng, Marc Coram, Martin C. Stumpe, Derek Wu, Arunachalam
Narayanaswamy, Subhashini Venugopalan et al. "Development and validation of a deep
learning algorithm for detection of diabetic retinopathy in retinal fundus
photographs." Jama 316, no. 22 (2016): 2402-2410.
Dr A. Anitha and Dr T. Sridevi 176CLASSIFYING DIABETIC RETINOPATHY IN RETINAL IMAGES UTILIZING GLCM AND
EVOLUTIONARY PSO FEATURES
[3] Kayal, Diptoneel, and Sreeparna Banerjee. "A new dynamic thresholding based technique
for detection of hard exudates in digital retinal fundus image." In Signal Processing and
Integrated Networks (SPIN), 2014 International Conference on, pp. 141-144. IEEE, 2014.
[4] Qureshi, Rashid Jalal, Laszlo Kovacs, Balazs Harangi, Brigitta Nagy, Tunde Peto, and
Andras Hajdu. "Combining algorithms for automatic detection of optic disc and macula in
fundus images." Computer Vision and Image Understanding 116, no. 1 (2012): 138-145.
[5] Amel, Feroui, Messadi Mohammed, and Bessaid Abdelhafid. "Improvement of the hard
exudates detection method used for computer-aided diagnosis of diabetic
retinopathy." International Journal of Image, Graphics and Signal Processing 4, no. 4
(2012): 19.
[6] Popescu, Dan, Loretta Ichim, and Traian Caramihale. "Texture based method for automated
detection, localization and evaluation of the exudates in retinal images." In International
Conference on Neural Information Processing, pp. 463-472. Springer, Cham, 2015.
[7] Sopharak, Akara, Bunyarit Uyyanonvara, and Sarah Barman. "Simple hybrid method for
fine microaneurysm detection from non-dilated diabetic retinopathy retinal
images." Computerized Medical Imaging and Graphics 37, no. 5-6 (2013): 394-402.
[8] Saleh, Marwan D., and C. Eswaran. "An automated decision-support system for non-
proliferative diabetic retinopathy disease based on MAs and HAs detection." Computer
methods and programs in biomedicine 108, no. 1 (2012): 186-196.
[9] Bae, Jang Pyo, Kwang Gi Kim, Ho Chul Kang, Chang Bu Jeong, Kyu Hyung Park, and
Jeong-Min Hwang. "A study on hemorrhage detection using hybrid method in fundus
images." Journal of digital imaging 24, no. 3 (2011): 394-404.
[10] Nunes, Jean Claude, Yasmina Bouaoune, Eric Delechelle, Oumar Niang, and Ph Bunel.
"Image analysis by bidimensional empirical mode decomposition." Image and vision
computing 21, no. 12 (2003): 1019-1026.
[11] Tzanakou, Evangelia Miche, ed. Supervised and unsupervised pattern recognition: feature
extraction and computational intelligence. CRC Press, 2017.
[12] Romero, Adriana, Carlo Gatta, and Gustau Camps-Valls. "Unsupervised deep feature
extraction for remote sensing image classification." IEEE Transactions on Geoscience and
Remote Sensing 54, no. 3 (2016): 1349-1362.
[13] Cheng, Jie-Zhi, Dong Ni, Yi-Hong Chou, Jing Qin, Chui-Mei Tiu, Yeun-Chung Chang,
Chiun-Sheng Huang, Dinggang Shen, and Chung-Ming Chen. "Computer-aided diagnosis
with deep learning architecture: applications to breast lesions in US images and pulmonary
nodules in CT scans." Scientific reports 6 (2016): 24454.
[14] Huang, Xin, and Liangpei Zhang. "An SVM ensemble approach combining spectral,
structural, and semantic features for the classification of high-resolution remotely sensed
imagery." IEEE transactions on geoscience and remote sensing 51, no. 1 (2013): 257-272.
[15] Acharya, U. Rajendra, Eddie Yin-Kwee Ng, Jen-Hong Tan, S. Vinitha Sree, and Kwan-
Hoong Ng. "An integrated index for the identification of diabetic retinopathy stages using
texture parameters." Journal of medical systems 36, no. 3 (2012): 2011-2020.
[16] Welikala, R. A., Jamshid Dehmeshki, Andreas Hoppe, V. Tah, S. Mann, Thomas H.
Williamson, and S. A. Barman. "Automated detection of proliferative diabetic retinopathy
using a modified line operator and dual classification." Computer methods and programs in
biomedicine 114, no. 3 (2014): 247-261.
Dr A. Anitha and Dr T. Sridevi 177International Journal of Computer Engineering and Applications,
Volume XII, Issue III, March 18, www.ijcea.com ISSN 2321-3469
[17] Welikala, R. A., Muhammad Moazam Fraz, Jamshid Dehmeshki, Andreas Hoppe, V. Tah,
S. Mann, Thomas H. Williamson, and Sarah A. Barman. "Genetic algorithm based feature
selection combined with dual classification for the automated detection of proliferative
diabetic retinopathy." Computerized Medical Imaging and Graphics 43 (2015): 64-77.
[18] Xu, Xiayu, Wenxiang Ding, Michael D. Abràmoff, and Ruofan Cao. "An improved
arteriovenous classification method for the early diagnostics of various diseases in retinal
image." Computer methods and programs in biomedicine 141 (2017): 3-9.
[19] Zhang, Yingying, Desen Zhou, Siqin Chen, Shenghua Gao, and Yi Ma. "Single-image
crowd counting via multi-column convolutional neural network." In Proceedings of the
IEEE conference on computer vision and pattern recognition, pp. 589-597. 2016.
[20] Emary, Eid, Hossam M. Zawbaa, and Aboul Ella Hassanien. "Binary grey wolf
optimization approaches for feature selection." Neurocomputing 172 (2016): 371-381.
[21] Xue, Bing, Mengjie Zhang, Will N. Browne, and Xin Yao. "A survey on evolutionary
computation approaches to feature selection." IEEE Transactions on Evolutionary
Computation20, no. 4 (2016): 606-626.
[22] Janecek, Andreas, Wilfried Gansterer, Michael Demel, and Gerhard Ecker. "On the
relationship between feature selection and classification accuracy." In New Challenges for
Feature Selection in Data Mining and Knowledge Discovery, pp. 90-105. 2008.
[23] Chu, Carlton, Ai-Ling Hsu, Kun-Hsien Chou, Peter Bandettini, ChingPo Lin, and
Alzheimer's Disease Neuroimaging Initiative. "Does feature selection improve
classification accuracy? Impact of sample size and feature selection on classification using
anatomical magnetic resonance images." Neuroimage 60, no. 1 (2012): 59-70.
[24] Tang, Li, Meindert Niemeijer, Joseph M. Reinhardt, Mona K. Garvin, and Michael D.
Abràmoff. "Splat feature classification with application to retinal hemorrhage detection in
fundus images." IEEE Transactions on Medical Imaging 32, no. 2 (2013): 364-375.
[25] Kauppi, T., Kalesnykiene, V., Kamarainen, J. K., Lensu, L., Sorri, I., Uusitalo, H., ... &
Pietilä, J. (2006). DIARETDB0: Evaluation database and methodology for diabetic
retinopathy algorithms. Machine Vision and Pattern Recognition Research Group,
Lappeenranta University of Technology, Finland, 73.
Dr A. Anitha and Dr T. Sridevi 178You can also read