Change Point Detection in Knee Acoustic Emissions using the Teager Operator: A Preliminary Study in Patients with Juvenile Idiopathic Arthritis
←
→
Page content transcription
If your browser does not render page correctly, please read the page content below
Author Version - Presented at IEEE-EMBS INTERNATIONAL CONFERENCE ON BIOMEDICAL AND HEALTH INFORMATICS (BHI’19)

       Change Point Detection in Knee Acoustic Emissions using
      the Teager Operator: A Preliminary Study in Patients with
                    Juvenile Idiopathic Arthritis
               Beren Semiz                                                Sinan Hersek                                          Daniel C. Whittingslow
      Georgia Institute of Technology                            Georgia Institute of Technology                              Emory School of Medicine
           Atlanta, GA, USA.                                          Atlanta, GA, USA.                                           Atlanta, GA, USA.
           bsemiz@gatech.edu                                         shersek3@gatech.edu                                     d.c.whittingslow@emory.edu

               Lori Ponder                                             Sampath Prahalad                                              Omer T. Inan
         Emory School of Medicine                                   Emory School of Medicine                                Georgia Institute of Technology
            Atlanta, GA, USA.                                          Atlanta, GA, USA.                                         Atlanta, GA, USA.
           laponde@emory.edu                                          sprahal@emory.edu                                       omer.inan@ece.gatech.edu

       Abstract— Acoustic emission events (clicks) produced by the
   knee during movement have a variety of causes but can be
   classified as physiologic or pathologic. In this paper, we present a
   pilot study investigating detection and classification of physiologic
   and pathologic clicks in knee acoustic emissions from 4 subjects
   with juvenile idiopathic arthritis (JIA) and 4 control subjects.
   First, the signals are filtered and spectral noise suppression is
   applied. Then, the clicks are located using the Teager energy
   operator and are extracted from the main signals. Several time
   and frequency domain features are extracted from each click.
   Using a random forest classifier, the clicks are categorized as
   “physiologic” or “pathologic”. In our dataset, we found an
   accuracy, sensitivity and precision of 94.3%, 93.3% and 96.6%,
   respectively, in correctly attributing these clicks to their respective                Fig.1: (a) Time domain signal and corresponding spectrogram of a recording
   classes. Similarly, the area under the receiver operating                              taken from a control subject with physiological clicks. (b) Time domain signal
   characteristics (ROC) curve is calculated as 0.98. The proposed                        and corresponding spectrogram of a recording taken from a subject with JIA
   click detection and classification pipeline may be used as an
   objective guide for knee health assessment in future work.
       Keywords—Wearable Technologies, knee joint health, acoustics.                     underlying joint health. These sounds can be measured on the
                                                                                         surface of the skin and in the case of the knee likely originate
                             I.   INTRODUCTION                                           from friction between articulating surfaces [5]. These signals
                                                                                         are referred to as “vibroarthographic” signals in literature.
       Juvenile idiopathic arthritis (JIA) is the most common
                                                                                         Since Blodgett pioneered the use of these signals in 1902, many
   rheumatic condition of childhood, affecting more than 200,000
                                                                                         advances have been made in this field [6-8]. The development
   children in the United States [1]. The origin and pathogenesis
                                                                                         and application of piezoelectric accelerometers to joint sounds
   of JIA are still largely unknown. Joints affected with JIA
                                                                                         greatly advanced the field of vibroarthography [9, 10].
   undergo painful and progressive joint destruction. Early
                                                                                             Previously, we developed a hardware setup and signal
   detection and appropriate treatment of JIA are crucial for
                                                                                         analysis algorithm to assess knee-joint health [4]. The proposed
   preventing these long-term consequences. One of the most
                                                                                         algorithm was validated with the measurements taken from 4
   commonly affected joints in JIA is the knee joint [2, 3];
                                                                                         control subjects with no history of knee injury or pathology and
   however, there is not a quantitative scheme for assessing the
                                                                                         4 subjects diagnosed with JIA with affected knees. Several time
   disease state in affected knees conveniently and accurately.
                                                                                         and frequency domain features were extracted from the acoustic
       In previous work [4], we discussed the compelling need for
                                                                                         emission signals and fed into a soft classifier which is based on
   an unobtrusive, quantitative and affordable joint-health
                                                                                         gradient boosting trees. Using leave-one-subject-out cross-
   assessment method. We leveraged the use of the sounds that
                                                                                         validation (LOSO-CV), each subject was given a “knee audio
   joints make during movement to propose a biomarker of
                                                                                         score” ranging from 0 to 1, with 0 being a healthy knee and 1
     This material is based upon work supported in part by the Pediatric Technology      being an involved joint. Although the cross-validated accuracy
  Center (Georgia Tech and Children’s Healthcare of Atlanta), the Marcus
  Foundation, Inc., Atlanta, GA, the National Institutes of Health, National Institute   of the signal frames was high (92.3%), there remained an
  of Biomedical Imaging and Bioengineering, Grant No. 1R01EB023808, as part of           important observation and a potential drawback for the
  the NSF/NIH Smart and Connected Health Program, and the National Science               proposed algorithm. There were clicks that occurred in the
  Foundation CAREER Award, Grant No. 1749677.
                                                                                                                                                                      1

     For information on obtaining reprints of this article, please send e-mail to: reprints@ieee.org
     Copyright @ 2019 IEEE. Personal use is permitted, but republication/redistribution requires IEEE permission.
     See http://www.ieee.org/publications standards/publications/rights/index.html for more information.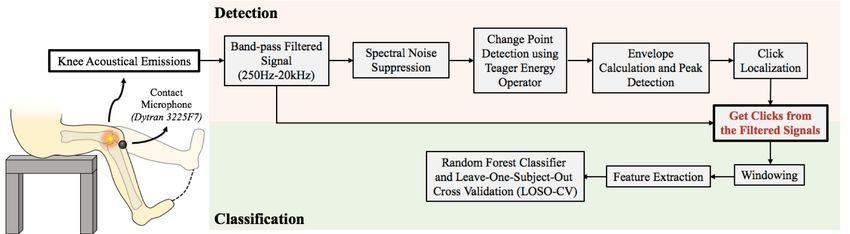
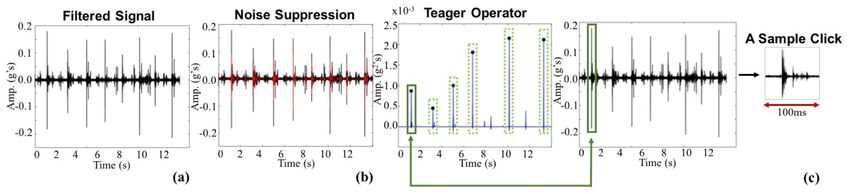
Fig.2: Detection and classification pipeline. Knee acoustic emissions are filtered, and spectral noise suppression is applied. Using the Teager energy operator,
 change points (in our case "clicks") are detected. Using these click locations, 100ms long click segments are extracted from the signals. Clicks are windowed,
 and time and frequency domain features are extracted from each window. Using the random forest classifier and LOSO-CV, the clicks are categorized as
 “physiologic” or “pathologic”.

healthy controls’ joint sounds (Fig. 1(a)) that appeared to                         to reduce interface noise. Sound artifacts at the beginning and
resemble the clicks seen in the joint sounds of patients with JIA                   end of the recordings are removed manually (Fig.3(a)). After
(Fig. 1(b)). The previously proposed algorithm did not focus on                     this preprocessing step, the spectral noise suppression
distinguishing the source of these clicks or classifying the clicks                 algorithm developed by Ephraim and Malah [12] is employed
as physiologic versus pathologic. These physiologic clicks may                      to reduce the background noise. Each recording is segmented
arise from bursting of bubbles in the synovial fluid, ligament                      with Hanning windows and the corresponding short time
snapping, or physiologic synovium catching. [11]. Although                          Fourier transform (STFT) is computed to calculate the signal
these physiologic clicks are generally not associated with joint                    spectral power. Assuming that the noise is stationary, the power
or synovium pathology, they still differ from the silent baseline                   spectrum of the noise is computed using the small silent
knee recordings in terms of their time and frequency domain                         portions of the recordings where no clicks are present. For each
characteristics. Therefore, to prevent any false positives during                   frame, a posteriori (ratio of the noisy speech spectrum and the
the analysis of joint sound recordings, these physiologic clicks                    noise spectrum) and a priori (ratio of the clean speech spectrum
should be detected precisely and be distinguished from the                          and the noise spectrum) signal-to-noise ratio (SNR) values are
pathologic clicks.                                                                  calculated using the decision-directed approach described in
    We hypothesize that these physiologic and pathologic clicks                     [12]. The signal gain is updated after each frame and this gain
have different characteristics and could be differentiated with an                  vector is used to clean the actual STFT. Finally, the noise-
automated system allowing for more precise classification of                        reduced signal is reconstructed using inverse STFT and
knee health status. This paper presents a novel algorithm to                        overlap-add methods (Fig.3(b)).
distinguish between these pathologic clicks and physiologic
                                                                                    C. Teager Energy Operator
clicks. First, the desired clicks are located and extracted from
the band-pass filtered signals using a detection pipeline (Fig.2).                     The Teager energy operator is a non-linear operator derived
These clicks are then classified as “physiologic” or                                from the energy of a simple oscillator using the physics of
“pathologic” using a random forest classification algorithm.                        motion. It represents the running estimate of the signal energy
                                                                                    by operating on three sequential samples of the signal at a given
                            II.   METHODS                                           time point [13]. In the discrete-time case, it is defined as:
A. Human Subject Protocol                                                                         Ψ !" # =$ #      %
                                                                                                                       −$ #+1 $ #−1                            (1)
    This study was conducted under a protocol approved by the
Georgia Institute of Technology and Emory University                                This operator is generally used to detect instantaneous changes
Institutional Review Boards. Knee acoustic emissions from 4                         in signals such as discontinuities, changes in signal amplitude
control subjects and 4 subjects with JIA were acquired as                           and/or changes in frequency. Additionally, it suppresses the
described in [4]. The recorded signals were analyzed using                          background activity and discards soft changes [14]. Knee
Matlab (MathWorks, Natick, MA) and Python (Python                                   acoustic emissions usually have high energy and short duration
Software Foundation, Beaverton, OR). In this paper, the                             [4, 8], therefore, the Teager operator appears to be well-suited
recordings from the control subjects are compared against the                       for detecting the instantaneous changes in these signals:
recordings taken from patients with JIA prior to starting                           specifically, the “clicks” in the recordings.
treatment. Post-treatment data is not included as the true nature
of the clicks (pathologic vs. physiologic) could not be certainly                   D. Click Detection
known at this point.                                                                    After computing the Teager energy operator, the locations
                                                                                    of these change points are stored for each recording using a
B. Pre-processing and Acoustic Noise Suppression                                    simple peak detection algorithm. First, the envelope of the
    The signals are pre-processed using a digital finite impulse                    Teager operator is generated, then the peaks which are greater
response (FIR) band-pass filter with a 250Hz-20kHz bandwidth                        than 20% of the range of the signal value are selected as the

                                                                                                                                                                    2
Fig.3: (a) The signals are filtered using a 250Hz-20kHz band-pass filter. (b) Spectral noise suppression is applied for background noise. (c) Using the Teager energy
operator, change point locations are detected. Using this information, 100ms long click segments are clipped from the band-pass filtered signals.

potential click locations. This threshold is selected heuristically                     In the current problem, each feature represents one
to include as many clicks as possible while ignoring small                           dimension. Using t-SNE, the 8 dimensional data (with each
fluctuations in the signal. Using these clicks locations, the                        dimension corresponding to one of the 8 features) is mapped
portions within click location ± 50ms are extracted from the                         onto 2 dimesional space for better visualization. After
main signals for each detected click. This 100ms window-                             dimensionality reduction, a scatter plot with two axes, where
length is selected to include the main click and its smaller,                        each point is respresenting a 10ms signal frame, is constructed.
subsequent clicks (Fig.3(c)). A total of 53 clicks (30 from the                      Two colors are used to categorically label the data points -
involved knee recordings and 23 from the control recordings)                         pathologic clicks in red and physiologic clicks in green.
are stored in matrix Y for further processing and classification.
                                                                                     G. Random Forest Classification
E. Feature Extraction                                                                    As previously explained, the clicks clipped from the filtered
    Each 100ms-long click in matrix Y is segmented into 10ms                         signals are windowed and 8 features are extracted from each
windows using 50% overlap to increase the number of instances                        frame. These features are stored in matrix X. The pathologic
for the classification algorithm. This resulted in 954 frames in                     signals and physiologic signals are given the labels 1 and 0,
total (18 frames from each click), and time and frequency                            respectively, and these labels are stored in 53x1 vector w.
domain features are extracted from each frame. The wide                              Random forest classification with 100 estimators and maximum
bandwidth (250Hz to 20kHz) of the joint sounds causes these                          depth value of 7 is employed to classify 954 frames from 53
signals to have distinctive spectral features, whereas the spike-                    physiologic or pathologic clicks. We chose random forest
like appearances in the time domain result in unique time                            classifier, since it can achieve high accuracy values without
domain features. Thus, 8 total features are extracted: 3 in the                      causing any overfitting. Random forests are sets of trees with
time domain and 5 in the frequency domain. In the time domain,                       the same distribution where each tree depends on the values of
the zero crossing rate, energy, and energy entropy are                               an independently sampled random vector [16]. After several
calculated. In the spectral domain, the spectral flux, spectral                      trees are generated, each tree casts a unit vote for the most
spread, spectral entropy, spectral roll-off, and spectral centroid                   popular class in the input data – in our case for “physiologic”
are calculated. The performance of these features and the                            and “pathologic” classes.
importance of having a diverse feature set in knee acoustic
emission analysis were previously discussed in [4]. These
features are stored under the 954x8 matrix X.
F. t-Distributed Stochastic Neighbor Embedding (t-SNE)
    To visualize the ability of our feature set to distinguish
between the physiologic and pathologic clicks, dimensionality
reduction using t-distributed stochastic neighbor embedding (t-
SNE) is applied. This dimensionality reduction approach
attempts to maintain the distances between points, which are
defined based on their probabilities of being neighboring
points, during mapping from high dimensional space to low
                                                                                      Fig.4: (a) t-SNE graph for the physiologic and pathologic clicks. (b) The
dimensional space. Let xi be a point in high dimensional space;                       ROC curve for the proposed model. The AUC is calculated to be 0.98.
so the conditional probability that xi chooses xj as its neighbor
is pi|j. Similary, this probabilty can be defined as qi|j in low                         The performance assessment is performed using leave-one
dimensional space. So t-SNE tries to minimize the mismatch                           subject-out cross validation (LOSO-CV). In each fold, all click
between pi|j and qi|j , and tries to find the best low-dimensional                   frames from one subject are left out, and the model is trained
representation for the current data. [15].                                           on the remaining click frames from 7 subjects. Then the model
                                                                                     is tested on the click frames of the subject being left out. This

                                                                                                                                                                   3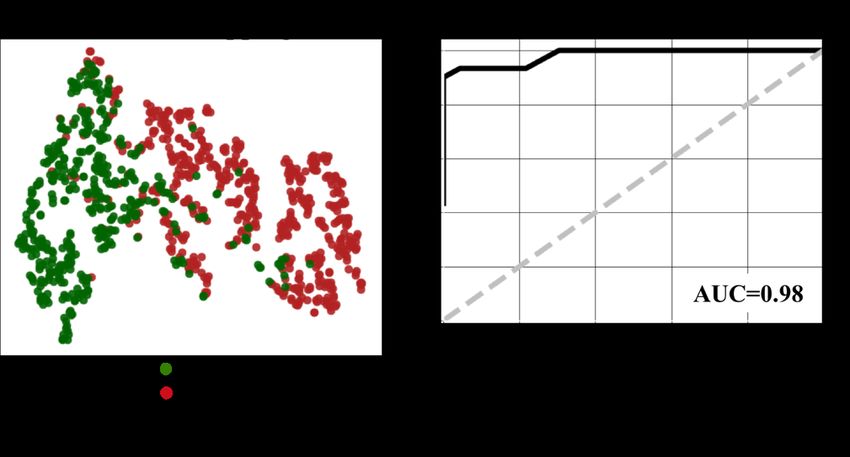
procedure is completed for all 8 subjects and the predicted                                    IV.   CONCLUSION
classes of the frames are stored in 53x18 matrix Z, where 53 is
                                                                         In this paper, we presented a new algorithm for detecting
the number of clicks and 18 is the number of frames belonging
                                                                     and classifying physiologic and pathologic clicks from the
to each click. These frame scores are then averaged to get the
                                                                     knees of subjects with JIA and healthy control subjects. An
final score of each click and stored in 53x1 vector h. The clicks
                                                                     automated algorithm such as the one presented in this paper can
are classified as “pathologic” if the calculated score is greater
                                                                     potentially be used to assist clinical decision making and
than 0.5, an as “physiologic” if less than 0.5. Finally using the
                                                                     provide knee-health tracking in wearable systems for home-
predicted scores in vector h and the actual classes in vector w,
                                                                     monitoring. In future studies, we will validate our findings with
the performance metrics (accuracy, sensitivity and precision)
                                                                     larger datasets and attempt not only supervised learning
are calculated and the corresponding receiver operating
                                                                     algorithms, but also unsupervised ones to ensure the
characteristics (ROC) curve is plotted.
                                                                     generalizability of our approach.
             III.   RESULTS AND DISCUSSION
                                                                                                   REFERENCES
A. t-Distributed Stochastic Neighbor Embedding (t-SNE)               [1]    C. G. Helmick, D. T. Felson, R. C. Lawrence, S. Gabriel, R. Hirsch, C.
                                                                            K. Kwoh, et al., "Estimates of the prevalence of arthritis and other
     The data from 4 subjects with JIA and 4 control subjects is            rheumatic conditions in the United States: Part I," Arthritis &
visualized as described in Section II-F. In Fig.4(a) the                    Rheumatism, vol. 58, pp. 15-25, 2008.
corresponding t-SNE graph for the physiologic (green dots) and       [2]    J. C. Packham and M. A. Hall, "Long-term follow-up of 246 adults with
pathologic (red dots) clicks is presented. The frames from these            juvenile idiopathic arthritis: functional outcome," Rheumatology
                                                                            (Oxford), vol. 41, pp. 1428-35, Dec 2002.
two click types construct separate clusters in two dimensional       [3]    A. D. Woolf and B. Pfleger, "Burden of major musculoskeletal
space based on their time and spectral domain features. This                conditions," Bull World Health Organ, vol. 81, pp. 646-56, 2003.
seperation supports the ability of our feature set to distinguish    [4]    B. Semiz, S. Hersek, D. C. Whittingslow, L. A. Ponder, S. Prahalad, and
between these two groups, and supports our hypothesis about                 O. T. Inan, "Using Knee Acoustical Emissions for Sensing Joint Health
                                                                            in Patients With Juvenile Idiopathic Arthritis: A Pilot Study," IEEE
these physiologic and pathologic clicks having different                    Sensors Journal, vol. 18, pp. 9128-9136, 2018.
characteristics. Physiologic clicks may be caused by cavitation      [5]    Y. Wu, Knee joint vibroarthrographic signal processing and analysis:
in the synovial fluid, ligaments snapping, etc. [11]. The causes            Springer, 2015.
of clicks in JIA are yet unknown, but are most likely attributed     [6]    W. E. Blodgett, "Auscultation of the knee joint," The Boston Medical
                                                                            and Surgical Journal, vol. 146, pp. 63-66, 1902.
to the chronic inflammatory state of the synovium and cartilage      [7]    A. Steindler, "Auscultation of joints," JBJS, vol. 19, pp. 121-136, 1937.
degradation [17-19]. Since these clicks have different origins,      [8]    M. L. Chu, I. A. Gradisar, M. R. Railey, and G. F. Bowling, "An electro-
it is reasonable that there would be differences in their time and          acoustical technique for the detection of knee joint noise," Med Res Eng,
frequency information.                                                      vol. 12, pp. 18-20, 1976.
                                                                     [9]    R. A. B. Mollan, "Vibration emission in bone and joints," Ph.D.
B. Random Forest Classification                                             Dissertation, Queen's University, 1981.
                                                                     [10]   D. A. Winter, Biomechanics and motor control of human movement:
    As explained in Section II-G, 53 physiologic and pathologic             John Wiley & Sons, 2009.
click frames are classified using random forest classifier and the   [11]   S. J. Song, C. H. Park, H. Liang, and S. J. Kim, "Noise around the Knee,"
model is validated using LOSO-CV. This led to cross validated               Clin Orthop Surg, vol. 10, pp. 1-8, Mar 2018.
                                                                     [12]   Y. Ephraim and D. Malah, "Speech enhancement using a minimum-
accuracy, sensitivity and precision of 94.3%, 93.3% and 96.6%,              mean square error short-time spectral amplitude estimator," IEEE
respectively. Similarly, the ROC curve is plotted (Fig.4(b)), and           Transactions on acoustics, speech, and signal processing, vol. 32, pp.
the corresponding area under curve (AUC) is calculated to be                1109-1121, 1984.
0.98. In biomedical applications, along with high accuracy, a        [13]   J. F. Kaiser, "On a simple algorithm to calculate the'energy'of a signal,"
                                                                            in Acoustics, Speech, and Signal Processing, 1990. ICASSP-90., 1990
high sensitivity value is preferred in the design of a screening            International Conference on, 1990, pp. 381-384.
test/technology, since this metric corresponds to the “detection     [14]   A. Erdamar, F. Duman, and S. Yetkin, "A wavelet and teager energy
rate” of the algorithm. In this study, we obtained a detection              operator based method for automatic detection of K-Complex in sleep
rate of 93.3%, which shows that this approach can detect and                EEG," Expert Systems with Applications, vol. 39, pp. 1284-1290, 2012.
                                                                     [15]   L. v. d. Maaten and G. Hinton, "Visualizing data using t-SNE," Journal
interpret the changes in joint sound signals. Thus, this algorithm          of machine learning research, vol. 9, pp. 2579-2605, 2008.
could potentially be used to track and evaluate the knee health      [16]   L. Breiman, "Random forests," Machine learning, vol. 45, pp. 5-32,
status of both healthy and diseased knees. In the future, this              2001.
click-scoring pipeline could be extended beyond JIA to assist        [17]   S. Nalband, A. Sundar, A. A. Prince, and A. Agarwal, "Feature selection
                                                                            and classification methodology for the detection of knee-joint disorders,"
in rehabilitation and recovery following musculoskeletal                    Computer methods and programs in biomedicine, vol. 127, pp. 94-104,
injuries. Additionally, this signal differentiating capability              2016.
could be utilized in remote monitoring or telemedicine               [18]   I. Nakamura, K. Michishita, M. Tanno, and K. Ito, "Synovial
frameworks. By using miniature sensors embedded in a                        impingement after posterior cruciate-retaining total knee arthroplasty for
                                                                            rheumatoid arthritis," Journal of Orthopaedic Science, vol. 11, pp. 303-
wearable system, the joints could be continuously monitored                 307, 2006.
and joint status changes or disease exacerbations could be           [19]   A. Ravelli, "Toward an understanding of the long-term outcome of
detected or maybe even predicted. This early detection would                juvenile idiopathic arthritis," Clinical and experimental rheumatology,
improve patients’ quality of life and reduce surgeries and                  vol. 22, pp. 271-275, 2004.
healthcare costs.

                                                                                                                                                    4
You can also read