Air Quality Index Prediction Using Simple Machine Learning Algorithms - IJETTCS
←
→
Page content transcription
If your browser does not render page correctly, please read the page content below
International Journal of Emerging Trends & Technology in Computer Science (IJETTCS)
                      Web Site: www.ijettcs.org Email: editor@ijettcs.org
Volume 7, Issue 1, January - February 2018                                                                  ISSN 2278-6856

           Air Quality Index Prediction Using Simple
                Machine Learning Algorithms
                                     Kostandina Veljanovska1, Angel Dimoski2
      1
       Department of Intelligent Systems, Faculty of ICT, University “St. Kliment Ohridski”, Bitola, Republic of Macedonia
                       2
                        Faculty of ICT, University “St. Kliment Ohridski”, Bitola, Republic of Macedonia
Abstract
Air pollution and its prevention are constant scientific            2. AIR POLLUTION PROBLEM                   AND     DATABASE
challenges during last decades. However, they still remain huge     CONSTRUCTION
global problems. Affecting human’s respiratory and
cardiovascular system, they are cause for increased mortality       Air pollution in the Republic of Macedonia has been
and increased risk for diseases for the population. Many efforts    concerned as a serious problem. Every day measured values
from both local and state government are done in order to           of the parameters of air quality are many times above the
understand and predict air quality index aiming improved public     limit values that are considered safe for human health. In
health. This paper is one scientific contribution towards this      the larger urban areas the situation is urgent. Some of the
challenge. We compare four simple machine learning
                                                                    activities to lower the air pollution are undertaken by the
algorithms, neural network, k-nearest neighbor, support vector
machines and decision tree. The air pollution database contains     local government, some by the state government. This
data for each day of 2017 from measurements stations in capital     paper represents our effort on the scientific level to
city of the Republic of Macedonia. The results are promising        contribute in handling this problem. At the first phase the
and it was proven that implementation of these algorithms could     necessary step is to predict air quality index in order to help
be very efficient in predicting air quality index.                  improve the situation. In this project we developed four
                                                                    different classifiers based on different algorithms.
Keywords: Air Quality Index, Machine learning, Decision
Tree, k-Nearest Neighbor, Neural Network, Support Vector            Database (Table 1) used in the project is based on model of
Machine                                                             official web site of Ministry of environment and physical
                                                                    planning of the Republic of Macedonia. Measurement
1. INTRODUCTION                                                     taken by the stations include SO2 (sulfur dioxide), NO2
                                                                    (nitrogen dioxide), O3 (ozone), CO (carbon monoxide),
Artificial intelligence and machine learning are areas of
                                                                    suspended particulates PM2.5 (fine particles) and PM10
biggest rise in the last year. The science of artificial
                                                                    (large particles).
intelligence where system makes decision on its own,
instead of working only by orders given by programmer as
                                                                      Table 1: Air pollution attributes (values are expressed in
traditional programming works, gradually started
                                                                               µg/m3, and CO is expressed in mg/m3)
influencing all aspects of our life. Starting from early-stage
startup companies and ending to large platform vendors, for
all of them, artificial intelligence and its part machine
learning have become the key focus areas.

Machine learning is an area where system which
implements artificial intelligence gathers data from sensors
in an environment and learns how to act. One of the reason
why we choose machine learning to predict air quality
index, was this ability of adapting of machine learning
                                                                    As seen from Figure1, border of low/medium/high air
(ML) algorithms.
                                                                    pollution is set on index with value 3 (medium). Reviewing
                                                                    all six attributes, we set rules for the level of pollution. If
In this paper three supervised learning algorithms k-nearest
                                                                    two of them are with index 2 and other two are with index 3
neighbor (k-NN), Support Vector Machines (SVM) and
                                                                    then we have medium level of air pollution. If values of
Decision Tree (DT) and one unsupervised algorithm Neural
                                                                    PM2.5 and PM10 particles are with index 4 or 5, then again
Network (NN) are compared.
                                                                    we have high level of air pollution, independent on other
                                                                    attributes. If one attribute is with value 3 and others with
There are many researchers that implement some of the               lower values then 3, then we have low AQI. If attributes are
algorithms we are using, such as NN [1], NN and fuzzy               with AQI value 1 or 2 then AQI is low.
systems [2], SVM [3], SVM for regression [4], fuzzy logic
[5], DT [6], k-NN [7], but none of them compare their               For the experiments we use database which is constructed
performance as one research for all of them four at the             according to air pollution in capital of the Republic of
same conditions and for the same data.                              Macedonia, Skopje. The reason is because the major city of
Volume 7, Issue 1, January – February 2018                                                                                   Page 25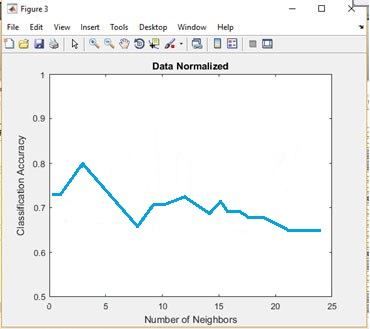
International Journal of Emerging Trends & Technology in Computer Science (IJETTCS)
                      Web Site: www.ijettcs.org Email: editor@ijettcs.org
Volume 7, Issue 1, January - February 2018                                                           ISSN 2278-6856
Macedonia is the most polluted city in the world these days.    networks is Backpropagation NN where backpropagation is
Database contains 365 samples (each per day of 2017), 51        used to lower the error [9].
of this samples are with High Air Pollution Index, other 94
are with Medium Air Pollution Index and the rest 220            Backpropagation itself begins after calculation for input
samples are with Low Air Pollution Index. Purpose of this       data ends. Activation function of each neuron is determined
project is to build four classifiers, to train the algorithms   by the value of the output from the previous layer and
with previously measured data and to make these classifiers     weights between the neurons. First that need to be done is
capable of predicting Air Quality Index with some new           calculation of the error in the output result (distinction
measured data. Supervised Test Database contains 100            between the expected result and the actual result).
samples and it is used in k-NN, SVM and DT algorithms.          Calculating the error is forward propagation. After the error
Neural network works as unsupervised learning algorithm         is known with forward propagation, minimization is done
using same training database of 365 samples with 6              using back propagation. This means that algorithm is
attributes. These samples are classified into 3 different       propagating backwards, from output layer to input layer
classes: Low, Medium or High.                                   and on its way it finds error for each of the weights. That
                                                                values have to be changed to minimize the total error [10].

                                                                3.1 Experiments with NN
                                                                Neural Network in this project is classifying samples to
                                                                “low”, “medium” and “high” levels of air pollution,
                                                                depending on the training database. There are 6 attributes
                                                                as input and there are 3 possibilities as output values which
                                                                need to be predicted. There is hidden layer too, which
                                                                contains 10 neurons. There are many rules for setting the
                                                                number of neurons in hidden layer [11]. In our case,
                                                                number of neurons in hidden layer is 10, because
                                                                experimenting with this value, we get the smallest optimal
                                                                error. In this project the neural network is constructed like
                                                                unsupervised learning, which means that the input data for
                                                                training are known to the network, but output data are
                                                                unknown, so the network performs classification by
                                                                knowledge gathered from input data.

        Figure 1 AQI according to attribute values

The experiments were performed in MATLAB Machine
Learning Toolbox as a platform for experimenting.
                                                                   Figure 2 Neural Network Architecture for our model
3 NEURAL NETWORK MODELLING
Neural network is biological model which is interesting
from data processing point of view since it calculates and
adopts decisions and conclusions alike the human brain.
One of the reasons why human is very good in solving
processes like recognizing objects and faces, recognizing
the environment, solving different situation problems,
actions and reactions is the brain organization and
functioning. From birth the brain has ability to develop its
own rules based on earlier experience. These rules are
made by strengthening old and making new connections
between the neurons. Human brain has billions of neurons        Figure 3 All confusion matrix for the case with highest
which are interconnected one another and communicate            accuracy of 92.3%
over electrochemical signals. Neural networks work like
copy of the human brain to solve complex problems in
machine learning area [8]. The learning in neural networks
                                                                4 K- NEAREST              NEIGHBOR           ALGORITHM
is not performed on each neuron particularly, but as a
system, globally. All neurons learn together constructing a     MODELLING
network which can solve problems with a high grade of           k-NN is Supervised Learning classifier. k-NN are non-
accuracy. One of the most frequently used types of neural       parametric techniques which are used for classification and
                                                                regression. If used for classification, result is object

Volume 7, Issue 1, January – February 2018                                                                         Page 26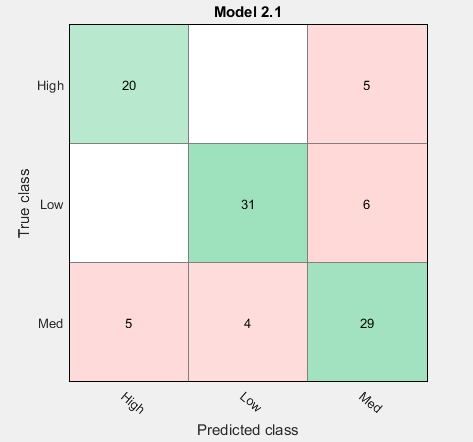
International Journal of Emerging Trends & Technology in Computer Science (IJETTCS)
Web Site: www.ijettcs.org Email: editor@ijettcs.org
Volume 7, Issue 1, January - February 2018 ISSN 2278-6856
classification depending on the result of the nearest and 8 in wrong (in medium class), “low level of pollution”:
neighbors voting, and the new object is dedicated to the 32 correct and 5 wrong (in medium class) and in class of
class with more votes. On the other side, if used for “medium level of pollution” 31 correct samples while
regression, then the result is value that is dedicated to the others belong to high and low class. Further tests will be
object as an average of the values of its neighbors [12, 13, performed for k=3 with different types of metrics.
14].
In k-NN algorithm the training phase is not performed.
Unlike the other algorithms, k-NN algorithm does not make
any presumptions for data distributions, and, also, does not
bring general conclusions. Because there is not training
phase, it must keep all the data for training and search over
them for neighbors. This process requires more time and
more resources for testing phase.
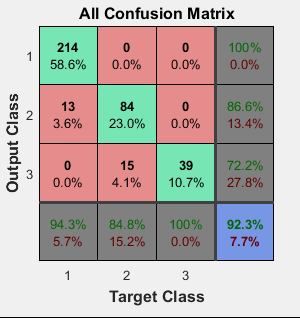
Figure 6 Accuracy of k-NN algorithm performing different
There are many distance metrics in k-NN. The most used
types of metrics
distance metrics is Euclidean distance if continuous
variables are considered. Other metrics that are often used
k-NN algorithm has best accuracy when k=3 with
are: city-block, hamming distance, cosine and correlation.
Euclidean metrics (Table 3).
The best choice for k for neighbors depends on data. In
general, higher values of k are decreasing the effect of
noise on classification, but they, also, limit differences 5 DECISION TREE MODELLING
between classes. Decision tree as a supervised learning algorithm is used as
a model for statistic prediction, data mining and machine
4.1 Experiments with k-NN algorithm
learning [17, 18]. There are two types of decision tree
The experiments were done with few combinations in order algorithms [19]: classification tree (predicted outcome is
to get the highest accuracy taking into account different the class which contains the data) and regression tree
value of nearest neighbors (k). Values of k were in interval (predicted result is real number). Classification and
from 1 to 21. Project has 3 classes for classification. Odd regression tree with one name are called CART
value for k was taken [15, 16]. Testing was performed with (classification and regression tree).
several types of metrics: Euclidean, correlation, city block
and cosine. Classification trees are tree models where target variable
contains set of discrete values. In this structures, leaves are
presenting class signs and branches are conjunctions of
properties which lead to signs of the class. Regression trees
are decision trees where target variable gets continuous
values (typically real numbers) [20]. Decision trees are
used to make decisions and to visually or explicitly present
them. The aim is to create a model which will predict target
value based on previously learnt input data.
Decision tree algorithm is constructed as a steam where
Figure 4 Values of k and classification accuracy each internal node represents test for an attribute, each
branch represents value for tested feature and each leaf is
classification for an instance. Highest node of the tree is the
root. Hierarchy of rules has to be implemented. Rules of
internal nodes (roots) test values of some feature of the
data. Each internal node fits with one of the input variables.
Each leaf is value of the target variables, according to input
values, presented on path from the root to the leaves.
Training data has to be used for tree construction.
Afterwards, depending on the tree model, output values are
predicted. Information with highest value are located on the
Figure 5 Confusion matrix when k=3
top of the tree.
Analyzing the experiments, it can be seen that the best
The process of learning the tree can be performed by
accuracy is for k=3 (Figure 4). Figure 5 shows confusion
splitting the source data presented in subsets based on test
matrix of accuracy of k-NN algorithm. Algorithm classifies
characteristics values. This splitting should be repeated on
samples as “high level of pollution” as follows, 17 correct
Volume 7, Issue 1, January – February 2018 Page 27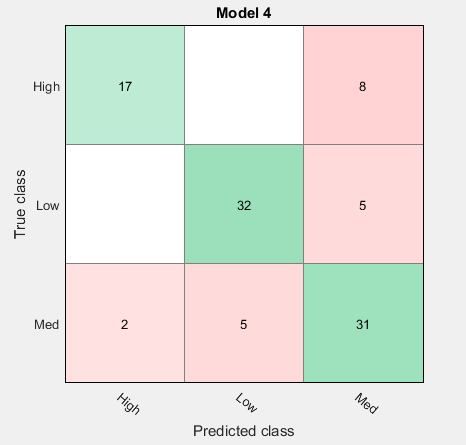
International Journal of Emerging Trends & Technology in Computer Science (IJETTCS)
                      Web Site: www.ijettcs.org Email: editor@ijettcs.org
Volume 7, Issue 1, January - February 2018                                                           ISSN 2278-6856
every of the subgroups and it is called recursive               machines are supervised learning models with associated
partitioning. At the moment when subset in the node have        learning algorithms that        analyze     data      used
the similar value of the target variable and when the           for classification and regression analysis. Some of the
splitting does not increase value of the predictions            advantages of SVM are [22]: effective in high dimensional
recursion is finished.                                          spaces; different kernel functions can be used for various
                                                                decision function; kernel functions can be combined to
Some of the software packets for data mining implementing       achieve more complex type of planes, although SVM have
decision trees are: IBM SPSS Modeler, RapidMiner, SAS           poor performance when number of features is grater then
Enterprise Miner, Matlab, R, etc. [19].                         number of samples and SVM do not provide probability
                                                                estimates which is the reason why cross-fold validation is
                                                                used.
5.1 Experiments with Decision Tree algorithm
In order to perform experiments, DT was constructed with        SVM model is a representation of the examples as points in
assumption that all input functions have final discrete         space, mapped in such a way that the examples of the
domains, there is one target function classification of air     separate categories are divided by a major vector (hyper
pollution data (three classes). Every internal node in the      plane) which is as wide as possible. Left and right from that
DT contains input feature. Every leaf of the tree contains      major vector, supports vectors at the same distances from
class.                                                          major vector are positioned. New examples are then
                                                                mapped into the same space and predicted to belong to a
                                                                category based on that on which side of the vector they fall.
                                                                So, the result depends on the position of the major vector.
                                                                This is called linear support vector machine (LSVM) [23].
                                                                Except performing linear classification, SVMs can, also,
                                                                efficiently perform a non-linear classification using what is
                                                                called the kernel trick, implicitly mapping their inputs into
                                                                high-dimensional feature spaces. Using kernel function,
                                                                two vectors can be applied and every point is mapped into
                                                                high dimensional space by a transformation. The idea is to
                                                                transform non-linear space into linear space [24].
       Figure 7 Confusion matrix for DT algorithm               There are several popular kernel types that can be used to
                                                                transform data into high dimensional feature space:
                                                                polynomial kernel, radial basic function kernel, sigmoid
                                                                kernel.

                                                                6.1 Experiments with SVM algorithm
                                                                Figure 9 shows that 20/25 High samples are classified as
                                                                correct and 5 of them are classified in Medium class. 31/37
         Figure 8 Accuracy of different sized DT                Low class samples are correctly classified and 6 of them
                                                                are classified in Medium class. And 29/38 samples of
The result of the accuracy of different sized decision trees:   Medium class are correctly classified, 9/38 classified as
single tree, medium tree, complex tree are presented on         wrong, 4 of them are in Low class and 5 samples in High
Figure 7, Figure 8 and Table 5. It can be seen that, for        class.
complex and medium tree, the accuracy result is same
78.0%, and for simple tree is 76.0%. Just like in k-NN
algorithm, DT and SVM, experiments were made as
supervised learning, i.e. algorithm knows input and output
values from training database and test database.

6 SUPPORT VECTOR MACHINES MODELLING
Kernel methods are a class of machine learning techniques
                                                                Figure 9 Confusion matrix of highest accuracy of SVM
that has become an increasingly popular tool for learning
                                                                algorithm
tasks such as pattern recognition, classification or novelty
detection [21]. This popularity is mainly as a result of the
success of the support vector machines (SVM), probably
the most popular kernel method, and to the fact that kernel
machines can be used in many applications as they provide
a bridge from linearity to non-linearity.
The fourth model that we choose for comparison in our
project is support vector machines. Support vector
Volume 7, Issue 1, January – February 2018                                                                         Page 28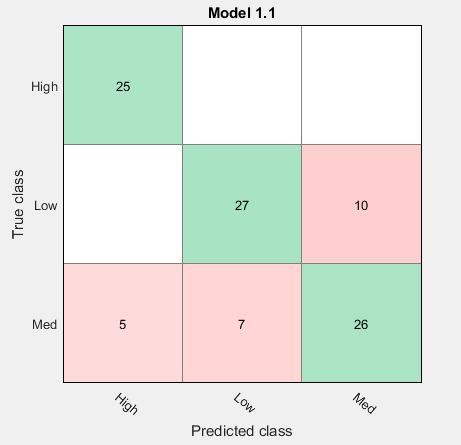
International Journal of Emerging Trends & Technology in Computer Science (IJETTCS)
                      Web Site: www.ijettcs.org Email: editor@ijettcs.org
Volume 7, Issue 1, January - February 2018                                                             ISSN 2278-6856
                                                                In SVM algorithm different kernel functions were tried to
                                                                get highest accuracy result. Experiments lead to a
                                                                conclusion that maximum accuracy of SVM was when
                                                                linear kernel function was used. Table 4 shows the results
                                                                for SVM with different kernel functions.

                                                                Table 4: Accuracy of SVM with different kernel function
                                                                Kernel Function             Accuracy
                                                                Linear                      80.0%
  Figure 10 Accuracy of SVM algorithm using different           Quadratic                   77.0%
                   kernel functions                             Cubic                       79.0%
                                                                Fine Gaussian               66.0%
From the figures 9 and 10 and Table 4, it can be seen that
SVM algorithm have highest accuracy of 80.0%, when              Medium Gaussian             79.0%
using Linear kernel function.                                   Coarse Gaussian             77.0%

7 DISCUSSION          OF      THE      RESULTS         AND      The decision trees are faster in data processing and easy to
CONCLUSION                                                      understand, but they are not as accurate as others K-NN,
                                                                SVM and NN. Table 5 presents the accuracy for different
The paper compares four different algorithms for machine        DT sizes.
learning: NN, KNN, DT and SVM. The experiments were
conducted using database of air pollution in the capital,        Table 5: Accuracy of Decision trees with different sizes
Skopje, of the Republic of Macedonia in 2017.                        Method           Number of splits Accuracy
NN algorithm contains one input, one hidden and one                    Single Tree       10                  76.0%
output layer. Input layer contains 6 input attributes, hidden          Medium Tree       20                  78.0%
layer contains 10 neurons and output layer contains 3                  Complex Tree      100                 78.0%
classes. Table 2 shows the accuracy of NN for the
experiments performed for different number of data for
training, validation and testing. It was found that the most    After the analysis of the results, it can be concluded that the
accurate case is NN when 70% of data are used for training,     most accurate algorithm for classification is NN with
10 % for validation and 20% for training the NN with            maximum accuracy of 92.3%, while KNN algorithm has a
maximum accuracy of 92.3%.                                      maximum accuracy of 80.0%, DT algorithm has maximum
                                                                accuracy of 78.0% and SVM algorithm has maximum
Table 2: Accuracy of neural network with different values       accuracy of 80.0%.
               for validation and testing
Method Data division                           Accuracy         References
Neural    70% train, 20% validation, 10% 91.8%                  [1] Q. Feng, “Improving Neural Network Prediction
network test                                                        Accuracy for PM10 Individual Air Quality Index
Neural    70% train, 15% validation, 15% 91.5%                      Pollution Levels”, Environmental Engineering Science,
network test                                                        30(12): 725–732, 2013
Neural    70% train, 10% validation, 20% 92.3%                  [2] P. Hájek, V. Olej, “Prediction of Air Quality Indices
network test                                                        by Neural Networks and Fuzzy Inference Systems –
                                                                    The Case of Pardubice Microregion”, International
For the k-NN algorithm several combinations were made to            Conference on Engineering Applications of Neural
obtain the highest accuracy with different values of the            Networks (EANN), pp 302-312, 2013
nearest neighbors (k). Values were taken in the interval        [3] L. Wang, Y.P. Bai, “Research on Prediction of Air
from k=1 to k=21. Table 3 shows the accuracy of the                 Quality Index Based on NARX and SVM”, Applied
algorithm for different type of metrics. This research leads        Mechanics and Materials (Volumes 602-605), 3580-
to a conclusion that the greatest accuracy algorithm holds          3584, 2014
when k=3 and has Euclidean metrics.                             [4] BC. Liu, et al, “Urban air quality forecasting based on
                                                                    multi-dimensional collaborative Support Vector
 Table 3: Accuracy of k-NN for different type of metrics            Regression (SVR): A case study of Beijing-Tianjin-
 Method                    Processing time Accuracy                 Shijiazhuang”, PLOS, 2017
 k=3 | Euclidean | Equal   1.711 seconds      80.0%             [5] H. Wang, et al., “Air Quality Index Forecast Based on
 k=3 | Correlation | Equal 1.794 seconds      63.0%                 Fuzzy Time Series Models”, Journal of Residuals
 k=3 | City Block | Equal 1.851 seconds       79.0%                 Science & Technology, Vol. 13, No. 5, 2016
 k=3 | Cosine | Equal      2.197 seconds      76.0%             [6] N. Loya, et al., “Forecast of Air Quality Based on
                                                                    Ozone by Decision Trees and Neural Networks”,

Volume 7, Issue 1, January – February 2018                                                                           Page 29
International Journal of Emerging Trends & Technology in Computer Science (IJETTCS)
Web Site: www.ijettcs.org Email: editor@ijettcs.org
Volume 7, Issue 1, January - February 2018 ISSN 2278-6856
Mexican International Conference on Artificial AUTHORS
Intelligence (MICAI), pp 97-106, 2012 Prof. d-r Kostandina Veljanovska. D-r Kostandina
[7] E. G. Dragomir, “Air Quality Index Prediction using Veljanovska completed her education at the University
K-Nearest Neighbor Technique”, BULETINUL "Sts. Kiril i Metodi", Skopje (BSc in Computer Science), at
Universităţii Petrol – Gaze din Ploieşti, Vol. LXII No. the University of Toronto, Toronto (MASc in Applied
1/2010 103 – 108, 2010 Engineering) and got her MSc and also her PhD in
[8] C. M. Bishop, “Neural Networks for Pattern Technical Sciences at the University “St. Kliment
Recognition”, Oxford, 1995 Ohridski”, Bitola, R. Macedonia. She has completed
[9] C. Zhang, et al., “Understanding deep learning postdoc in Artificial Intelligence at the Laboratory of
requires rethinking generalization”, ICLR, 2017 Informatics, Robotics and Microelectronics at the
[10] M.A. Nielsen, “Neural Network and Deep learning”, University of Montpellier, Montpellier, France. She worked
Determination Press, 2015 as a Research assistant at the ITS Centre and Testbed at the
[11] M. Bramer, “Principles of data mining”, Springer, Faculty of Applied Science, University of Toronto, Canada.
2007 She also, worked at research team for Constraints, Learning
[12] N.S. Altman, “An introduction to kernel and nearest- and Agents at LIRMM, University of Montpellier.
neihbor nonparametric regression”, The American Currently, she works as an Associate Professor in
Statistician, Vol. 46, No. 3, pp. 175-185, 1992 Information Systems and Networks, Artificial Intelligence
[13] R.J. Samworth, “Optimal weighted nearest neighbor and Systems and Data Processing at the Faculty of
classifiers”, 2012 Information and Communication Technologies, University
[14] D. Coomans; D.L. Massart, “Alternative k-Nearest “St. Kliment Ohridski” -Bitola, Republic of Macedonia.
neighbor rules in supervised pattern recognition: Part Her research work is focused on artificial intelligence,
1. k-Nearest neighbor classification by using machine learning techniques and intelligent systems. She
alternative voting rules”. Analytica Chimica Acta, has published numerous scientific papers in the area of
1982 interest, as well as several monographic items. She is a
[15] K. Veljanovska, “Machine Learning Algorithms reviewing referee for well-known publishing house,
Comparison”, International Journal of Engineering and journals with significant impact factor in science and also,
Technical Research (IJETR), Vol.7, No.11, 2017 member of editorial board of several international
[16] K. Veljanovska, “Analysis of Machine Learning conferences.
Algorithms Performance for Real World Concept”,
International Journal of Advanced Research in Science
and Engineering (IJARSE), Vol.06, No.12, 2017 Angel Dimoski. Angel Dimoski completed his education at
[17] Mitchell, T. “Machine Learning”, McGraw-Hill, New the University “St. Kliment Ohridski”, Bitola (BSc in
York, USA, 1997 Computer Science), in 2016. He currently works toward the
[18] J.D. Sayali, H.P. Channe, “Comparative Study of k- MS degree in Information Sciences and Communication
NN, Naïve Bayes and Decision Tree Classification Engineering at University “St. Kliment Ohridski”- Bitola,
Technologies”, International Journal of Science and Republic of Macedonia. His research interest includes
Research, 2013 artificial intelligence, robotics, virtual reality, engineer
[19] L. Breiman, et al., “Classification and regression expert systems.
trees”. Montrey, CA: Wadsworth & Brooks/Cole
Advanced Books & Software, 1984
[20] K. Kujaroentavon, et al., “Air quality classification in
Thailand based on decision tree”, Biomedical
Engineering International Conference (BMEiCON),
2014
[21] S. Canu, “SVM and kernel machines: linear and non-
linear classification”, OBIDAM, Brest, 2014
[22] A. Suárez Sánchez et al., “Application of an SVM-
based regression model to the air quality study at local
scale in the Avilés urban area (Spain)”, Mathematical
and Computer Modelling 54, pp. 1453–1466, 2011
[23] C. Cortes, V. Vapnik, “Support-vector network”,
Machine Learning, 1995.
[24] B. Gaonkar, C. Davatzikos, “Analytic estimation of
statistical significance maps for support vector
machine based multi-variate image analysis and
classification”, 2014.
Volume 7, Issue 1, January – February 2018 Page 30You can also read