An Interactive Web Application for Decision Tree Learning
←
→
Page content transcription
If your browser does not render page correctly, please read the page content below
An Interactive Web Application for Decision Tree Learning

                       Miriam Elia 1 Carola Gajek 1 Alexander Schiendorfer 1 Wolfgang Reif 1

                         Abstract                                ing to Géron “among the most powerful Machine Learning
                                                                 algorithms available today” (Géron, 2017). More recently,
      Decision tree learning offers an intuitive and             decision trees have experienced a surge in interest due to the
      straightforward introduction to machine learning           demand for explainable AI (Lundberg et al., 2020). There-
      techniques, especially when students are used to           fore, it is very important for anyone interested in ML to be
      program imperative code. Most commonly, trees              well-versed with DTs. This paper presents a web application
      are trained using a greedy algorithm based on              (see Figure 1) that has been designed to serve exactly that
      information-theoretic criteria. While there are            purpose: teaching DTs to beginners.
      many static resources such as slides or anima-
      tions out there, interactive visualizations tend to
      be based on somewhat outdated UI technology                2. How to Train Decision Trees
      and dense in information. We propose a clean and           Since finding optimal DTs on a given training set is known to
      simple web application for decision tree learning          be NP-complete (Mitchell, 1997), most often these trees are
      that is extensible and open source.1                       grown in a greedy fashion, going back to the ID3 algorithm
                                                                 developed in 1979 by Quinlan (Quinlan, 1986). The basic
                                                                 procedure is to reduce entropy (or another purity-related
1. Decision Tree Learning                                        criterion) as much as possible from the root node to the
                                                                 leaf nodes of the DT. The data set comprises a number
Decision tree learning is commonly studied among the first       of instances which respectively consist of concrete values
Machine Learning models in an introductory level course.         related to a number of attributes (or features) and a label or
The range of applications for decision trees (DT), in particu-   class value which is the result that the DT aims to classify
lar as ensemble methods such as boosted trees or random          correctly. The classical instructional example is the so-
forests, nowadays is enormous. Searching for “decision           called “tennis data set”. It comprises 14 instances, the
tree application contexts” in Google scholar, for instance,      attributes {Outlook, Temperature, Humidity, Windy} and
results in hundreds of papers published after 2019 using         the label values {N, P}, for negative and positive, i.e. if the
or analyzing DTs. Domains reach from autonomous driv-            person plays tennis under these weather conditions or not.
ing (Alam et al., 2020), over biogas plants (Vondra et al.,      This data set (see Table 1) is also used in the screenshots of
2019) to politics (Kaufman et al., 2019). But why is it that     the web application.
such a conceptually simple model, e.g. not as complex as
neural networks, is so widely used and thus relevant for any     In his book “Machine Learning”, Mitchell (Mitchell, 1997)
student of Machine Learning (ML)? The answer is also sim-        illustrates the algorithm to create a DT. In the first step, the
ple: they provide impeccable results when used on data sets,     entropy of the root node is calculated. The algorithm then
allow for diverse tasks, i.e. regression, classification and     requires the calculation of all possible posterior entropy
multi-output (Géron, 2017), and last but not least, DTs build   values obtained after splitting according to every attribute.
the foundation of random forests (RF) which are accord-          Thereafter, the information gain is calculated by consider-
                                                                 ing the difference between the root node’s entropy and the
  1
    Institute for Software & Systems Engineering, Univer-
                                                                 weighted sum of the resulting child nodes’ entropy values.
sity of Augsburg, Augsburg, Germany. Correspondence to:          This step is repeated for every present attribute, and the at-
Alexander Schiendorfer , Miriam Elia       tribute that generates the highest information gain is chosen.
.                                             This greedy procedure is repeated until all nodes are pure,
                                                                 i.e., have an entropy of 0.2
Proceedings of the Teaching ML Workshop at the European Con-
ference on Machine Learning and Principles and Practice of          2
                                                                      This is the ideal case. If the tree depth is constrained and there
Knowledge Discovery in Databases, Ghent, Belgium, PMLR, 2020.    exist leaf nodes with an entropy higher than 0, according to the
Copyright 2020 by the author(s).                                 algorithm, the label of such a node refers to the most common
    1
      Source available under https://github.com/                 label value of the node’s data points (Mitchell, 1997).
isse-augsburg/decision-tree-learning-ecml.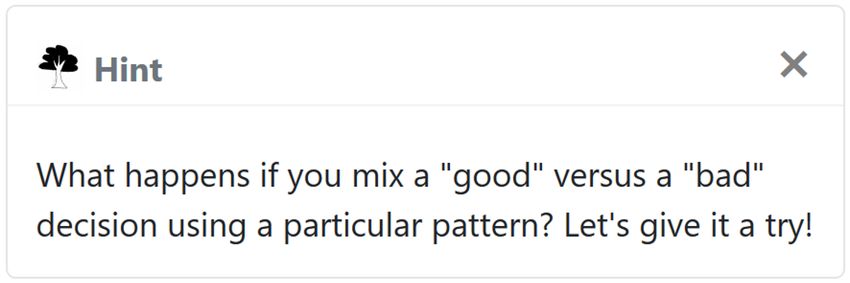
An Interactive Web Application for Decision Tree Learning
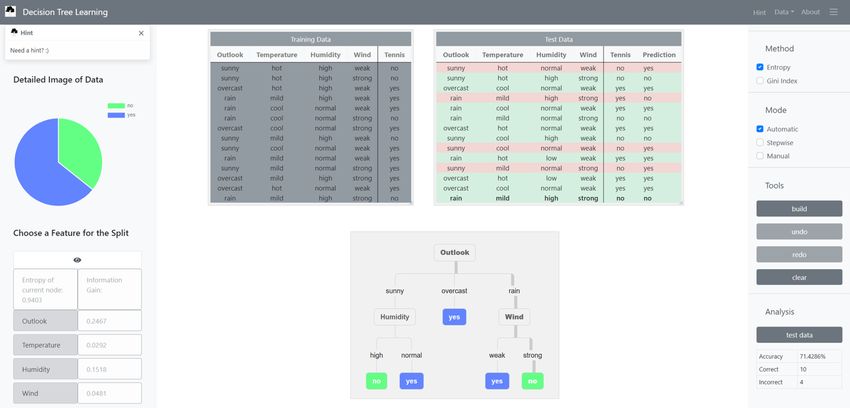
Figure 1. A complete view of the web application: On the left side, detailed information of the root node is displayed. The test data
is tested on the complete DT, and the path used by the DT to classify the selected test instance, i.e. the last one of the test data
, is highlighted.
do, a classical example would be a collection of if-clauses.
Table 1. The tennis data set with labels “yes” and “no” instead of
DTs however, offer an understandable introduction to the
originally “positive” and “negative”.
“new way of thinking” inherent to machine learning (Géron,
2017). The goal of the web application is to provide enough
O UTLOOK T EMP H UMIDITY W IND T ENNIS ?
room for experimentation to keep learners engaged, so that
SUNNY HOT HIGH WEAK NO they both internalize the general mindset of ML and gain
SUNNY HOT HIGH STRONG NO
OVERCAST HOT HIGH WEAK YES
a thorough understanding of DTs. Yet, it strives to focus
RAIN MILD HIGH WEAK YES on the essential parts of the algorithm in order to avoid
RAIN COOL NORMAL WEAK YES overwhelming first-time learners. Furthermore, as web ap-
RAIN COOL NORMAL STRONG NO plication, the software is easy to distribute and maintain and
OVERCAST COOL NORMAL STRONG YES it is open source and free to use for everybody. Its design
SUNNY MILD HIGH WEAK NO
SUNNY COOL NORMAL WEAK YES
aims to grant an pleasant user experience through its modern
RAIN MILD NORMAL WEAK YES style and self-explanatory structure. Supporting usability
SUNNY MILD NORMAL STRONG YES friendliness, the logical entities in the center of the tool, i.e.
OVERCAST MILD HIGH STRONG YES the tables containing the imported training and test data and
OVERCAST HOT NORMAL WEAK YES the DT, can be dragged and modified in size (not the DT)
RAIN MILD HIGH STRONG NO
according to the user’s wishes. The setting on the right side
of the tool is implemented as an expandable sidebar which
can be hidden if the user needs more space to build the DT.
3. A Web Application for Interactive DT
Learning 3.1. The Target Audience
Our tool was inspired by AI Space’s3 software to learn DTs, The target audience of the web application are beginners in
and offers a first contact to algorithms that learn rules from machine learning who tend to have a background in com-
data by creating an inductive model and is thus well-suited puter science. This could be university students, seminar
for introducing ML. Conventional programming usually participants of a company that aims to introduce AI and
leaves it up to the programmer to tell the program what to ML, or even pupils at school. The basic setup of a typ-
3 ical supervised learning context is illustrated by the web
http://www.aispace.org/dTree/index.shtmlAn Interactive Web Application for Decision Tree Learning
app: the data is separated into training and test data while
the model learns on the training set and its performance
is evaluated on the test set. When the user clicks on an
already classified test instance, the path determined by the
algorithm to classify the instance is displayed in the tree, as
shown in Figure 1. Further, the instances in the test set are
highlighted green if predicted correctly, and red otherwise.
The predicted class is shown on the right side of the test set.
If no matching leaf node could be found, “none” is listed.
Concerning the possible data types, the tool will work with
data sets consisting of numeric values only, both numeric
values and categorical values or categorical values only.
3.1.1. T HE S TUDENTS ’ P ERSPECTIVE
In addition to internalizing basic concepts, the student will
gain a thorough understanding of DTs and how they work,
following the greedy decision tree learning algorithm. The
web application offers three different modes, as shown in
Figure 4: the automatic mode builds a DT purity following
ID3 either with the Shannon entropy or Gini index as split
metric. The stepwise mode is more relevant for the teacher
and allows to step through the splitting decisions. But the
third, manual mode is the application’s key feature and cru-
cial for the student’s learning process. In manual mode, the
web application enables the user to play around with trees
of different depths. By comparing the performance of those
DTs with the performance of DTs built by ID3, students ob- Figure 2. Detailed information of the clicked node “Humidity”:
the distribution of the corresponding instances’ target labels is dis-
tain a basic feeling for the relation between the information
played in the pie chart. The table underneath shows the information
gain and the entropy of the nodes. When students click on gain of all next split choices, i.e. the four features. For example,
the node they would like to split next, as shown in Figure 2, splitting according to “Temperature” would not discriminate the
the calculated information gain is listed for every feature, node’s data set any further.
respectively. Further, the node’s distribution is illustrated
in a pie chart, while every target class is referred to by a
different color (10 is the maximally acceptable total number
of different labels). This deepens the understanding of the data (Géron, 2017). In this case, the DT cannot even classify
concept of entropy: If students follow the algorithm and the training set correctly. An underfitting tree is harder to
choose the splits that generate the maximum gain, fewer obtain using our tool since it trains to purity. Constraining
colors, and thus less “chaos”, are shown when clicking on the trees’ depths or preparing suitable data sets mitigates
a node. The final nodes contain just one single color, i.e. this issue.
have the minimal entropy of 0. If students choose a smaller To help students come up with ideas (e.g., the next greedy
gain, it will generally take much longer to achieve pure leaf split proposal), a dialog box with hints appears on the left
nodes. upper corner of the web application. If the mode is not set
By experimenting with different trees, testing them, and to manual, the content changes to theoretical information.
evaluating their accuracy, concepts like overfitting can be Exemplifying hints are illustrated in Figure 3.
observed. To illustrate this, the tool offers to analyze the per-
formance of DTs by displaying the number of correctly and 3.1.2. T HE T EACHER ’ S P ERSPECTIVE
incorrectly classified instances, and the calculated accuracy Teachers have to select the training and test sets that should
of evaluating the model on the test set as shown in Figure 4. be used. The default data set so far is a data set specifying
Overfitting manifests itself by having a high training ac- monsters, where input features like color, food, or speed
curacy and low testing accuracy. Students see this if the are mapped to a class of monsters, for instance vampires or
learned DTs focus on spurious correlations that were only werewolves. The final DTs can also be saved and loaded
observed in the training data. Underfitting occurs when the into the tool which enables teachers to prepare a short in-
model is too simple to learn the underlying structure of the troduction for explaining ID3 and how different DTs canAn Interactive Web Application for Decision Tree Learning
Figure 3. An example for hint messages displayed in the web ap-
plication appearing in manual mode.
be created. The stepwise mode can be used to explain the
calculated values for the entropy or Gini index of the current
node and the information gain more profoundly. Further,
as already mentioned above, teachers can prepare a spe-
cific tree to explain concepts like overfitting. To explain
underfitting, other models such as linear regression might
currently be better suited. To ease the preparation of ses-
sions for the teacher, the tool offers the option to save and
load complete sessions in or from a text file, which include
the training and test data, the mode, and the split attributes
according to which the tree has been built, as illustrated in
Figure 4. Saving sessions is only possible in manual mode,
as the automatically created DT needs simply one click to
be build. Figure 4. A more detailed summary of the possible settings in the
web app. It is possible to load custom or default training and test
3.2. Usage and Customization data into the tool, as well as load or save complete sessions under
manual mode (right). In manual mode options to undo and redo
It is possible to upload individually generated data sets by splits exist. The user can choose between the two methods Gini
complying to the data format, i.e. separating each value in index or Shannon entropy to calculate the optimal DT (left).
the CSV file by a semi-colon, and the tool interprets the first
row as attributes and the last column as label values. By
customizing the data set, the teacher can on the one hand stimulating tool for experimentation that is easy to extend
adapt to diverse target groups, and on the other hand, convey and customize.
different content. The “monster” set for instance, is fun and In terms of future work, the tool itself could be extended
aims to support students and pupils in playfully learning the with ensemble methods, for instance. Also, noisy data han-
theory. Another data set example could contain “smoking”, dling could be included. In the current version, it has been
“fast food consumption”, and “physical fitness” as features excluded since, for beginners, it is easier to first understand
and aim to classify the instances, i.e. people, according to the correct inner workings of the algorithm with one tree be-
health insurance suitability. This could raise awareness of fore coping with multiple of them at once. Another possible
the ethical responsibility when using ML tools. extension would be to include a means to limit the maximum
We explicitly invite the online community to share and tree depth and allow “impure” nodes to embrace the concept
extend these custom or customized data sets to enhance the of underfitting. On the other hand, the support regarding the
value of the web app even further since data sets dedicated web app itself could be extended. As the demand of skilled
to specific algorithmic or ethical issues are still scarce. ML teachers keeps growing, it would be advisable to invest
in a platform that comprises as many teachers in the area as
possible. Concerning the web app, all teachers could, for
4. Conclusion and Future Work instance, contribute to an online platform with their respec-
We presented a web application that demonstrates greedy tive contents and share data sets or application contexts. To
decision tree learning based on the ID3 algorithm in manual, accelerate AI Learning, the platform could be envisioned
stepwise, and automatic mode. Using modern UI concepts to cover more topics and DTs form only one section where
and visualizations such as pie charts, we hope to provide a this web app will be made available to everybody.An Interactive Web Application for Decision Tree Learning References Alam, F., Mehmood, R., and Katib, I. Comparison of Deci- sion Trees and Deep Learning for Object Classification in Autonomous Driving, pp. 135–158. Springer International Publishing, Cham, 2020. ISBN 978-3-030-13705-2. doi: 10.1007/978-3-030-13705-2 6. Géron, A. Hands-On Machine Learning With Scikit-Learn & TensorFlow, pp. 8, 27, 29, 173, 175. O’Reilly Media Inc., Sebastopol CA, United States of America, 2017. ISBN 9781491962299. Kaufman, A. R., Kraft, P., and Sen, M. Improving supreme court forecasting using boosted decision trees. Political Analysis, 27(3):381–387, 2019. doi: 10.1017/pan.2018. 59. Lundberg, S. M., Erion, G., Chen, H., DeGrave, A., Prutkin, J. M., Nair, B., Katz, R., Himmelfarb, J., Bansal, N., and Lee, S.-I. From local explanations to global under- standing with explainable ai for trees. Nature machine intelligence, 2(1):2522–5839, 2020. Mitchell, T. M. Machine Learning, pp. 56. McGraw-Hill, New York, 1997. ISBN 978-0-07-042807-2. Quinlan, J. R. Induction of decision trees. Machine Learn- ing, 1(1):81–106, Mar 1986. ISSN 1573-0565. doi: 10.1007/BF00116251. visited on 2019-09-11. Vondra, M., Touš, M., and Teng, S. Y. Digestate evaporation treatment in biogas plants: A techno-economic assess- ment by monte carlo, neural networks and decision trees. Journal of Cleaner Production, 238:117870, 2019. ISSN 0959-6526. doi: 10.1016/j.jclepro.2019.117870.
You can also read