Photovoltaic Solar Power Uptake in New Zealand
←
→
Page content transcription
If your browser does not render page correctly, please read the page content below
Photovoltaic Solar Power Uptake in
New Zealand
Allan Miller* 1, John Williams 2, Alan Wood 3, David Santos-Martin 1, Scott Lemon 1,
Neville Watson 3, Shreejan Pandey 1
1
  Electric Power Engineering Centre, University of Canterbury
2
  Department of Marketing, University of Otago
3
  Department of Electrical and Computer Engineering, University of Canterbury

EEA Conference & Exhibition 2014, 18 - 20 June, Auckland

Abstract
The GREEN Grid project is investigating the impact of solar power generation from
photovoltaics (PV) connected to the low and medium voltage distribution networks. One of
the goals of this research is to provide guidelines for adoption of PV in New Zealand, and
modelling tools and techniques for distribution companies to better understand its impact on
power quality within their networks. While collecting data from PV sites around New
Zealand and considering how modelling in the distribution network should be conducted, the
question of just how much PV is installed in New Zealand was asked. This paper presents
the findings of a survey of 12 distribution company areas covering about 80% of New
Zealand’s population. It discusses the findings in the international context, and how PV
might develop in the future in New Zealand. To obtain some idea of the adoption of PV in
the future, and what the eventual installed capacity of PV might be, the Bass Diffusion
Model, used to study new product diffusion, has been applied to the uptake data.

1
1. Introduction
Solar power generation from photovoltaics (PV) is receiving a lot of attention in New
Zealand from many sectors. This includes local body and national politicians promoting clean
renewable energy, PV suppliers and installers marketing PV heavily to homeowners,
homeowners and businesses installing solar systems, and distribution companies who are
keen to both understand the consequences of increasing distributed generation in the low
voltage network, and embrace the technology. The GREEN Grid project is developing
modelling tools to assess PV in the low and medium voltage networks. The aim of this is to
better understand the impact of PV, and to feed into standards or guidelines for its adoption in
New Zealand. In order to develop scenarios for modelling, the uptake of PV has been
assessed per distribution company, and generalised to New Zealand regions. This paper
reports the findings of the PV uptake assessment. It starts by summarising the methodology
used in the study, followed by a discussion of PV sites in New Zealand to date. Various
statistics of PV uptake are considered, and New Zealand’s uptake is compared to that of other
countries. The paper then considers what the ultimate uptake of PV in New Zealand might
be, and considers the returns from PV in various parts of New Zealand. It is concluded with a
discussion that includes the consequences of a large installed capacity of PV generation.

2. Study Methodology and Data
The PV uptake study was undertaken in October 2013 by obtaining data from distribution
companies on all PV sites applied for in their networks from 2003 to date. The data covers
the period January 2003 to December 2013. Two further distribution companies were added
in 2014: Marlborough Lines and Network Tasman. The distribution companies include:

    1.   Vector
    2.   WEL Networks
    3.   Unison
    4.   PowerCo
    5.   Wellington Electricity
    6.   Marlborough Lines
    7.   Network Tasman
    8.   Orion
    9.   Aurora

which covers about 80% of New Zealand’s population. In order to annualise 2013’s data, the
applications in the last quarter of 2013 were assumed to be the average of the first three
quarters of 2013. This assumption is conservative.

This study required data from distribution companies on their customers’ applications for PV
system connection to the distribution network (the Application). The most reliable data
available is the Application; information about commissioned sites is not as easily available,
because not all customers inform their distribution company once a site has been
commissioned. Hence Application data is used in this study to give the date and size of the
installation. This assumes that all Applications become commissioned and operational sites.
A study of available data by the author showed that the large majority of sites are
commissioned (over 95%), and the average time between application and commissioning for

2
most sites is between two and three months. In order to examine PV uptake by population
and number of connections (ICPs), the regional centres’ populations were obtained from
Statistics New Zealand [1], and the ICP connections were obtained from the distribution
companies.
The above provided the data for the core of the uptake study. It also enabled the authors to
examine the trends and extrapolate them to future potential uptake. An update of costs of PV
systems was made from data available from manufacturers, and the cost savings from PV in
the various main centres was determined from the model developed for reference [2].
3. PV Sites in NZ to date
For the distribution companies who provided data, the number of PV site applications and
cumulative capacity is shown in Figure 1. The number of applications is clearly increasing
dramatically, by a factor of three to four per year, with a corresponding increase in
cumulative capacity. The average size of a PV system across New Zealand is given in Table
1. This shows an increase over time up to 2010, where it appears to have stabilised at around
3.8 to 4kW. The average PV size for a household will be slightly smaller than this, as the
Applications contain a small number of large Applications, ranging from 10kW to 99kW.
However the vast majority of Applications are from households.
Annual PV Site Applications
1400
1200
1000
Number of Sites
800
600
400
200
0
2003 2004 2005 2006 2007 2008 2009 2010 2011 2012 2013
(a)
3Cumulative PV Capacity
8
7
6
5
MW
4
3
2
1
0
2003 2004 2005 2006 2007 2008 2009 2010 2011 2012 2013
(b)
Figure 1: PV in New Zealand: (a) Annual PV applications, (b) Capacity of cumulative PV
applications.
Table 1: Average PV application size.
Year Average Size (kW)
2007 1.3
2008 2.0
2009 3.0
2010 4.2
2011 3.9
2012 4.0
2013 3.8
Finally an indication of per capita installed PV capacity and per ICP capacity is given in
Table 2. This shows a tripling of per capita PV in each of the last three years, which is not
surprising given the rapid uptake of PV. As shown in Table 3 there is some variation
between New Zealand’s regions. Most of the regions fall in the range of 1.5 to 2.0 Watts per
inhabitant, Wellington is lower at 0.7 Watts per inhabitant, and all exceeded by Marlborough
at 7.1 and Tasman at 9.2 Watts per inhabitant in 2013. Contrasting this is the installed PV
capacity in other parts of the world, obtained from [3], and summarised in Table 4. This
shows that New Zealand is a long way behind many other parts of the world with PV uptake.
The reason why some parts of the world are so far ahead is heavy subsidies for PV, generally
through attractive feed-in tariffs.
4Table 2: New Zealand’s per capita and ICP installed PV capacity.
Year Watts per Inhabitant Watts per ICP
2008 0.0 0.0
2009 0.0 0.1
2010 0.1 0.2
2011 0.2 0.4
2012 0.6 1.5
2013 1.9 4.6
Table 3: 2013 per capita and ICP installed PV capacity by region.
Area Watts per Inhabitant Watts per ICP
Auckland 1.5 0.7
Waikato 1.9 1.1
Hawkes Bay 1.5
0.7
Taupo Area 1.1
Wellington 0.7 0.5
Tasman 9.2 3.0
Marlborough 7.1 1.9
Canterbury 1.7 1.0
5Table 4: Per capita installed PV capacity in other countries [3].
Country Watts per Inhabitant (2013)
Germany 440
Italy 293
Belgium 267
Bulgaria 140
Australia 139
Spain 119
Japan 107
Denmark 95
Switzerland 91
France 70
Austria 68
Israel 51
UK 46
Netherlands 39
USA 38
Canada 34
South Korea 29
Portugal 27
Taiwan 16
China 13
Thailand 11
Sweden 4
Malaysia 2
Norway 2
India 2
Mexico 1
Turkey 0
4. What might the future uptake of PV be?
The previous section looked at PV applications and their capacity to date. They show a
dramatic increase in the number of PV sites installed, and therefore the capacity. This raises
the question: how long will this rate of uptake continue, and what will the eventual installed
capacity be? The GREEN Grid project has attempted to answer this question in three ways:
1. A simple exponential fit to the existing data, with an extrapolation into the future –
the results of which must be interpreted very carefully;
2. Examination of New Zealand’s housing stock to ascertain the potential for PV
installation, from such parameters as house location, orientation, and roof area. This
work is still underway and will be published at a later date; and
3. Application of the Bass diffusion model, to model the diffusion of a new technology
(PV in this case) into a market.
6The GREEN Grid project has used a variety of ways to gain an indication of the likely range
of PV uptake, and to attempt to validate any estimates.
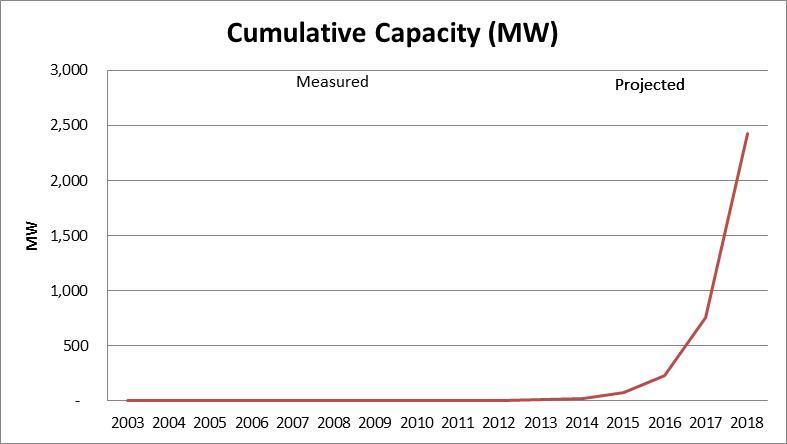
The exponential extrapolation of the known uptake data to date, as cumulative capacity, is
shown in Figure 2. The extrapolation was stopped at 2018, as this represents 372 watts per
inhabitant (at today’s population), and about 43% of houses with PV. This seems unrealistic,
certainly in the space of a year. Hence 2017 might be more realistic, at 116 Watts per
inhabitant and 13% of houses with PV, giving a total of 753MW of PV. The data in Table 4
suggests that either of these capacities is possible, although the rate of uptake may be slower
with the lack of subsidised feed-in tariffs – so the capacity of almost 1GW may be reached
later.
Figure 2: Exponential projection of cumulative PV capacity.
4.1 Bass Diffusion Modelling
PV is a relatively new innovation in society, and in this section we have attempted to model
the spread of PV through the population, based on the uptake data to date (as PV units
installed). In general the spread of a new innovation starts slowly, and then increases rapidly,
as shown in the PV uptake in New Zealand to date. After this the acceleration decreases, and
slows to zero when the market is fully penetrated.
The Bass Diffusion Model (BDM) was first proposed by Frank Bass in 1969 [4]. The basic
BDM uses a differential equation to model uptake of new technology, with a coefficient of
innovation influenced primarily by information from non-personal sources (such as
advertising) and a coefficient of imitation, which relates to those whose decision to adopt is
based on observation of whether others have adopted the innovation (“word of mouth” or
vicarious learning).
In this section we are concerned with applying the BDM to the PV uptake data collected to
date. Monthly uptake data is used, as the annual data contains insufficient information for the
numerical methods of integration used for parameter estimation to work. Using a non-linear
7regression method the diffusion model fit to the PV uptake data is shown in Figure 3, which
shows the actual and predicted sales (i.e. applications) per month (top panel) and cumulative
sales to date (bottom panel). This shows full market penetration of 8,000 PV units. Based on
an average size of 3.8kW per PV unit, this equates to about 30MW of installed PV capacity.
Also the coefficient of innovation is near zero, implying the sales growth is driven largely by
personal sources (“word of mouth” and direct observation) rather than institutional sources
(e.g. advertising).
Figure 3: Bass diffusion of PV uptake.
The fit of the model to the data is very good: the R2 for cumulative applications is over 99%.
However it is important to note that the BDM models the data at hand, reflecting the
conditions under which the data were collected. Consequently it cannot take into account
expected future conditions, especially increasing economic incentives due to, in particular,
technological improvements and increasing opportunity costs (i.e. relative cost of alternative
energy sources). Also, many innovations undergo step-changes when they reach a critical
mass, for example when penetration reaches a level such that on a typical commute to work
8most people would be guaranteed of seeing at least one or two solar arrays. It is for these reasons that the BDM forecasts are lower than what might be expected. However the forecast is almost certainly more realistic than a simple exponential fit, which assumes monotonic increase, asymptotically approaching infinite sales per period. This is why it has been essential to truncate the exponential series by examining the implications of its results, such as per capita capacity and percentage of houses with PV. 4.2 PV Uptake Discussion The two models applied show a substantial difference between potential uptakes of PV. The simple exponential model, with some thought applied in terms of when to stop it, shows that the ultimate uptake could be about 753MW, representing about 13% of houses, and giving 118 Watts per inhabitant. The BDM model suggests an uptake of 30MW, which gives about 7 Watts per inhabitant. Data from Europe suggests it will be higher than this. Furthermore, there is evidence of commercial operations, such as wineries in the Marlborough region, installing large PV arrays in the order of 50 to 100kW. Once commercial operations begin installing PV in large volumes, basing the market penetration on housing stock alone is less reliable, suggesting that PV capacity could go beyond the 753MW predicted by the exponential graph. It is extremely difficult to forecast, and fraught with dangers. What we do know is that PV uptake is growing rapidly at present. 5. PV System Returns The cost of PV systems appears to be declining, although this is very difficult to ascertain accurately. In 2013 we reported an install cost in excess of $4 per Watt [2], and some anecdotal evidence shows that has dropped to about $3 per Watt. Given the large regional variation in uptake, discussed previously, the cost savings by region are of interest. The model used to derive results for [2] was used to give cost savings for houses in each of the cities listed in Table 5. In order to enable comparison between each of these results, all other variables here held constant between the centres. These include: an average daytime household load of 600 Watts, a PV system size of 3kW, a daytime electricity price of $25 c/kWh, a panel tilt of 30o, and for a true north facing site. As shown in Table 5 there is quite a variation between cities, up to 25%. This is entirely due to the difference in insolation (which varies with latitude) and average cloud cover between those cities, as obtained from the NIWA data discussed in [2]. 9
Table 5: Difference in savings for the same 3kW PV system and house (600 Watts average
daytime load) across New Zealand. The Watts per inhabitant is taken from Table 3 to enable
                       comparison of annual savings with PV uptake.

                                                         Watts per Inhabitant
                             City         Annual Savings (surrounding region)
                             Auckland               $800                   1.5
                             Hamilton               $790                   1.9
                             Tauranga               $790
                             Masterton              $780
                             Taupo                  $780                   1.1
                             Hastings               $800                   1.5
                             Wellington             $750                   0.7
                             Blenheim               $850                   7.1
                             Nelson                 $850                   9.2
                             Christchurch           $750                   1.7
                             Dunedin                $675
                             Invercargill           $675

6. Discussion and Conclusion
We can only give bounds for future PV uptake at present, which may be between 30MW and
1GW. It is far too early to tell this reliably, which is why GREEN Grid intends to repeat this
exercise annually. A simple exponential mode of uptake (assuming growth without end)
gives forecasts that are evidently too high, while a more realistic model (the BDM) gives
predictions which appear too low. It is very difficult to apply the BDM, as New Zealand is at
too early a stage of adoption, and we may not be near the point of inflection. (i.e when the
rate of increase of sales per period starts to decline). The parameters of the BDM can be
either estimated directly from the data (as we have done here), or simply specified by the
analyst. In such cases, likely values of the parameters can be sourced from “similar”
products. In our case that would be PV adoption in comparable economies. However
identifying such similar cases is difficult, and work is not complete at the time of writing.

The 2013 New Zealand Census included a question about heating of peoples’ dwellings,
which included “solar heating equipment” as an option [7]. About 0.5% of respondents
(roughly 8,000 homes) ticked this option, however solar may include solar hot water, passive
solar, and photovoltaics. Therefore this does not provide validation of the PV uptake results,
or information able to project them.

Costs of PV are reducing each year; hence PV is only likely to increase in popularity. Results
show an uneven uptake of PV around NZ, skewed towards areas with high sunshine hours
and active promotion such as through economic incentives. This is not surprising given that
the returns from PV in those areas is as much as 25% higher than areas with fewer sunshine
hours. If PV in New Zealand does grow to 1GW, this represents about 10% of today’s
installed generation capacity. However, with a capacity factor of about 15%, PV is only
likely to generate 2-3% of NZ’s electrical energy needs. In turn this will increase the
variability of electricity supply as the sun shines, or is shaded by clouds. GREEN Grid sets
out to understand the potential variability and to determine ways to deal with it.

10
GREEN Grid also sets out to find ways of modelling PV, and other distributed renewable
generation, in the low and medium voltage networks. Work in this area to date has involved
a working group comprising researchers from the University of Canterbury, University of
Auckland, and distribution company technical representatives, as well as the development of
modelling tools.
7. Acknowledgement
The authors acknowledge the funding provided by the Ministry of Business Innovation and
Employment, Transpower, and the EEA for the GREEN Grid project that has enabled this
research to be carried out. They also acknowledge and thank the distribution companies who
have provided data on which the analysis in this paper is conducted.
8. References
[1] Statistics New Zealand (2013). Subnational Population Estimates: At 30 June 2012,
http://www.stats.govt.nz/browse_for_stats/population/estimates_and_projections/Subnati
onalPopulationEstimates_HOTPYe30Jun12.aspx, accessed October 2013.
[2] Wood, A., Miller, A., and Claridge, N. (2013). Moving to the Sunnyside of the Street:
Growing Residential Solar Electricity in New Zealand. Electricity Engineer’s
Conference and Exhibition, 19-20 June 2013.
[3] International Energy Agency (2014). PVPS Report, Snapshot of Global PV 1992-2013,
Preliminary Trends Information from the IEA PVPS Programme, http://www.iea-
pvps.org/fileadmin/dam/public/report/statistics/PVPS_report_-
_A_Snapshot_of_Global_PV_-_1992-2013_-_final_3.pdf, Accessed April 2014.
[4] Bass, F. M. (1969). A new product growth for model consumer durables. Management
Science, 15(5):215–227
[5] Williams, J. (2014). Forecasting PV uptake with the Bass Diffusion Model, April 12,
2014.
[6] Zhou, W. (2013). Distributed PV Generation: Challenge to a network company and the
present status of the guiding standards and regulations, APEX 2013, Christchurch.
[7] Statistics New Zealand (2013). New Zealand Census of Population and Dwellings,
file:///C:/Users/Allan%20Miller/Downloads/2013-dwelling-form.pdf, accessed April
2014.
11You can also read