Visitor Demand Mapping - for Queenstown Update 6 Published on Wednesday, September 23, 2020
←
→
Page content transcription
If your browser does not render page correctly, please read the page content below

Visitor Demand Mapping
 for Queenstown                    Update 6

 Published on Wednesday, September 23, 2020

                                              1 | Visitor Demand Mapping for Queenstown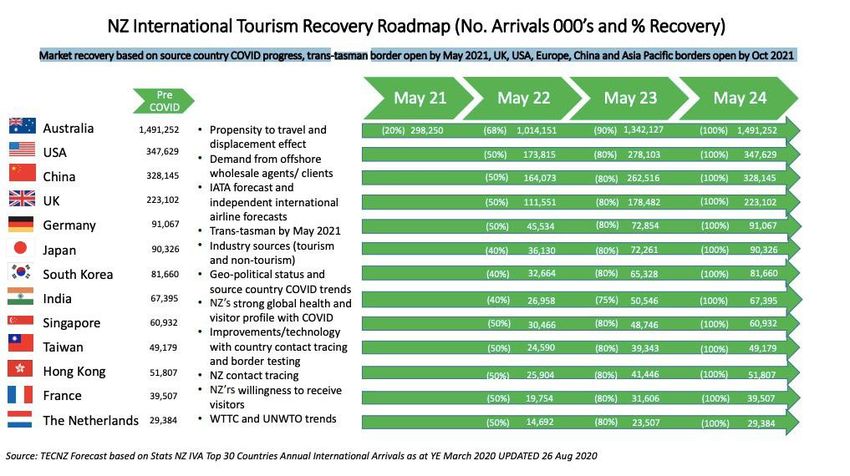
This is an update to the Visitor Demand Mapping for Queenstown-Lakes (2020 to 2024) report
published on Thursday, May 14, 2020. You can get the full version of the earlier report here.

We are keen to learn how you are using these reports and welcome any feedback on topics that you
feel would be useful in including and tracking in future reports. For feedback, more information or
clarifications about the content below please contact kirann@queenstownnz.nz.

Recent developments to factors
 that impact visitation to Queenstown
New Zealand economy
GDP fell by a record 12.2% in the June Quarter, less than forecast in the Pre-election Economic and Fiscal
Update (PREFU) released last week, far surpassing the previous record of 2.4% decline recorded in March 19911
(exhibit 1). Although it is a new record, it was not as significant as the 16% forecasted earlier in the year. The
smaller decline was attributed to earlier than expected downward movements through alert levels. However, the
medium-term outlook is now looking weaker due to a weaker global outlook and more persistent impacts of
the pandemic that are expected to reduce New Zealand’s potential output, slowing the pace of recovery (exhibit
2). The PREFU stated the sectors with the largest declines were mining, transport, construction and retail trade
& accommodation (exhibit 3). The quarterly seasonally adjusted services balance was in deficit in the June 2020
quarter for the first time since 1998. Services exports fell by $2.5 billion to $3.9 billion, while services imports fell
by $1.8 billion to $4.0 billion.

Income support numbers have been falling over the past two weeks most like due to people reaching the end of
the 12 week COVID-19 Income Relief Payment (CIRP) (exhibit 4). The total number of people receiving income
support fell by 500 down to 217,000 on the previous week.

Auckland bounced sharply out of their lockdown restrictions with high frequency data indicating a fast recovery to
almost pre the Auckland Alert Level 3 levels, indicating that people were not hesitant about getting out and about
again2.

Net migration fell to close to zero from April to July, not surprisingly with a net gain of NZ citizens. In early
September the Government announced that there will be exceptions at the border to allow temporary work visa
holders to return to NZ and exceptions will now also be made to allow partners of NZ citizens and residents to
return3.

Australia economy
Australia has officially fallen into recession (defined as two consecutive quarters of negative growth) for the
first time in almost three decades4. The economy shrank 7% during the last quarter which was steeper than the
                                                                                                                            2 | Visitor Demand Mapping for Queenstown

previous quarter and its worst performance since records began. The Treasury is optimistic that once Covid-19
is overcome, the economy will bounce back considering its relatively strong performance compared to other
developed economies. This return to growth will not be without difficulties, with China’s (Australia’s largest trade
partner) growth slowing and increasing political tension between the two (imports for the June quarter fell by
almost a quarter). Add in climate change related disasters such as wildfires seen last year, stagnant wage growth
and a housing price bubble, and an uncertain picture of recovery emerges. In the latest OECD Interim Economic
Assessment released 16 September Australia’s GDP annual percentage change was revised to be -4.1% in 2020
into 5.7% growth in 20215.

On the employment front almost half of the jobs lost from the pandemic have now been recovered. The
unemployment rate dropped from 7.5% in June to 6.8% in August with an additional 111,000 jobs established
across all states outside of Victoria, creating a very strong v shaped recovery6 (exhibit 5). Some states have even
returned to pre-covid levels of employment and hours worked.

The Westpac-Melbourne Institute Index of Consumer sentiment bounced back from a 9.5% drop in August to a
18% increase in September echoing the increasingly optimistic future mindset of Australians . The indicator is only
1.6% below the average of the six months prior to Covid-19 now. This contrasts with the National Australia Bank’s
(NAB) business confidence index which weakened by 6 points in August1.

USA Economy
Recovery is slowing in the United States with industrial production indicators only up 0.4% vs previous month
which is still 7.3% below pre-covid levels2. Final products production slowed from 5.1% in July to only 0.7% in
August and only 0.3% in consumer goods. Retail sales have edged in to recover to pre-covid levels (exhibit 6).

Unemployment rate is falling with an additional 1.37 million jobs added in August and a decline from 10.2% in
June to 8.4% in August1.

In line with the release of the OECD Interim Economic Assessment’s revision of annual percentage change (USA
is forecast for -3.8% in 2020 and 4.0% in 2021), the US Federal Reserve has adjusted their projections to show a
lesser contraction in GDP and lower unemployment rates than June projections5. Earlier in the month, the Federal
Reserved announced a flexible average inflation-targeting regime which was met with limited market reaction.

China Economy
China continues to truck along on its recovery projections with activity data showing a consistently steady
recovery1. Retail sales finally turned positive to show a 0.5% growth vs year ago, the first positive this year.
Industrial production was up 5.7% in August vs same period last year which was a higher than expected growth.

Exports were 9.5% higher in August vs same period last year and the fastest growth seen since March 2019, much
of the growth was related to Covid-19 related industry like PPE and work from home tools . Interestingly, imports
fell 2.1% indicating potentially underlying weaker demand within China.

Global Economy
On a global scale the economic impact from Covid-19 has been four times worse than the financial crisis
according to the OECD8. The recently released OECD Interim Economic Assessment showed that growth declined
by a record 6.9 percent from April to June from the previous three months. The largest declines were recorded
in India (-25.2%) and Britain (-20.4%). The OECD looks at the world’s top 20 economic outputs, so New Zealand
doesn’t feature on these projections.

Although grim, the OECD forecasts were actually more positive in their expected recovery. They revised their
global projections upward 1.5% from a 6% real GDP decline to a 4.5% decline5. The report found that economic
output recovered swiftly following the easing of measures to contain the Covid-19 pandemic and the initial re-
opening of businesses. See exhibit 7 for a global projection and full break down of all 20 countries.

The Bloomberg Trade Tracker has moved back into “normal” territory as the momentum for recovery builds with
all ten indicators showing that they are now fitting into “normal” ranges in September for the first time for some
indicators in over two years9. The tracker monitors exports, sentiment, shipping and prices indexes globally.
                                                                                                                      3 | Visitor Demand Mapping for Queenstown

Queenstown Lakes Economy
According to the latest MBIE consumer spending figures updated 13 September in the Queenstown Lakes District
the previous four weeks spending was down an average of 23.7% compared to the same period last year10. For
the weeks that Auckland was in alert level three this decline pushed out to -22.9%, -30.2% and -27.7%, compared
to the last two weeks with Aucklanders back again which were -18.8% and -16.2% (exhibit 8).

Global Aviation
The aviation industry continues to be one of the hardest hit, showing few signs of recovery. IATA’s Economic Units
reported a slow expansion of air travel in July with global revenue per kilometers (RPKs) down 79.8% year on year
compared to a low in April of down 94.1% year on year 11 (exhibit 9). Domestically RPKs globally are down 57.5%
year on year compared to the international decline of 91.9% showing that any growth is attributed to domestic
travel. China is already back to a -28.4% growth year on year (exhibit 10). Not surprisingly shares in airlines are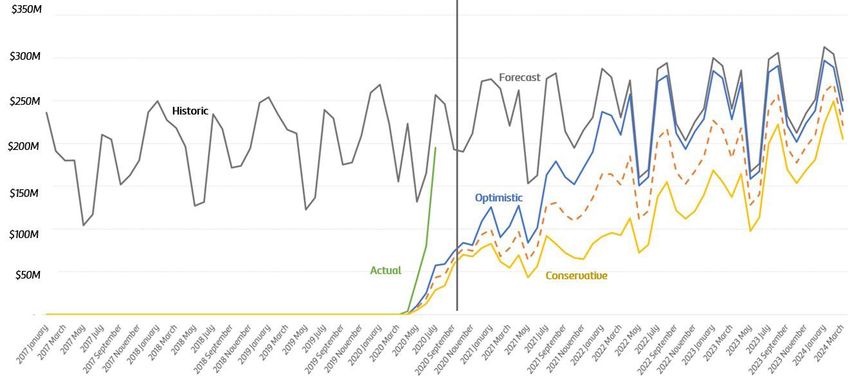
tracking well behind in recovery compared to other financial markets (exhibit 11).

Singapore Air is cutting roughly 20% of its workforce, including at its SilkAir and Scoot units, the first downsizing
since SARS in 200312 . Lufthansa may widen planned cuts of 100 planes and 22,000 jobs and Cathay Pacific won’t
apply for Government funding which frees Cathay from the requirement to retain workers in exchange for the
support. Since January airlines globally have flagged that as many as 400,000 people will either be let go or
furloughed, according to data compiled by Bloomberg.

Closer to home Air New Zealand Chief Executive Officer Greg Foran told the Sydney Morning Herald “I certainly
do not believe we will see anything across the Tasman this calendar year13 . It’s hard to believe it would be before
March next year, and could well be longer”. Air New Zealand has also grounded their Boeing 777 fleet for at least
another year until September 2021 indicating a slower return to international travel.

Domestic Aviation
Air New Zealand announced a bottom line loss of $454 million after one-off items and a small tax credit,
compared with last year’s final profit of $276m at the end of August and announced no dividend would be paid14.
Travel restrictions resulted in a 74% drop in passenger revenue from April to end of June vs same period previous
year.

Queenstown Aviation
Following the easing of alert level restrictions in Auckland, Air New Zealand sold over 110,000 tickets in 24
hours with 70,000 being sold in the first six hours after the alert change announcement and removal of physical
distancing on planes. Outside of the school holidays, a standard week in October will see Air New Zealand
operating 117% of the capacity on Queenstown routes compared to October last year. Jetstar returned to
domestic services 17 September 2020.

Epidemiology
The Deep Knowledge Group released an update on their controversial Regional Safety Assessment 250 Countries,
Regions & Territories15. The report doesn’t just look at infection or death rates due to Covid-19 it instead is based
on a complex set of medical, economic, social and political factors. On this list New Zealand is ranked as number
two behind Germany and seven of our top ten key visitor markets are in the top 20. It is encouraging to see that
some of our key markets are in strong positions for when international travel does restart (exhibit 12).

Vaccine development continues to progress with five vaccines now at the limited approval stage, nine at phase
three trials (large scale efficacy tests) and 42 in phase one and two, plus another 92 vaccines under investigation16.

A new wave of Covid-19 antibody test (which measure the level of protection someone has built up against
Covid-19) has been developed17. This will be useful because to date Covid-19 tests could only detect if the virus
was present and live, whereas these will tell if the person has had Covid-19 in the past. Two pharmaceutical
companies have had their tests approved by the US FDA.
                                                                                                                         4 | Visitor Demand Mapping for Queenstown

Treatment for Covid-19 is also improving with two treatments showing promising evidence (being remdisivir
which interferes with the virus’s genome and Dexamethasone which is a steroid) and two are already being widely
used (being respirators and positioning in prone).

Domestic Market
The latest monthly regional tourism estimate figures for July indicated a surprisingly strong performance across
New Zealand considering the practically nonexistence of international spend. In Queenstown international spend
was down 90% but domestic spend was up an astounding 92% to $180 million spent in July18.

ASB’s latest quarterly forecast discussed the impact of having New Zealanders that normally holiday overseas
remaining in New Zealand and spending their holiday here instead19. ASB had previously estimated the impact
of having boarders closed to be around 5% of GDP but with these kiwis holidaying at home they think the impact
will actually be around 3%.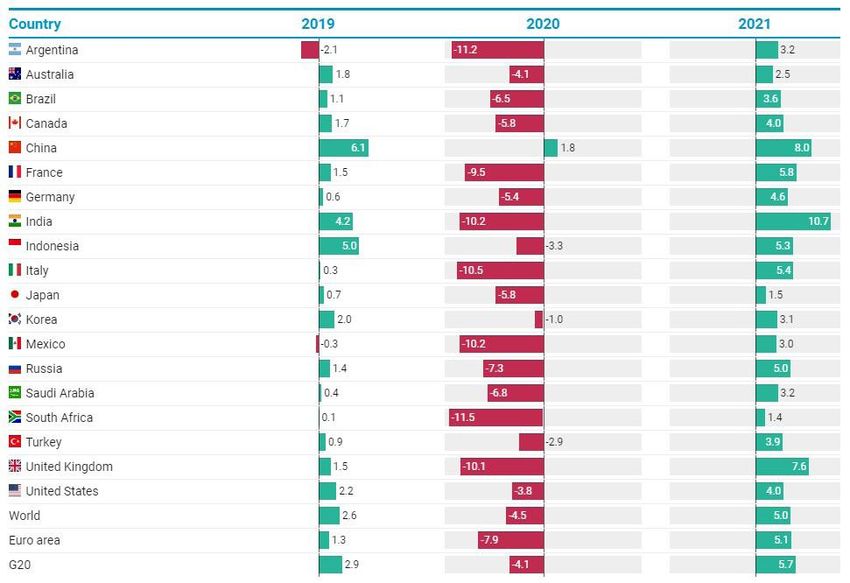
Airbnb together with Oxford economics have released a new report indicating that Airbnb will play a crucial role
in the recovery of the tourism sector in New Zealand20. The report found Airbnb contributed $2.7 billion to GDP
representing 5.7% of total tourism spending and supported 26,300 jobs in 2019. Airbnb is popular with Kiwi
holiday makers with $828 million being spend by New Zealanders within New Zealand.

Australia Market
Tourism New Zealand released a report detailing the impact of the pandemic on intentions to travel among
Australian consumers which they update monthly21. The report showed that 68% of Australian consumers viewed
New Zealand’s health response as excellent and for 67% of consumers it increased their perception of New
Zealand as a favorable holiday destination. Over half of the consumers surveyed wanted to come to New Zealand
within six months of restrictions being lifted, the vast majority purely for holidaying purposes and most of them
intending to take trips between 6-14 days long.

In National Cabinet, Scott Morrison has again raised the idea of a trans-Tasman bubble but with significant
caveats22. He would like travel corridors to be opened between specific regions that are known to be Covid-19
free – like Queensland and the South Island of New Zealand. Both Adern and Morrison have stated that the
bubble will not be anytime soon though, due to the both countries needing to be community transition free for
over 28 days.

European Markets
European countries which had successfully flattened the curve are now experiencing a surge of new cases with
Spain and France experiencing rapid upward trajectories23 (exhibit 13). Britain looks to be set on the same path
with a set of new studies released stating that the infection rate doubled every eight days from late August to
early September and their R number is currently 1.7 and increasing (an R number of 1 or lower would indicate
a dwindling outbreak). As a result Britain has reintroduced restrictions and banned gatherings of more than
six people24. As autumn schooling is resuming, people are returning to work and with the oncoming winter flu
season, cases could potentially continue to increase. Early indications from this wave of infections are showing
that there is at least a lower mortality rate.

Global Markets
Global international tourist arrivals declined 93% in June compared to 2019, according to the World Tourism
Organization25. This equates to around 440 million international arrivals and about US$460 billion in export
revenues which is around five times the loss experienced in the Global Financial Crisis. Around 53% of
destinations have now eased travel restrictions, an increase of 28% from mid-June. Different regions have very
different stances on allowing borders to reopen26. In Europe only 17% of countries still have border restrictions in
place where as in the Asia region 61% still have restrictions in place (exhibit 14).

The Tourism Export Council of New Zealand released their latest forecasts predicting that a full recovery of visitor
numbers will not be reached until May 202427. They predict that by May 2021 the trans-Tasman bubble will be
                                                                                                                       5 | Visitor Demand Mapping for Queenstown

opened but would have reached around 20% of pre-covid levels by then. They then predict that all other borders
will be opened by October 2021. For the full roadmap to recovery see exhibit 15.

In the Treasury’s Pre-election Economic and Fiscal Update (PREFU) they have forecasted that if no treatment
method or vaccine was found, international borders would not be opened until the start of 202228.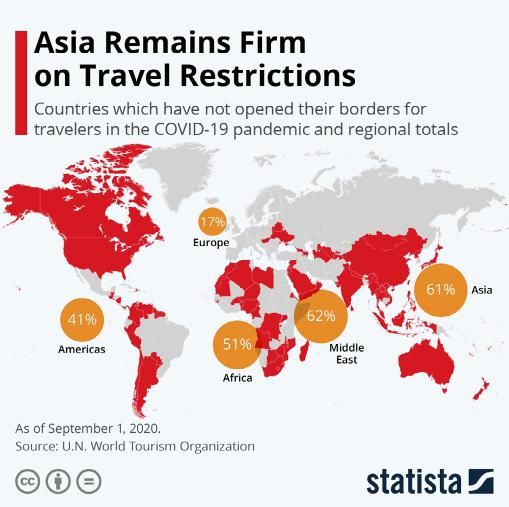
Updates in Destination Queenstown
 Assumptions
Scenario Updates
In this demand scenario we have reviewed the Tourism Export Council of New Zealand’s roadmap and taken note
of their predictions but not moved our border opening horizons, instead we urge readers to assess and take note
of all three potential scenarios – optimistic, mid case and conservative. We have adjusted the expected recovery
for the domestic market to be in-line with the stronger than expected demand from domestic tourism and the
better than expected economic conditions.

Scenarios
Queenstown – All markets

                                                                                                                   6 | Visitor Demand Mapping for Queenstown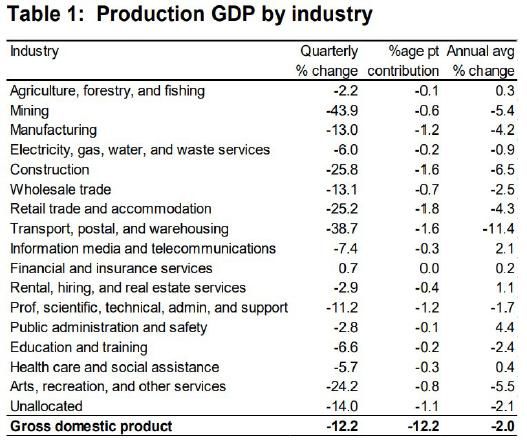
Queenstown – All Markets Optimistic Scenario

Queenstown – All Markets Conservative Scenario

                                                 7 | Visitor Demand Mapping for Queenstown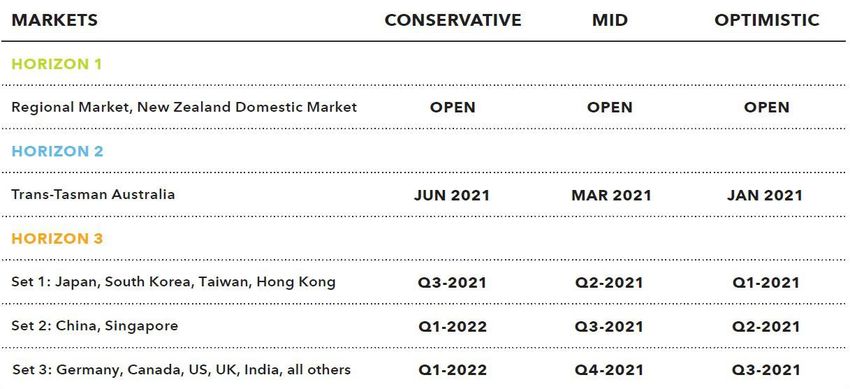
Percentage of Market Spend Recovery Compared to MBIE 2019 – 2024 Forecasts (Monthly, Queenstown
Region)

                                                                                                  8 | Visitor Demand Mapping for Queenstown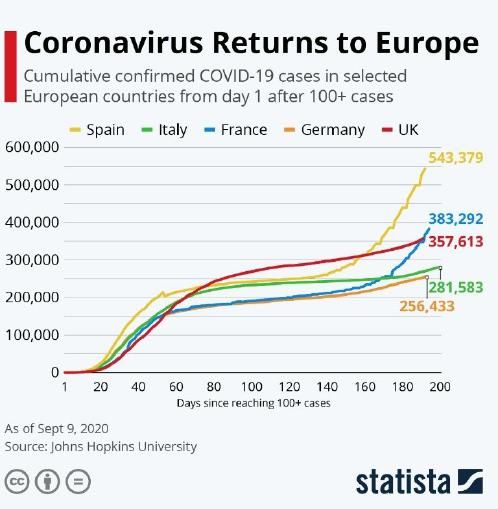
Exhibits
Exhibit 1.
The New Zealand Treasury: Weekly Economic Update: 18 September 2020. Released18 September .

Exhibit 2.
The New Zealand Treasury: Weekly Economic Update: 18 September 2020. Released18 September.

Exhibit 3.
The New Zealand Treasury: Weekly Economic Update: 18 September 2020. Released18 September.
                                                                                              9 | Visitor Demand Mapping for Queenstown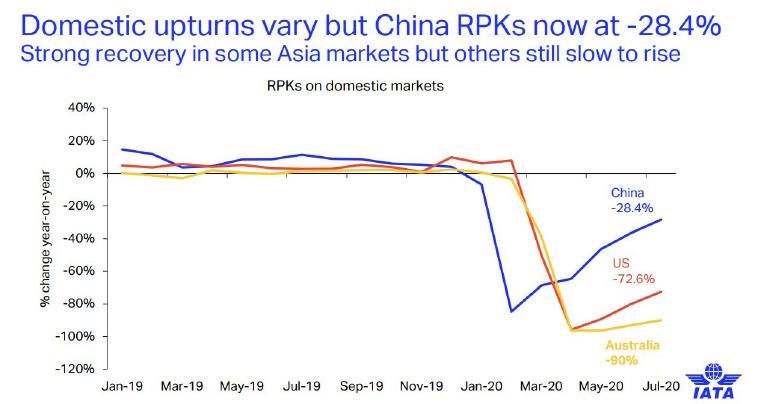
Exhibit 4.
The New Zealand Treasury: Weekly Economic Update. Released 18, September, 2020

 Exhibit 5.
 Bloomberg: Australia Unemployment Drops as Half of Jobs Lost Recovered. Published 17, September, 2020

Exhibit 6.
Statista: US Retail Sales Return to Pre-Pandemic Levels. Published 18 September 2020                     10 | Visitor Demand Mapping for Queenstown
Exhibit 7.
OECD: OECD Economic Outlook, Interim Report September 2020. Published September, 2020

Exhibit 8.
Ministry of Business, Innovation and Employment. Consumer Spending Dashboard - COVID19 response. Updated
                                                                                                           11 | Visitor Demand Mapping for Queenstown

17 September 2020
Exhibit 9.
IATA: Slow expansion of air travel in July. Published 1 September 2020
Exhibit 10.
IATA: Slow expansion of air travel in July. Published 1 September 2020
Exhibit 11.
IATA: Slow expansion of air travel in July. Published 1 September 2020
12 | Visitor Demand Mapping for QueenstownExhibit 12.
Deep Knowledge Group: COVID-19 Regional Safety Assessment 250 Countries, Regions & Territories. Last
updated 23 August 2020
Exhibit 13.
Statista: Coronavirus Returns to Europe. Published 21 September 2020.
13 | Visitor Demand Mapping for QueenstownExhibit 14.
Statista: COVID-19 TRAVEL RESTRICTIONS Asia Remains Firm on Travel Restrictions. Published 21 September
2020
Exhibit 15.
Tourism Ticker: TECNZ pushes out full tourism recovery. Published 8 September 2020
14 | Visitor Demand Mapping for QueenstownExhibit 16.
Covid-19 WHO bell curves (Current as of 22-09-2020)
(World Health Organisation: WHO Coronavirus Disease (COVID-19) Dashboard. Link
Global
New Zealand
Australia
United States
China
15 | Visitor Demand Mapping for Queenstown
United KingdomIndia
Japan
Germany
Singapore
South Korea
16 | Visitor Demand Mapping for QueenstownSources and
References
1 The New Zealand Treasury: Weekly Economic Update. Released 18, September, 2020 (link)
2 The New Zealand Treasury: Weekly Economic Update. Released 11, September, 2020 (link)
3 Interest.co.nz: The Government has announced new border exceptions that will allow temporary work visa holders
to return to NZ; new exceptions will now also be made to allow partners of NZ citizens and residents to return here.
Published 9, September, 2020 (link)
4 The New York Times: Australia’s First Recession in Decades Signals Tougher Times to Come. Published 2,
September, 2020 (link)
5 OECD: OECD Economic Outlook, Interim Report September 2020. Published September, 2020 (link)
6 Bloomberg: Australia Unemployment Drops as Half of Jobs Lost Recovered. Published 17, September, 2020 (link)
7 The New York Times: China’s Exports are surging away. Published 31 August 2020 (link)
8 The New York Times: The economic hit from the virus has been more than four times worse than the financial crisis.
(link)
9 Bloomberg: Bloomberg Trade Tracker Surges Back to Normal as Recovery Builds. Updated 17 September 2020.
(link)
10 Ministry of Business, Innovation and Employment. Consumer Spending Dashboard - COVID19 response. Updated
17 September 2020
11 IATA: Slow expansion of air travel in July. Published 1 September 2020. (link)
12 Bloomberg: Singapore Air Cuts 20% of Workforce as Virus Smashes Travel. Published 10 September 2020. (link)
13 Bloomberg: Don’t Expect Travel Between Australia and New Zealand in 2020. Published 20 September 2020. (link)
14 Tourism Ticker: Air NZ announces bottom line loss of $454m. Published 27 August 2020 (link)
15 Deep Knowledge Group: COVID-19 Regional Safety Assessment 250 Countries, Regions & Territories. Last
updated 23 August 2020 (link)
17 | Visitor Demand Mapping for Queenstown
16 World Health Organisation: Draft landscape of COVID-19 candidate vaccines. Last updated 21 September 2020.
(link)
17 Bloomberg: New Antibody Tests Offer Better Snapshot of Covid-19 Immunity. Published 22 August 2020 (link)
18 Ministry of Business, Innovation and Employment. Monthly Regional Tourism Estimates (MRTEs). July 2020 figures.
(link)
19 ASB: Quarterly Economic Forecast Groundhog Day. Published September 2020. (link)
20 Airbnb Newsroom. Airbnb poised to help drive New Zealand tourism recovery: Oxford Economics. Published 16
August 2020. (link)
21 Tourism New Zealand. Impact of the COVID-19 pandemic on intentions to travel among Australian consumers.
Published 1 August 2020. (link)22 Radio New Zealand: How far off a trans-Tasman bubble are we now? Published 20 September 2020 (link)
23 Statista: Coronavirus Returns to Europe. Published 21 September 2020. (link)
24 The New York Times: New studies underscore the gravity of Britain’s surge. (link)
25 UNWTO: INTERNATIONAL TOURIST NUMBERS DOWN 65% IN FIRST HALF OF 2020, UNWTO REPORTS. Published
15 September 2020. (link)
26 Statista: COVID-19 TRAVEL RESTRICTIONS Asia Remains Firm on Travel Restrictions. Published 21 September 2020
(link)
27 Tourism Ticker: TECNZ pushes out full tourism recovery. Published 8 September 2020. (link)
28 Stuff: Impact of strict border controls ‘indefinitely’ considered by Treasury. Published 18 September 2020. (link)
18 | Visitor Demand Mapping for QueenstownYou can also read