Visitor Demand Mapping - for Queenstown Update 4 Published on Wednesday, July 29, 2020
←
→
Page content transcription
If your browser does not render page correctly, please read the page content below

Visitor Demand Mapping
 for Queenstown                     Update 4

 Published on Wednesday, July 29, 2020

                                               1 | Visitor Demand Mapping for Queenstown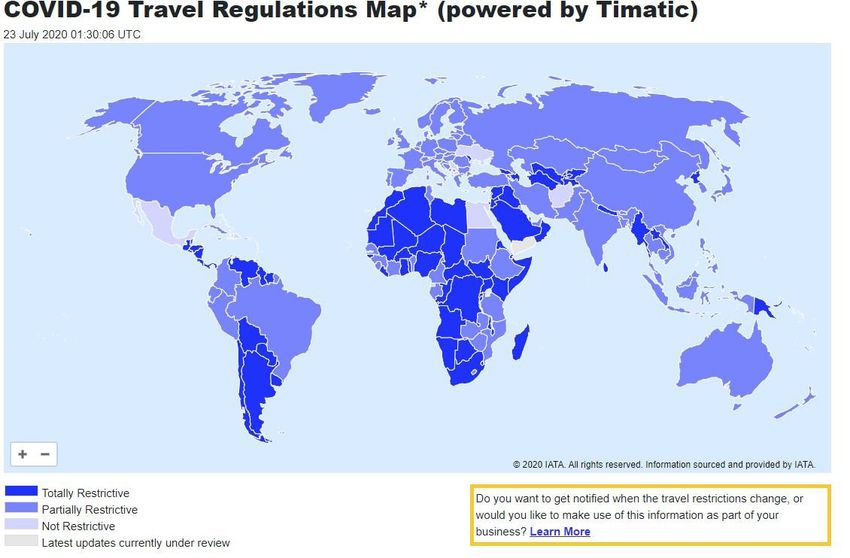
This is an update to the Visitor Demand Mapping for Queenstown-Lakes (2020 to 2024) report
published on Thursday, May 14, 2020. You can get the full version of the earlier report here.

Recent developments to factors
 that impact visitation to Queenstown
New Zealand economy
The New Zealand economy appears to be inching in the positive direction. Activity indicators from the BNZ-
BusinessNZ Performance of Manufacturing and Services Indexes and Performance of Services Index (PSI)
rebounded into positive figures, the New Zealand Activity Index (NZAC) (exhibit 1) shows a continuing recovery
down just 0.9% compared to June 2019, housing sales rebounded to January 2020 level and high level
indications of retail spending, traffic movements and electricity demand have all nearly returned to pre-COVID
levels during July (exhibit 2)1.

In contradiction to the positive signs, employment indicators remain negative with the numbers of income
support still increasing to now stand at 211,000 people in week-ending 24 July, up 2,300 on the previous week
(17 July 2020) (exhibit 3)2. It is likely that many economic indicators listed above are supported by government
and bank support measures, including the Wage Subsidy Scheme, the Small Business Cash Flow scheme,
mortgage repayment holidays and the Reserve Bank of New Zealand’s (RBNZ) large scale asset purchase program.

The New Zealand Government’s total financial commitment to handling the pandemic to date has reached
NZ$62bn3. In The Economist’s latest July Country Report it is predicted that the government’s fiscal account will
record a 12.2% deficit of GDP in 2020 and by 2024 it will gradually narrow to 3.1%.

The closure of Tiwai Point will have an impact on the New Zealand economy and in particular the Southland
region4. The production of basic aluminium adds about $500 million to Southlands economy annually which is
around 10% of Southland’s total GDP. This will directly impact Queenstown’s drive market.

The Farm Gate Milk Price season forecast was upgraded for the coming 20-21 season to a lower limit of $5.90
per kg from the previous $5.40 per kg due to dairy consumption in China increasing and the general Chinese
economy recovering1.

Australia economy
Like New Zealand, many of Australia’s economic indicators are showing positive signs with retail sales up 7.1%
on pre-COVID levels2. Employment is slowly rebounding with a 1.7% increase in June partially reversing the 6%
drop experienced in the preceding three months (exhibit 4). The Treasurer’s July Economic and Fiscal Update
revealed expected fiscal deficits of AU$85.8 billion (4.3% of GDP) in 2019/20 and AU$184.5 billion (9.7% of GDP)
in 2020/21.
                                                                                                                       2 | Visitor Demand Mapping for Queenstown

The most significant development in the Australian Economy in July was the announcement of the extension of
the wage subsidy (JobKeeper scheme) which was due to end at the end of September to now finish 28 March
2021 in the hopes that it will prevent a “fiscal cliff”. It’s expected that these extensions represent additional
spending of around AU$20 billion or 1% of GDP.

USA Economy
The USA is still firmly in the grasp of the virus outbreak and this has curtailed the general optimism in the
economy. Spend is continuing to perform strongly with a 7.5% increase since May to be just 1% behind their
value at the start of the year before the outbreak and the stock markets appear to be impervious, finishing its best
quarters performance in more than two decades2. The stock market rally that was experienced is causing concern
about the disparity between the markets and economic reality and was likely buoyed by the largest stimulus
package in history. The Nasdaq rose 30.63%, S&P P500 rose 19.95% and the Dow Jones rose 17.7% (exhibit 5)5.
Housing construction is also recovering to be fractionally behind figures last year with 1.19 million houses being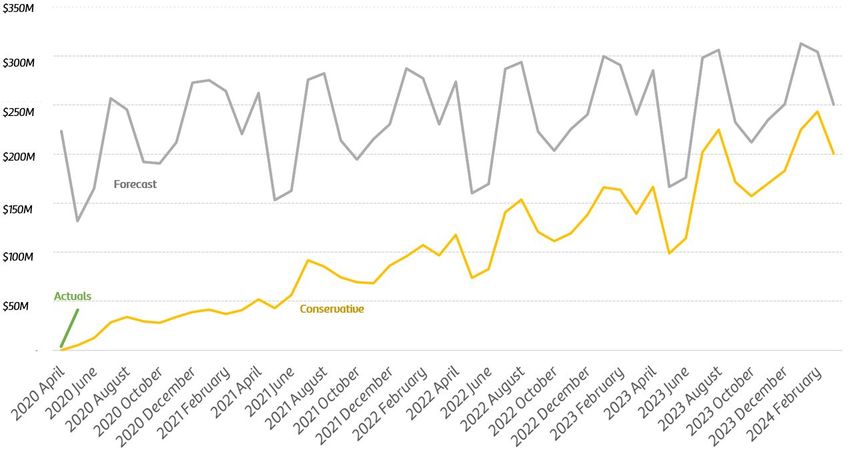
started in June 2020 compared to the 1.23 million in June 2019 indicating that companies are getting back to
work (exhibit 6).

Conversely US jobless claims remain high with over 32 million claims on record at week ending 24 June,
marginally down from the prior week. Consumer sentiment has dived likely on the back of forced re introduction
of lock downs, postponements of reopening in many states as infection numbers sore and waning pent up
demand driven purchasing, all likely to create a slower pace of growth in the coming months.

China Economy
The Chinese economy is performing better than predicted. In the June quarter GDP rebounded 11.5% from the
March quarters 10% fall to be 3.2% higher than the June 2019 quarter1. This is largely driven by the recovery of
industrial recovery, which is up on last year’s figures, and strong performances in investment and retail spend,
although these are still below previous year’s figures and fiscal stimulus is having a huge role in driving this faster
than expected recovery.

While the June quarter showed strong performance, flooding in the south of China, isolated outbreaks of
COVID-19, protest in Hong Kong and escalating tensions between Australia and the USA will make the road to full
economic recovery difficult.

Global Economy
The underlying theme in all the above economic updates is that the majority of positive economic recovery has
been supported by government subsidy and therefore is masking the true economic fallout of the pandemic6.
The International Monetary Fund (IMF) estimates that governments have devoted $11 trillion to pandemic fiscal
responses so far and as fiscal stimulus packages begin to end over the coming months the true economic impact
will begin to be felt.

Queenstown Lakes Economy
The winter school holidays drove an increase in consumer spend compared to the same week in 2019. Total
spend (both domestic and international) for week ending 12 July was down just 4.7% and week ending 19 July
was down 12.11%7. Domestic spend for week ending 12 July was up 37.7% and week end 19 July was up 21.8%
vs same week previous year (exhibit 7)7. The Queenstown Lakes District experienced the fourth largest growth in
domestic spend in the country for the school holiday period vs the same period previous year.

Global Aviation
The International Air Transport Association (IATA) has released its May – June 2020 Airlines Financial Monitor
indicating that the airline industry will post its worst quarterly financial performance ever recorded, as COVID-19
became widespread across all regions (exhibit 8)8. In May, both passenger and cargo demand picked up from
record low levels in April which is expected to continue as countries ease restrictions.
                                                                                                                          3 | Visitor Demand Mapping for Queenstown

Global airline share price indexes lifted in June driven by Northern American airlines share prices increasing
however this was offset by falling prices across Europe and Asian Pacific. Actual operating revenue for North
American airlines is a different story with four major airlines (American Airlines, United, Delta and South West) all
down between 83%-86% in Q2 2020 vs Q2 2019 (exhibit 9). The fact that a majority of passengers are currently
travelling on credit/exchanged tickets means that airlines are operating on no or very little new revenue9.

Aircraft have gradually been reintroduced of out of storage into service, as restrictions ease, with a further 4,109
back in operation globally, an additional 32% of seat capacity vs the previous month. The majority of the world’s
borders still remain either partially or totally restricted (exhibit 10) though which is prohibiting a return to usual
capacity and the total seat capacity is still 35% lower than June last year8.

Oil and jet fuel prices have increased in July following the rebound from the dip in June (exhibit 11). While supply
cuts of OPEC+ continue to be supportive for oil prices, the recovery in oil demand is hampered by the surge in
COVID-19 cases, especially in the United States and Latin America8.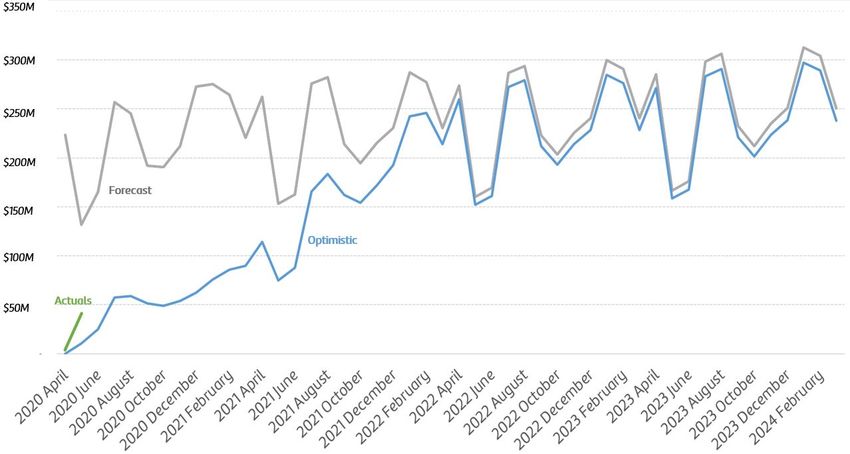
Domestic Aviation
There have been minimal changes to the immediate New Zealand aviation situation with connections between
major airports continuing to be serviced.

Air New Zealand has limited its capacity on inbound international flights with a temporary hold on bookings
starting on 7 July 2020 until 29 July 2020 in order to manage the demand on isolation units in New Zealand11.

Air New Zealand has also introduced an online credit tool to refund customers. Within 24 hours $1.36 million in
credits had been issued with popular rebooking destinations being Queenstown and Auckland12.

Queenstown Aviation
Although not COVID-19 related, on 22 July Christchurch International Airport announced that they have begun
discussions around the potential of building a world-class sustainable airport on 750 hectares of land near Tarras
in Central Otago13. The Christchurch International Airport has secured land and now “long term thinking” can take
place. So far $45 million has been spent on the project.

Epidemiology
As of 24 July 2020, there are 25 candidate vaccines in clinical evaluation - 19 are in phase one, 13 in phase two,
four in phase three and one has been approved for use in limited capacities (in the Chinese Army) 14. Several
of the vaccines in clinical evaluation are showing promising results - two potential vaccines against the virus
from Oxford University and the Chinese company CanSino have both triggered immune responses in hundreds
of humans without dangerous side effects. Pfizer and BioNtech’s early trials have received similar results with
antibodies being produced after immunisation and no significant side effects.

There is a further 141 candidate vaccines in preclinical evaluation (not yet for trial in humans).

Domestic Market
All regions saw an increase in domestic tourism compared to last year’s school holidays with the number of kiwis
travelling around the country peaking on 11 July at 550,000 people travelling outside their home region, the
highest levels of domestic tourism since lockdown 15. The Queenstown area experienced this peak on 11 July with
more tourists in the region than Queen’s Birthday Weekend (exhibit 12) and a 43.2% increase in domestic tourist
numbers in the school holiday period compared to the 2019 winter school holidays.

Research commissioned by Tourism New Zealand around Domestic Audience Sentiment found that 64% of those
surveyed intend to holiday with NZ in the next 12 months and 43% intend to spend more than they typically
would on a domestic holiday 16. 70% believe that there was good or excellent value for money in a domestic
holiday while only 28% believed it was expensive and lacked value for money. Most New Zealanders were
intending to take more frequent domestic holidays rather than longer breaks and a stronger intent to holiday was
found in Aucklanders, new migrants and high income groups.
                                                                                                                     4 | Visitor Demand Mapping for Queenstown

Colliers released a report showing that in Q2 2020 the New Zealand hotel market had rebounded to be “one of
the best of the world”17. The 29 hotels and 6,000 rooms currently in use as managed isolation are contributing
to this strong performance (close to 40% of all Auckland hotel rooms are being utilised for isolation, followed
by Christchurch (31%), Rotorua (20%) and Wellington (3%)). Domestic leisure travel has also contributed to
this performance though with monthly occupancy increasing to between 20% to 35% by the end of June and
indications the July school holidays will lift occupancy in many main regions to over 50%.

Australia Market
As COVID-19 infections in Australia continue to increase it seems the bubble has been firmly put on hold until the
situation can be brought under control.

The trans-Tasman bubble is still in the pipeline though with confirmation from both Australia and New Zealand at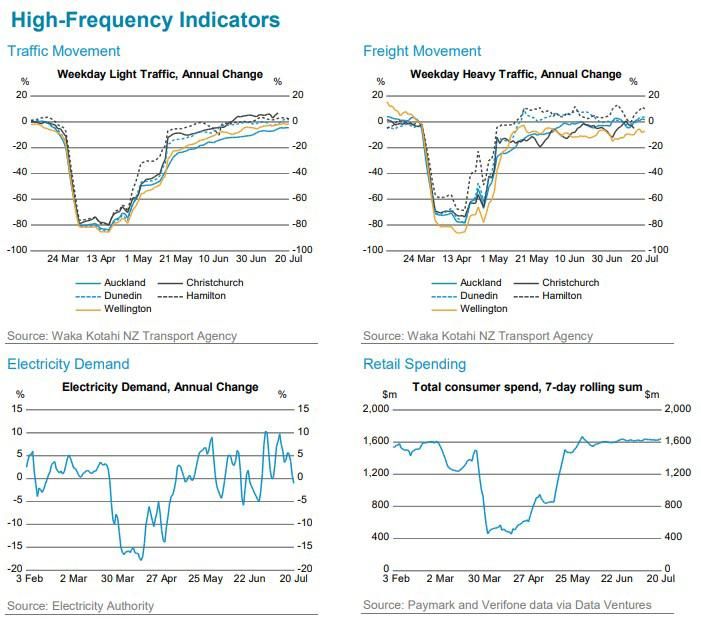
the annual Closer Economic Relations discussions last week noting that the travel bubble would be a “positive
step for both economies” and that the bubble would be introduced “as soon as it is safe to do so”18.

China
In China, airline passenger levels have grown steadily and now sit at 50 percent of pre-crisis levels. Hotel
occupancy rates have also improved since the depths of the crisis and are now back to 60 percent of last year’s
levels 19.

Domestic travel is now positioned to accelerate with the summer season and national holidays approaching.
Research conducted by McKinsey has found that the more risk adverse groups are now planning holidays (like
families) and in general there is more positive sentiment across all geographies and demographics surveyed.

Europe
Border restrictions eased throughout the Europe with the EU’s recommendation to reopen EU internal borders
on 15 June 20. This has resulted in an increase in short haul intra Europe flights (exhibit 13) with most travel being
related to a holiday (coinciding with summer holidays) and visiting friends and family rather than business 20.

                                                                                                                         5 | Visitor Demand Mapping for Queenstown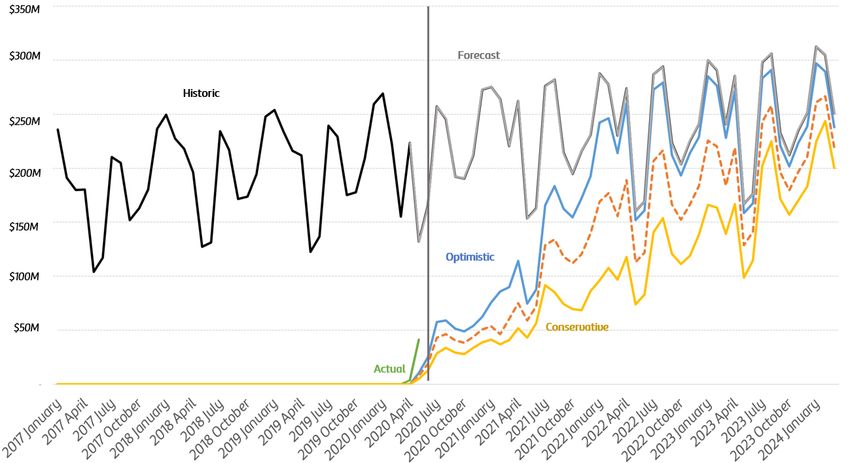
Updates in Destination Queenstown
 Assumptions
Scenario Updates

There have been no changes to the expected scenario situations. It should be noted however that we have
included our first “actual” line of tourism spend based on the April and May 2020 MRTE data release which has
become part of the green “actual” line. Tourism spend in Queenstown was a lot better than expected due to
the earlier than predicted move down the alert levels and the change to allow travel at alert level two.

Scenarios
Queenstown – All markets

                                                                                                                6 | Visitor Demand Mapping for Queenstown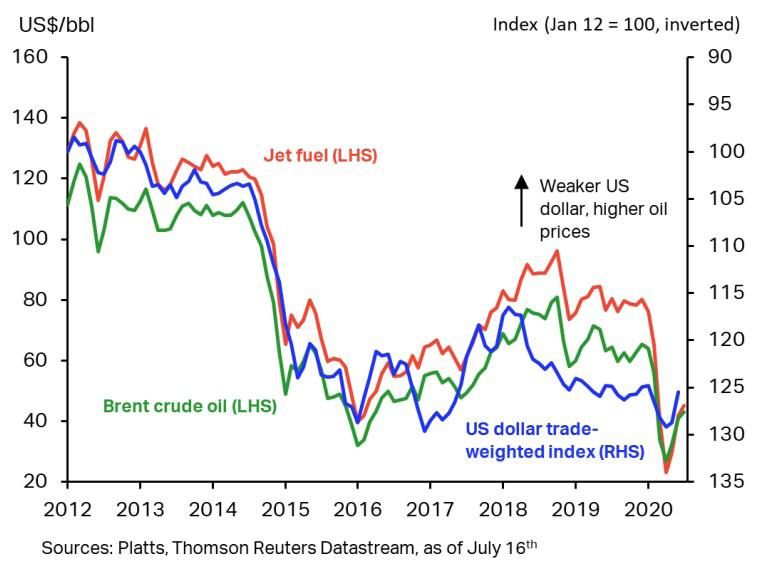
Queenstown – All Markets Optimistic Scenario

Queenstown – All Markets Conservative Scenario

                                                 7 | Visitor Demand Mapping for Queenstown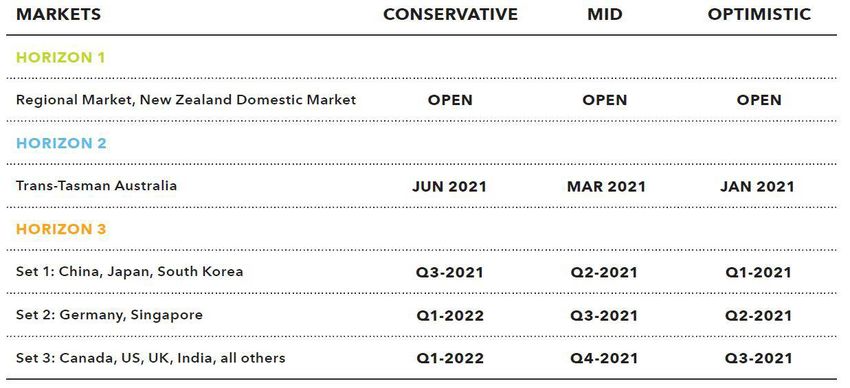
Percentage of Market Spend Recovery Compared to MBIE 2019 – 2024 Forecasts (Monthly, Queenstown
Region)

                                                                                                  8 | Visitor Demand Mapping for Queenstown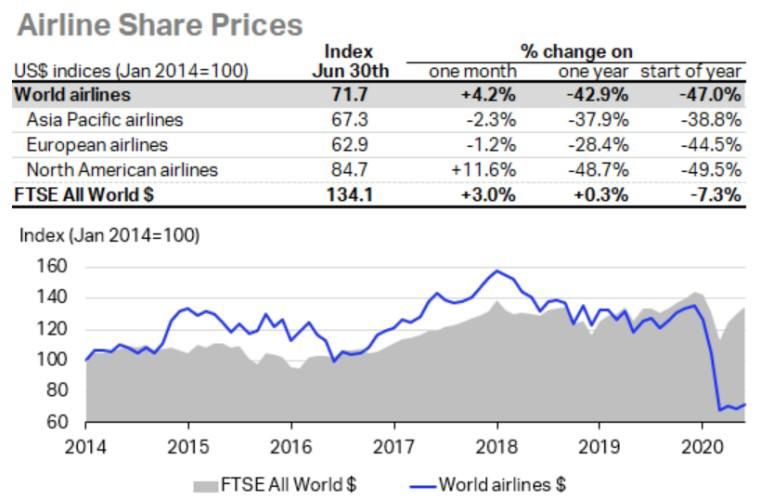
Exhibits
Exhibit 1.
The New Zealand Treasury: Weekly Economic Update: 24 July 2020. Released 24 July 2020.

Exhibit 2.
The New Zealand Treasury: Weekly Economic Update: 24 July 2020. Released 24 July 2020

                                                                                         9 | Visitor Demand Mapping for Queenstown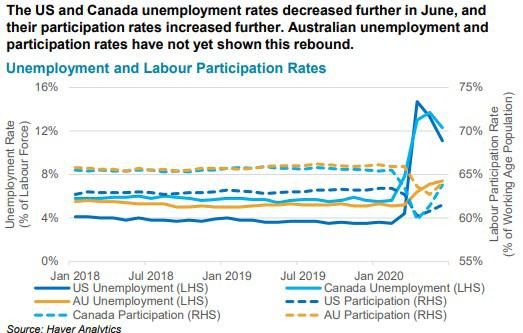
Exhibit 3.
The New Zealand Treasury: Weekly Economic Update: 24 July 2020. Released 24 July 2020

Exhibit 4.
The New Zealand Treasury: Weekly Economic Update: 24 July 2020. Released 24 July 2020

 Exhibit 5.
 Statistia: STOCK MARKET: U.S. Stock Market Wraps Up Best Quarter in Decades. Realsed 1 July 2020

                                                                                                    10 | Visitor Demand Mapping for Queenstown
Exhibit 6.
Statistia: Housing Construction Begins to Recover. Released July 2020.
Exhibit 7.
Ministry of Business, Employment and Innovation: Consumer Spending Dashboard - COVID19 response.
Updated Week ending 24 July 2020.
Exhibit 8.
IATA: Airlines Financial Monitor May-June 2020. Released 21 July 2020.
11 | Visitor Demand Mapping for QueenstownExhibit 9.
Statista: AIRLINES U.S. Airlines Hit Turbulence Amid COVID-19 Pandemic. Released 23 July 2020
Exhibit 10.
IATA: Airlines Financial Monitor May-June 2020. Released 21 July 2020
12 | Visitor Demand Mapping for QueenstownExhibit 11. IATA: Airlines Financial Monitor May-June 2020. Released 21 July 2020. Exhibit 12. Data Ventures/ TNZ: School Holidays Domestic Tourism Report. Released 21 July 2020 Exhibit 13. IATA: Intra-Europe leading the initial recovery in international flights. Released 10 July 2020. 13 | Visitor Demand Mapping for Queenstown
Exhibit 12.
Covid-19 WHO bell curves (Current as of 29-07-2020)
(World Health Organisation: WHO Coronavirus Disease (COVID-19) Dashboard. Link

Global

New Zealand

Australia

United States

China
                                                                                 14 | Visitor Demand Mapping for Queenstown

United Kingdom
India
Japan
Germany
Singapore
South Korea
15 | Visitor Demand Mapping for QueenstownSources and
References
1 The New Zealand Treasury: Weekly Economic Update: 24 July 2020. Released 24 July 2020. (link)
2 The New Zealand Treasury: Weekly Economic Update: 17 July 2020. Released 17 July 2020. (link)
3 The Economist: New Zealand Country Report (June): Release 3 July 2020
4 Westpac: Weekly Economic Commentary: No shelter for the smelter. Released 20 July 2020 (link)
5 Statistia: STOCK MARKET: U.S. Stock Market Wraps Up Best Quarter in Decades. Realsed 1 July 2020 (link)
6 Bloomberg: Covid Fear Will Keep the World in a Slump, Peter Orszag. Released 13 July 2020. (link)
7 Ministry of Business, Employment and Innovation: Consumer Spending Dashboard - COVID19 response. Updated
Week ending 24 July 2020. (link)
8 IATA: Airlines Financial Monitor May-June 2020. Released 21 July 2020. (link)
9 Statista: AIRLINES U.S. Airlines Hit Turbulence Amid COVID-19 Pandemic. Released 23 July 2020
10 Bloomberg: How Coronavirus Will Forever Change Airlines and the Way We Fly. Published April 2020. (link)
11 Air New Zealand Media Releases: Air New Zealand helps manage flow of international arrivals. Released 22 July
2020. (link)
12 Air New Zealand Media Releases: Thousands use Air New Zealand credit tool. Released 21 July 2020. (link)
13 Christchurch Airport Media: Christchurch airport unveils new long term proposal for mid to lower south island.
Released 22 July 2020. (link)
14 World Health Organisation: Draft landscape of COVID-19 candidate vaccines. Updated 24 July 2020. (link)
15 Data Ventures/ TNZ: School Holidays Domestic Tourism Report. Released 21 July 2020. (link)
16 Tourism New Zealand: Domestic Tourism Sentiment. Released July 2020. (link)
17 Colliers: New Zealand Hotel Market Snapshot July 2020. Released July 22 2020. (link)
16 | Visitor Demand Mapping for Queenstown
18 Behive Media Releases: Joint Ministerial Statement: New Zealand-Australia trade talks. Released 23 July 2020.
(link)
19 McKinsey & Company: China’s travel recovery gains steam: How families are planning their summer vacations.
Released July 2020. (link)
20 IATA: Intra-Europe leading the initial recovery in international flights. Released 10 July 2020. (link)You can also read