Visitor Demand Mapping - for Queenstown Update 5 Published on Wednesday, August 26, 2020
←
→
Page content transcription
If your browser does not render page correctly, please read the page content below

Visitor Demand Mapping
 for Queenstown                    Update 5

 Published on Wednesday, August 26, 2020

                                              1 | Visitor Demand Mapping for Queenstown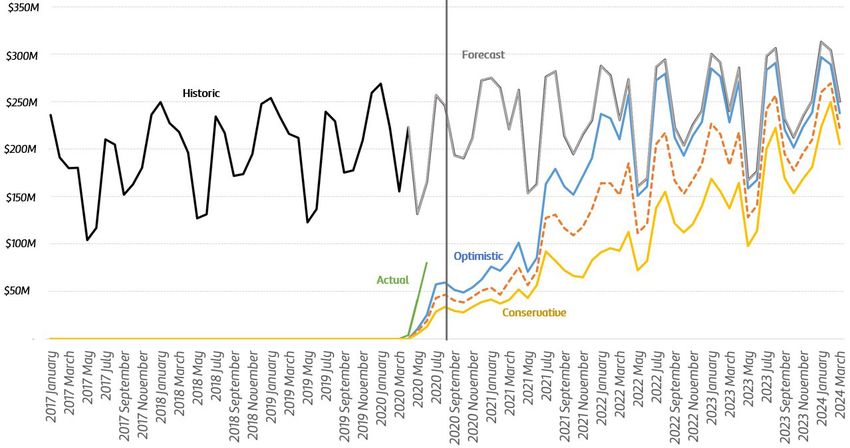
This is an update to the Visitor Demand Mapping for Queenstown-Lakes (2020 to 2024) report
published on Thursday, May 14, 2020. You can get the full version of the earlier report here.

Recent developments to factors
 that impact visitation to Queenstown
New Zealand economy
With the reemergence of community transmission in New Zealand and the introduction of alert level three in
Auckland and level two in the rest of the country its estimated that for each week about $300m of economic
activity is lost, but some of this will be delayed spend rather than completely cancelled1. Currently no major
forecasters have moved their predictions on the premise that this escalation of alert levels is likely to be shorter
and less severe that those experienced in the May-June period.

Prior to the escalation in alert levels, a lot of the high-level economic indicators looked encouraging for the
September quarter2. The latest NZ Activity Index was up 2% on the same month last year and traffic movement
was up 10% nationally. Consumer spend was performing particularly well - electronic transactions were up 5%
and total consumer spend was up 9.9% on July last year.

Spend over the school holidays grew from 1.1% growth between 2018 to 2019 to 10.7% growth between 2019
to 2020. With the reintroduction of alert level three in Auckland this high-level economic data has trended
downward again (exhibit 1)3.

The major exception to the upward trend continues to be unemployment statistics which are trending steadily
upwards, last week the number of people receiving income support was 216,800 up 1,800 on the previous week
(exhibit 2)2.

Business confidence is slipping providing supporting evidence that the post covid bounce may be over2. Business
confidence slid 10 points in the prelim data from the ANZ Business Outlook (exhibit 3) and consumer confidence
(the ANZ-Roy Morgan Consumer Confidence Index) remained unchanged for July, well below its historical
average.

In The Economist’s monthly New Zealand Country Report, real GDP growth estimates were once again pulled
down from -4.4% in 2020 to -4.9% driven by a fall in private consumption, investment and exports4.

In general developments the wage subsidy was extended for businesses affected by the new lockdown measures.
Businesses may be eligible for a two-week wage subsidy if their revenue has declined by 40% for at least 14 days
between 12 August and 10 September compared to last year2.

The Reserve Bank announced the Large Scale Asset Purchases (LSAP) programme will buy up to $100bn of NZ
                                                                                                                       2 | Visitor Demand Mapping for Queenstown

Government Bonds, Local Government Funding Agency (LGFA) Bonds and NZ Government Inflation-Indexed
Bonds in the secondary market5. The aim is to inject money into the economy with lower borrowing costs for
households and businesses. The Reserve bank has also announced that the mortgage deferral scheme will be
extended to 31 March 20216.

Australia economy
Confidence indicators have deteriorated in July following an improvement in June2. Concerningly the
deterioration happened prior to the stricter lockdowns coming into action in Melbourne which will likely result in
a continued slide in August. Consumer sentiment also dropped to close to April levels (when the country was in
lock down) following a strong recovery in the May/ June period.

Employment and hours worked both rose 0.9% and 1.3% respectively (data is prior to Melbourne lockdowns) but
unemployment also rose to 7.5% and the Treasury Secretary has warned that unemployment will stay above the
6% figure for more than four years. Unsurprisingly there is strong relationship between COVID-19 containment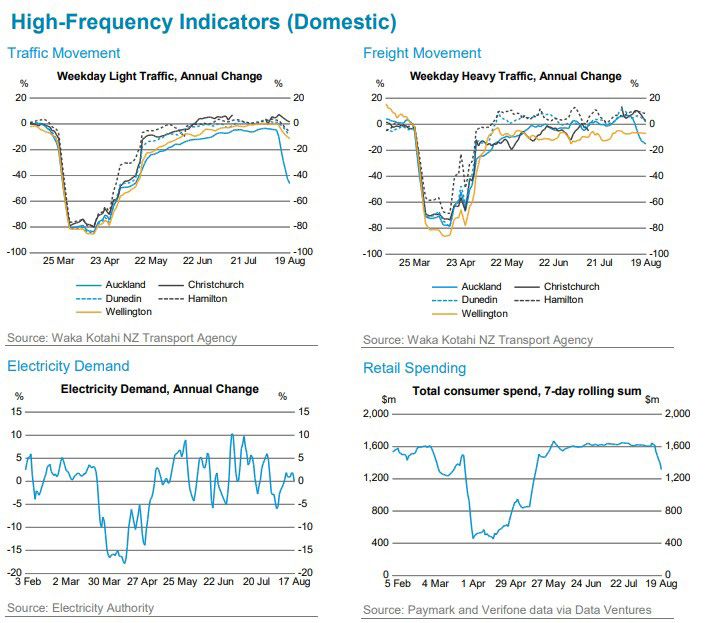
status and employment statistics in WA, which is relatively sealed off from the rest of Australia and has the virus
contained, where employment indicators are improving.

USA Economy
The US economy continues to baffle many as records continue to be broken – US bankruptcies are at a ten year
high for the year to date, the highest since 2010 (exhibit 4)7. The New York Times headline read “This Market Is
Nuts” as the S&P 500 hit record highs despite widespread unemployment and economic struggles8.

It is believed that the USA is past its peak with the virus, with infection rates declining 16% over the past two
weeks. Employment levels are on the rise with 1.8 million jobs added in July although there are an estimated 28
million on unemployment benefits in the USA2. The USA experienced a 9.5% GDP growth drop during the June
quarter after a 1.3% drop in the March quarter.

China Economy
China is continuing to show signs of recovery2. GDP growth for the June quarter moved back into the positive
territory with a 3.2% growth following a 6.8% decline in the previous quarter.

Retail sales continue to lag though with spend down around 1.1% compared to the same period the previous
year, but investment, production and exports all performed well and would have likely contributed further if it
weren’t for widespread heavy rain and flooding throughout China.

Global Economy
The rest of the world is not showing the same recovery signs as China though, with the release of the June quarter
GDP growths making the impacts of COVID-19 feel much more concrete2. Some countries that experienced the
largest declines were the UK, down a huge 20.4%, the Euro area, down 12.1%, Japan, down 7.8%, and Thailand,
down 9.7%. Interestingly in Sweden where no formal lockdown was introduced their GDP contracted the most out
of Scandinavian countries, down 8.6% compared to Finland’s 3.2% and Denmark’s 7.4%.

Queenstown Lakes Economy
According to Infometrics, Otago’s economy is the hardest hit out of all New Zealand regions in their June 2020
Quarterly Economic Monitor which showed it was down 15.6% compared to the same period prior year9.

Queenstown has topped the list as one of the worst hit urban areas in Centrix’s report with 11.9% of households
with home loads having agreed lower repayments with their banks10.

Global Aviation
IATA release their July 2020 survey of airline CFOs and Heads of Cargo confirming that the aviation industry
experienced the sharpest quarterly fall in demand and profits since the global financial crisis11. Their expectations
relating to the return of passenger demand to a 2019 level was also surveyed, with 19% believing recovery will be
6-12 months, 39% believe 12-24 months and 42% believe it will be longer (exhibit 5). Encouragingly 42% believe
                                                                                                                        3 | Visitor Demand Mapping for Queenstown

that the first region to recover will be the Asia-Pacific region (exhibit 6).

It appears the absolute bottom of passenger seat capacity was reached in the Aviation world with very small
upward trends holding true since the bottom in April 2020 (exhibit 7)12.

The recovery will be long though with the Stock Exchange of Thailand suspending shares in Thai Airways after
auditors refused to sign off the company’s accounts as a going concern13. Meanwhile, Cathay Pacific reported a
98.7% year-on-year decline in passenger numbers in July.

Closer to home due to Australian Government restrictions Air New Zealand further extended its cap of
international arrivals until the 24 of October14.

Domestic Aviation
Due to the reintroduction of level two restrictions around New Zealand and level three restrictions Air New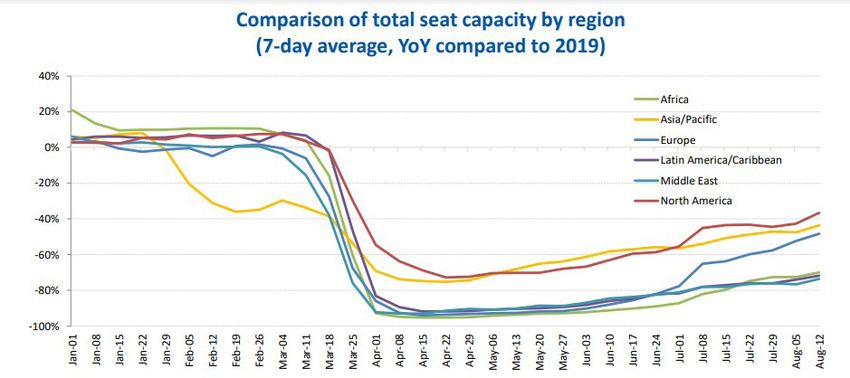
Zealand reduced their frequency and capacity of flights scheduled in and out of Auckland but the rest of the
country’s network remained the same15. Additionally, under level two restrictions they have reintroduced physical
distancing and the wearing of masks.

Auckland Airport released their annual financial results, their chair stating the past six months had been the most
challenging in Auckland Airport’s 54 year history16. Total number of passengers decreased to 15.5 million, down
26.5% on the previous year. International passenger numbers (including transits) were 8.5 million while domestic
passenger numbers were 7 million. Revenue was down 23.7% for the year.

Queenstown Aviation
The Queenstown Airport Corporation released its financial year end results17. The Queenstown Airport
experienced a 19% fall in passenger movements to 1.87 million movements. That comprised an 11% drop in
international passenger movements to 583,219 and a 23% fall in domestic passenger movements to 1.29 million.
Queenstown Airport noted that domestic air travel to and from Queenstown had “steadily returned” since air
connectivity to the region resumed in May 2020.

Epidemiology
As of 24 August 2020, there are 30 candidate vaccines in clinical evaluation which is an additional 6 vaccines
since our last update on 24 July18. 21 are in phase one, 13 in phase two, eight in phase three and two have been
approved in very limited applications. Of the two approved vaccines, one has been approved and is in testing in
the Chinese military and the other is a Russian vaccine announced on 11 August which skipped all phase three
trials and has been renamed “Sputnik”. In summary 32 candidate vaccines are being tested in human trials around
the world.

Advances continue to be made toward developing rapid development testing technology. The US National
Institutes of Health’s Rapid Acceleration of Diagnostics (RADx) initiative received a huge boost, announcing a
further $248.7 million of investment toward the rollout of seven different COVID-19 rapid testing point of care
diagnostics19. These seven tests had been selected from over 600 options and most of the seven can provide
results in under 30 minutes, some in under 15 minutes.

In the UK the government has announced that they will be rolling out two point of care COVID-19 diagnostics in
nursing homes at the start of September, both can provide results in under 90 minutes

Domestic Market
As Queenstown’s largest single geographic source of domestic visitors, Auckland, is in alert level three the
Queenstown domestic visitor spend can be expected to be down. Year end June 2020, Auckland’s expenditure in
the Queenstown region contributed around 26% of total domestic expenditure20.

As of data recorded up until the 17 August, population mobility in the Auckland region had reduced 26.7%
compared to the same week the previous year (and level three restrictions came into place on the 12 August, so
this is partial data)21.
                                                                                                                       4 | Visitor Demand Mapping for Queenstown

In the June 2020 MRTE data, the Queenstown region received $69 million domestic expenditure and a further
$11 million international spend which is 43% down compared to June last year22. Queenstown was the fifth largest
RTO in terms of total tourism spend in the country behind Auckland, Christchurch, Wellington and Hamilton/
Waikato.

Australia Market
Despite Melbourne continuing to have high case numbers, a recent report from Luxury Escapes states people are
starting to consider their post COVID holidays with New Zealand receiving a 290% spike in interest compared to
the yearly average. Interstate travel demand has also increased, with interest in local package travel up as well23.

European Markets
Europe continues to remain tentatively open for tourism despite resurgences of COVID-19 across many countries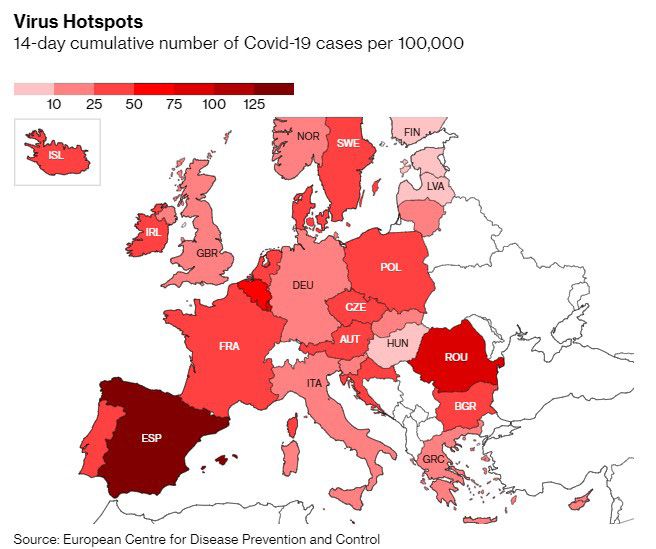
and popular tourist destinations (exhibit 9) 24. The recent increase has been put down to an increase in social
gatherings and travelers moving freely during the peak summer holiday period. Despite the increase in cases
across Europe, German Chancellor Angela Merkel is urging European leaders to work together to avoid reviving
lockdowns due to the impact on the economy instead calling for unified action.

McKinsey & Company has released a report on changes in the travel industry post COVID-1925. The European
market has been reopening since mid-June and this report covers key findings around what the new normal for
the industry focusing their data around the German traveler. The key findings were that appetite for travel has
returned, albeit in the form of higher demand for domestic destinations and drive destinations. Travelers are
also incredibly sensitive to the slightest change in pandemic situation, there has been an increase in last minute
bookings and travelers returning to destinations that they have visited pre covid, as well as an increase in demand
for nature experiences and fewer city destinations.

Global Markets
The UNTWO continues to push for the restart of tourism in a safe and controlled manner26. They have estimated
that between January and May, the sudden and rapid fall in tourist arrivals cost an estimated $320 billion which is
three times greater than the impact of the Great Recession of 2007-2009 on the tourism sector.

                                                                                                                      5 | Visitor Demand Mapping for Queenstown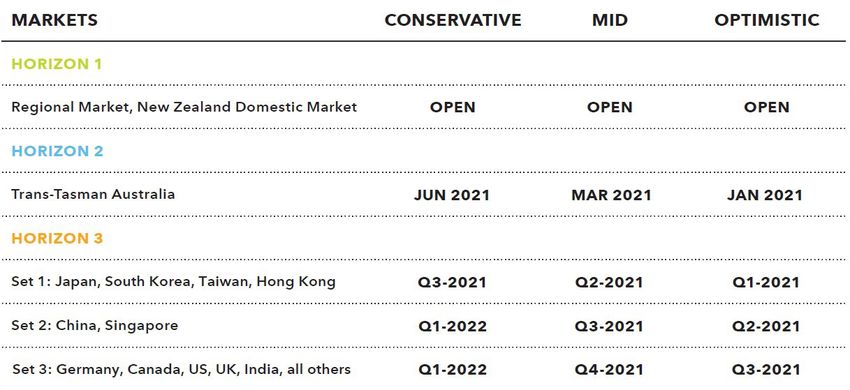
Updates in Destination Queenstown
 Assumptions
Scenario Updates
It is becoming more apparent that with New Zealand’s elimination approach to handling COVID-19, it will only be
countries that have the virus well under control that we will open our international borders to. Based on this it can
be assumed that geographically isolated countries, likely island nations, will be easier to control the virus in. We
have updated our estimated market restart dates inline with this, meaning that China has moved into set two of
the international markets and Germany has been moved into set three.

Scenarios
Queenstown – All markets

                                                                                                                        6 | Visitor Demand Mapping for Queenstown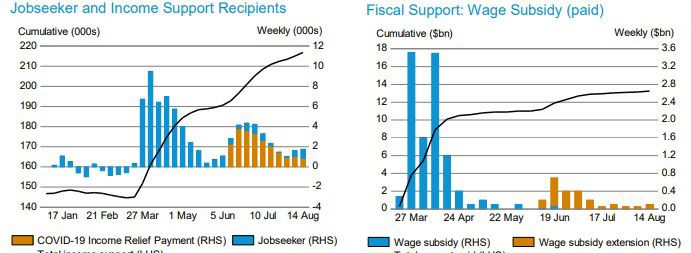
Queenstown – All Markets Optimistic Scenario

Queenstown – All Markets Conservative Scenario

                                                 7 | Visitor Demand Mapping for Queenstown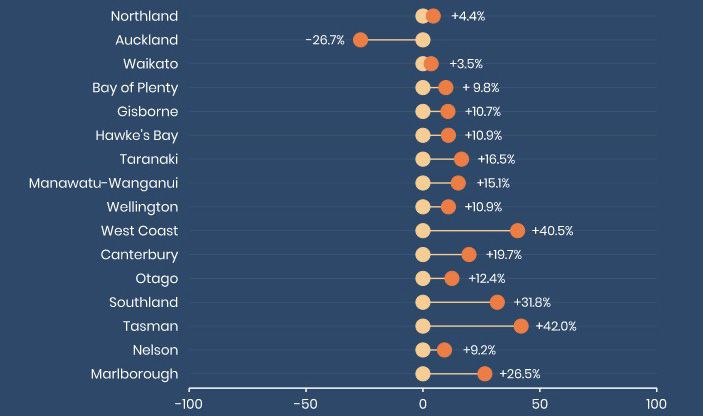
Percentage of Market Spend Recovery Compared to MBIE 2019 – 2024 Forecasts (Monthly, Queenstown
Region)

                                                                                                  8 | Visitor Demand Mapping for Queenstown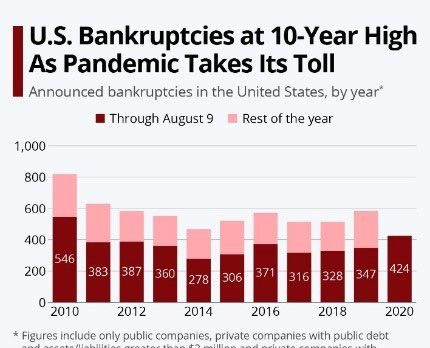
Exhibits
Exhibit 1.
The New Zealand Treasury: Weekly Economic Update: 21 August 2020. Released 21 August 2020.

 Exhibit 2.
 The New Zealand Treasury: Weekly Economic Update: 21 August 2020. Released 21 August 2020.

                                                                                              9 | Visitor Demand Mapping for Queenstown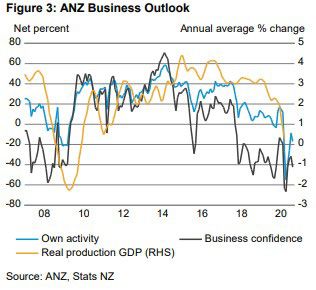
Exhibit 3.
The New Zealand Treasury: Weekly Economic Update: 21 August 2020. Released 21 August 2020.

Exhibit 4.
Statista: U.S. Bankruptcies at 10-Year High As Pandemic Takes Its Toll. Published 13 August 2020

 Exhibit 5.
 IATA: July 2020 SURVEY AIRLINE BUSINESS CONFIDENCE INDEX. Published August 2020
                                                                                                   10 | Visitor Demand Mapping for Queenstown
Exhibit 6.
IATA: July 2020 SURVEY AIRLINE BUSINESS CONFIDENCE INDEX. Published August 2020
Exhibit 7.
ICAO: Effects of Novel Coronavirus (COVID-19) on Civil Aviation: Economic Impact Analysis. Published 12
August 2020
Exhibit 8.
Data Ventures: COVID-19 Population Movement Report 17 August. Released 17 August 2020.
11 | Visitor Demand Mapping for QueenstownExhibit 9.
Bloomberg: Europe Battles Virus Spike With No Appetite for New Lockdowns. Published 21 August 2020
Exhibit 10.
Covid-19 WHO bell curves (Current as of 29-07-2020)
(World Health Organisation: WHO Coronavirus Disease (COVID-19) Dashboard. Link
Global
New Zealand
12 | Visitor Demand Mapping for Queenstown
AustraliaUnited States
China
United Kingdom
South Korea
Japan
13 | Visitor Demand Mapping for Queenstown
GermanyIndia
Singapore
14 | Visitor Demand Mapping for QueenstownSources and
References
1 Westpac: Weekly Economic Commentary: COVID returns to Aotearoa. Released 17 August 2020 (link)
2 The New Zealand Treasury: Weekly Economic Update: 21 August 2020. Released 21 August 2020. (link)
3 Marketview: National Consumer Spending Series: July 2020.
4 The Economist: New Zealand Country Report (July): Release 3 August 2020
5 The Reserve Bank of New Zealand: Large Scale Asset Purchases. Updated 12 August 2020 (link)
6 S&P Global: New Zealand central bank extends mortgage deferral scheme to March 2021. Released 17 August
2020 (link)
7 Statista: U.S. Bankruptcies at 10-Year High As Pandemic Takes Its Toll. Published 13 August 2020 (link)
8 The New York Times: This Market is Nuts. Published 18 August 2020 (link)
9 The Otago Daily Times. Otago hardest hit by lockdown. Published 20 August 2020 (link)
10 Stuff: ‘Staggering’ number of households behind on their mortgages. Published 19 August 2020 (link)
11 IATA: July 2020 SURVEY AIRLINE BUSINESS CONFIDENCE INDEX. Published August 2020 (link)
12 ICAO: Effects of Novel Coronavirus (COVID-19) on Civil Aviation: Economic Impact Analysis. Published 12 August
2020. (link)
13 Reuters: Thai Airways shares suspended after auditors decline to sign off on accounts. Published 14 August 2020
(link)
14 Air New Zealand Media Releases: Air New Zealand update on Australia flight. Published 13 August 2020. (link)
15 Air New Zealand Media Releases: Air New Zealand update on flexibility and domestic schedule. Published 14
August 2020. (link)
16 Auckland Airport: 2020 Annual Results Media Release. Published 20 August 2020 (link)
15 | Visitor Demand Mapping for Queenstown
17 Tourism Ticker: Queenstown Airport defies pandemic to post profit increase. Published 21 August 2020. (link)
18 World Health Organisation: Draft landscape of COVID-19 candidate vaccines. Updated 21 August 2020. (link)
19 Chemical & Engineering News. Rapid COVID-19 testing breaks free from the lab. Published 10 August 2020. (link)
20 Marketview: Regional Spend data. Pulled July 2020.
21 Data Ventures: COVID-19 Population Report 17 August. Released 17 August 2020. (link)
22 Ministry of Business, Innovation & Employment: Monthly Regional Tourism Estimates June (MRTEs). Released 13
August 2020. (link)
23 AWA Insights. Week Commencing 17th August 2020.24 Bloomberg: Europe Battles Virus Spike With No Appetite for New Lockdowns. Published 21 August 2020 (link)
25 McKinsey & Company: Ready for Check-In? Published August 2020. (link)
26 UNWTO: NO TIME FOR TIMID LEADERSHIP - THE SAFE RESTART OF TOURISM IS POSSIBLE. Published 18 August
2020. (link)
16 | Visitor Demand Mapping for QueenstownYou can also read