API Industry Outlook Second Quarter 2021 - R. Dean Foreman, Ph.D - American Petroleum ...

Page created by Chester Bowen
 
CONTINUE READING
API Industry Outlook Second Quarter 2021 - R. Dean Foreman, Ph.D - American Petroleum ...
API Industry
Outlook
Second Quarter 2021

R. Dean Foreman, Ph.D.
June 17, 2021
API Industry Outlook Second Quarter 2021 - R. Dean Foreman, Ph.D - American Petroleum ...
First quarter 2021 by the numbers
Key points                                                                                                                Benchmark price averages
                                                                                        Brent crude oil: $60.69 per barrel WTI crude oil: $58.13 per barrel
                                                                                        NGL composite: $6.70 per mmBtu Natural gas (Henry Hub): $3.37 per mmBtu
 Global and U.S. economies are on track - Consensus expectations for the
 strongest two-year global economic growth since 1972-1973                                                                                 5-year range      Quarterly increase
                                                                                                     U.S. petroleum                                          Quarterly decrease
                                                                                                        demand
 Global oil market recovery in progress                                                                18.4 mb/d                                          Revenues
                                                                                                                                                           $557 B
 o   U.S. petroleum demand of 19.6 mb/d in April 2021 climbed to within 3.5% of
     its Q2 2019 level, which was its highest for the month in 11 years.
 o   Record growth. EIA projects growth of +5.4 million barrels per day (mb/d) in
     2021 and +3.7 mb/d in 2022 – record 2-year gains and new highs by Q4
     2022                                                                           U.S. refinery                                                                          Net
 o   Who gains? Every producing region could participate in the recovery, but       throughput                                                                           income
                                                                                     14.1 mb/d                                        U.S. drilling
     U.S. production recovery remains a question                                                                                        activity                          $13 B
                                                                                                                                       393 rigs

 Natural gas – – Solid overall natural gas demand recovery and pull for record
 U.S. natural gas exports
                                                                                                   U.S. oil & gas                                            Capital
 The crux: Robust economic and energy market recovery contrasts with                                production                                            expenditures
 historically low capital investment and drilling activity. Global liquids                         31.6 mb/doe                                               $38 B
 spare capacity could become tight in 2022                                          •  Financial compilation based on API 200 companies with shares
                                                                                       listed on U.S. stock exchanges.
                                                                                    sources: EIA; API Monthly Statistical Report; Bloomberg and company
                                                                                    reports; Baker Hughes; API Team analysis
API Industry Outlook Second Quarter 2021 - R. Dean Foreman, Ph.D - American Petroleum ...
Industry capital expenditures fell to $38 billion – lowest on record for any quarter since
2008, and the backlog of U.S. projects under construction shrank to $174 billion
      The industry invested $37.8 billion in Q1 2021, compared with $65.5 billion in the same quarter of 2019
      Across the energy value chain, API is monitoring 94 oil & gas-related projects currently under construction worth $174 billion

Capital expenditures by industry segment                                                    $174 billion in current U.S. energy
Billion dollars (2021$)
                                                                                            infrastructure investments
140

120
              Downstream and Petrochemcial
              Equipment & Services
                                                                 Midstream
                                                                 Global integrated
                                                                                                                 174 billion
                                                                                                           in estimated industry projects
              Upstream                                                                        8 LNG
                                                                                              $63 B        under construction (May 2021,
100                                                                                                        down from $344 billion in Q1 2020)

 80
                                                                                                         26        20 Refinery              33
 60                                                                                                   PetChem      expansions            Pipelines
                                                                                                       $65 B         $18 B                 $27 B
 40

 20                                                                                            7 Gas
                                                                                              storage                        sources: S&P Market Intelligence; Oil &
  0                                                                                            $92 M                         Gas Journal; American Chemistry Council;
                                                                                                                             API Team calculations as of May 2021
   2008                    2011                     2014              2017           2020
   * All other oil & gas industry companies
   sources: Bloomberg; publicly-available company reports; BLS
API Industry Outlook Second Quarter 2021 - R. Dean Foreman, Ph.D - American Petroleum ...
Global oil drilling and investment decreased in level and in relation
to other energy sources, even in the most consistent region
   Middle East & North Africa (MENA) drilling and investment historically have been the most consistent but dropped in 2020
   MENA planned oil investments (2021-2025) decreased and lost share among total energy investments per APICORP

Global oil drilling activity and capital investment, quarterly                              MENA energy investment outlook
  Rigs                                                           Trillion dollars (2021$)
5,000                                                                                 1.0                     Planned by sector, 2021-2025
                                           Global energy investment
                                                                                                                          Oil                               20%
4,000                                                                                                                     Power                   $0.5
                                                                                     0.8                                  Chemical               trillion
                                                                                                                          Gas
3,000
                                           United States
                                                                                     0.5                     Committed by sector, 2021-2025
                                                                                            Billion dollars
2,000                                      Latin America
                                                                                            400
                                           Africa
                                           Europe                                           300
                                           Asia Pacific                              0.3                        Oil                                         42%
1,000                                                                                       200
                                                                                                               Gas
                                           Middle East                                      100               Chemical
                                                                                                              Power
    0                                                                                0.0       0
         2016            2017            2018             2019      2020     2021                           2019-2023                          2021-2025
         sources: Baker Hughes; IEA; Bloomberg; API Team analysis                             source: Arab Petroleum Investments Corporation
API Industry Outlook Second Quarter 2021 - R. Dean Foreman, Ph.D - American Petroleum ...
Global
Economy
API Industry Outlook Second Quarter 2021 - R. Dean Foreman, Ph.D - American Petroleum ...
The global economy is broadly expected to sustain above-average growth over
the next two years

  In a reversal from recent years, developed (OECD) economies are expected to lead global GDP growth in 2021 and 2022

            Global GDP growth and contributions by region*                                          Global GDP outlook
             y/y%                                                                                  y/y%
             6                         Average                                                     6
                                      2000-2020                                                           Average     4.8
                                                                                                                             4.2
             4                                                                                     4     2000-2020
                                                                                                                                    3.1
             2                                                                                     2
                                                                                                             -3.8
             0                                                                                     0

            -2                                                                                    -2

            -4                                                                                    -4
                    Organisation for Economic Cooperation and Development (OECD)
            -6       Non-OECD                                                                     -6
                 2000                        2010                              2020                         2020      2021   2022   2023
                                                             sources: IMF; Bloomberg   * Market exchange rate basis
API Industry Outlook Second Quarter 2021 - R. Dean Foreman, Ph.D - American Petroleum ...
What we’re watching now
            Global economic growth has accelerated broadly and unevenly, which sets the stage to address structural barriers to growth in
            developing Asia per the World Bank and potential oil market tightness per IEA

Global economy on firmer ground,                     The Innovation Imperative for                        Oil Market Report, May 2021
but with divergent recoveries amid                   Developing East Asia
high uncertainty
• Improved outlook. Upgraded 2021 and 2022           • Much of global GDP growth depends on East          • IEA downgraded its 2021 world oil demand
GDP forecasts by +0.8% and +0.2%, respectively       Asia, and the region’s developing economies face     growth projection to a still-strong 5.4 mb/d
                                                     headwinds of decreased productivity and global
• Divergent impacts. Disproportionate losses in      trade plus technological advances that threaten      • As vaccination rates rise and mobility
countries reliant on tourism, commodity exports      the region’s traditional growth engine of export-    restrictions ease, global oil demand is set to soar
and those with “limited policy space to respond”     oriented manufacturing                               from 93.1 mb/d in 1Q21 to 99.6 mb/d by year-end
• High uncertainty remains with the health crisis    • The region focus must spur innovation via broad    • “Under the current OPEC+ production scenario,
• Policy priorities vary by country but generally    adoption and diffusion of existing technologies,     supplies won’t rise fast enough to keep pace with
should boost productive capacity, foster efficient   not only invention of new ones. This requires        the expected demand recovery“
resource allocations, and scale back gradually       improving 1) information on technologies reduced
(“avoid sudden cliffs”)                              uncertainty about returns to their use; 2)
                                                     workforce skills and management capabilities; and,   International Energy Agency, May 2021
International Monetary Fund, April 2021              3) access to external financing for technology
                                                     adoption or broader innovation projects
                                                     X. Cirera et. al., World Bank Group (2021)
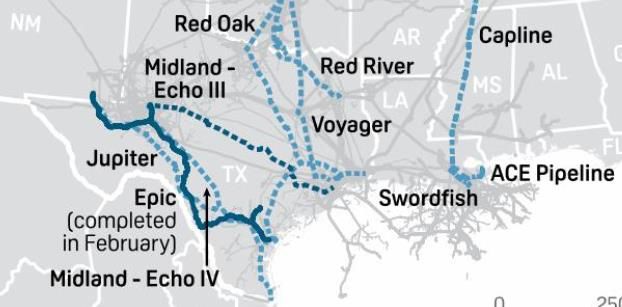
API Industry Outlook Second Quarter 2021 - R. Dean Foreman, Ph.D - American Petroleum ...
Oil Markets
API Industry Outlook Second Quarter 2021 - R. Dean Foreman, Ph.D - American Petroleum ...
Global oil demand has continued to rebound along with real GDP and could reach
new highs in late 2022
 Global oil demand has historically changed in tandem with the economy, and this relationship remained intact through the 2020 COVID-19 recession

          Global oil demand and GDP
          Million barrels per day                                                                                                2022
          100
                                                                                                                                    EIA estimates
                                                                                                                             2021

           85                                                                                                          2020
                                                   Double-dip recession,
                                                   front-wheel drive and                                             COVID-19
                                                                                                 Great Financial     recession
                                                      CAFE standards
           70                                                                                   Crisis (2008-2009)
                                                        (1980-1982)

           55

                                       1970
           40
                0                               20                         40                        60               80                    100
                    *Market exchange rate basis                              Real GDP (Trillion 2010$)
                    sources: EIA; Bloomberg; IMF; API Team calculations
API Industry Outlook Second Quarter 2021 - R. Dean Foreman, Ph.D - American Petroleum ...
Global oil demand could set a new record-high by the end of 2022 per EIA
  Led by emerging economies’ demand, EIA projects global oil demand could exceed 102 mb/d and achieve record highs over the latter half of 2022
  EIA projects OPEC and Russian & Caspian producers to redeploy 4.6 mb/d of their spare capacity between Q3 2021 and Q4 2022 – and for the U.S.
  to add another 0.5 mb/d in the second half of this year and another 1.2 mb/d in 2022, which would require increased investment and drilling

Global oil demand                                        EIA                               Global oil supply                                    EIA
Million barrels per day                                  estimates                          Million barrels per day                             estimates
100                                                                                         100
                                                                                                         Russia & Caspian

 75                       Non-OECD                                                           75
                          (Emerging economies)                                                             OPEC

 50                                                                                          50
                                                                                                           United States
 25                       OECD                                                               25
                          (Developed economies)                                                            Other Non-OPEC
  0                                                                                            0
      2016   2017   2018      2019    2020        2021    2022                                      2016   2017   2018     2019   2020   2021     2022

                                                                     source: EIA STEO (June 2021)
Despite projected OPEC+ and U.S. supply increases, EIA expects that global
oil demand could continue to exceed supply through Q4 2021 and support
oil prices of about $60 per barrel in 2022
           EIA global supply/demand and Brent price estimates as of June 2021
           Million barrels per day (mb/d)                                                                                           2021$/Bbl
           10                                                                                                                            125
                                             Supply less demand          Brent crude oil prices          .          EIA estimates
            8

            6                                                                                                                            100

            4
                                                                                                                                         75
            2

            0
                                                                                                                                         50
           -2

           -4                                                                                                                            25
           -6

           -8                                                                                                                            0
                2015              2016                2017        2018          2019              2020       2021      2022
                sources: EIA STEO (June 2021); Bloomberg
EIA projects U.S. liquid fuels consumption could return to its 2019 levels by
the second half of 2022
      Indicators of industrial and chemical production, daily flights and mobility statistics, and vehicle miles traveled tracking show broad progress year-on-
      year and year-to-date – with motor fuels now showing single-digit percentage declines from 2019 levels
      EIA projects 2H 2021 to see strongest refined product demand increases in jet fuel and other oil categories

Refined product key U.S. demand indicators,                                         May 2021 year-to-date   U.S. liquid fuel consumption by fuel
                                                                                                            Million barrels per day                               EIA
                                                                                                            25                                                    estimates

                                                                                                            20
                                                                                                                         Other (naphtha/gasoil; HGLs)
Passenger VMT                   Truck VMT                    Total Flights                Manufacturing
                                                                                                                         Residual fuel oil
                                                                                                            15
+10% +5% +23% +3%                                                                                           10
                                                                                                                         Jet fuel

                                                                                                                         Distillates/diesel fuel
Apple Mobility                DAT Spot Loads                 TSA Passengers                   Chemicals

+35% +15% +98% +2%                                                                                           5          Motor gasoline

                                                                                                             0
  source: U.S. Federal Highway Administration; FlightRadar24; ISM PMI; ACC; TSA; Apple; DAT                      2016    2017         2018   2019   2020   2021    2022
                                                                                                              sources: EIA; API MSR
As U.S. oil well productivity edged down from record levels in Q2 2021,
       estimated breakeven prices have diverged by region
             EIA reported oil well productivity fell by more than 6% year-to-date in the Permian and DJ Niobrara basins
             BTU Analytics’ estimated breakeven prices by basin stood below recent market prices

U.S. oil well productivity – new production per rig                                   Oil estimated breakeven prices*
Million barrels per day oil-equivalent                                                                                   Dollars per barrel ($/Bbl.)
4                                                                                                               0            20         40           60                  80
                     Bakken                       Permian
                              Eagle Ford          DJ Niobrara                                        Bakken         May 2021
                                                                                                                    May 2020
3                                                                                                                                                            WTI month-ahead
                                                                                                                                                             futures price
                                                                                       Eagle Ford - West
                                                                                                                                                             June 8, 2021

2                                                                                       Eagle Ford - East

                                                                                               DJ Niobrara
1
                                                                                     Permian - Delaware

0                                                                                     Permian - Midland
    2016              2017              2018   2019      2020    2021
    source: EIA Drilling Productivity Report                                          *Half cycle breakevens assuming 10% discount factor. sources: BTU Analytics; CME Group
Permian oil pipeline capacity expansions have recently outpaced production,
but could position the basin to participate in an oil market recovery
     EIA estimated Permian oil production recovered in Q2 2021 to its December 2020 level and could increase in the near-term
     Pipeline delays and cancellations reflect the current production outlook but also imply there has been spare egress capacity

Permian Basin pipeline capacity balance                                                               Potential midstream project delays
Million barrels per day (mb/d)
10
 8
 6                             Trucking need

 4
 2
     sources: EnSys; Rystad; Bloomberg; EIA; API Monthly Statistical Report
 0
  1Q18               3Q18                1Q19                 3Q19            2020             2022
         Refining capacity                   Centurion                        West Texas Gulf         sources: EnSys; S&P Global
         WA Line and Line 0                  Amdel                            Wink
         Basin                               Longhorn                         Lone Star
         Midland-ECHO 1                      Midland-ECHO 2                   Midland-ECHO 3
         Cactus                              Permian Express II               Permian Express III
         Permian Express IV                  Longview                         Sunrise
         Gray Oak                            Cactus II                        EPIC
         Wink-to-Webster                     Rail capacity                    Permian production
Bakken oil production could depend heavily on rail without the Dakota
Access Pipeline (DAPL)
      EIA estimated Bakken oil production remained down by more than 8% in Q2 2021 versus its December 2020 level and could
      remain flat in the near-term
      An oil production recovery in the Bakken could be enabled in part by DAPL

Bakken Formation pipeline infrastructure                                       Bakken pipeline capacity balance
                                                                               Million barrels per day (mb/d)
                                                                               4

                                                                               3

                                                                               2

                                                                               1

                                                                                   sources: EnSys; Bloomberg; EIA; API Monthly Statistical Report
                                                                               0
                                                                                1Q18              3Q18                 1Q19                3Q19               2020               2022
                                                                                              Refinery capacity                                     Butte
                                                                                              Enbridge Line 26                                      Enbridge Line 81
                                                                                              Enbridge Line 83                                      Bakken Expansion
                                                                                              Tesoro High Plains                                    Hiland / Double H Pipeline
sources: EIA, PennWell, National Geographic, ESRI, Garmin, HERE, UNEP, USGS,
WCMC, NASA, ESA and API Team analysis                                                         ETP DAPL                                              Rail capacity
                                                                                              Bakken production
U.S. liquids production fell along with the 2020 COVID-19 recession and has
remained steady ever since, propelling a return to petroleum net imports

                                                                  U.S. liquids production and petroleum trade
                                                                  Million barrels per day
   In 2020, the U.S. became a petroleum net exporter on an
   annual basis for the first time since 1958                     20            U.S. crude oil and NGL production     Flat production since
                                                                                U.S. petroleum net imports                  COVID-19
   However, domestic production fell along with the 2020          15
   COVID-19 recession and has remained flat with historically

                                                                                                                                   Net imports
   weak drilling activity since then                              10

   The U.S. reverted to being a net importer in Q2 2020 and EIA    5
   projects net imports to continue in 2021 and 2022
                                                                   0

                                                                                                                                   Net exports
                                                                  -5
                                                                       2016       2017      2018     2019      2020       2021
                                                                    sources: EIA; API
Natural Gas
Natural gas market resiliency in Asia Pacific and Europe keyed record trade and
   U.S. liquefied natural gas (LNG) exports through April 2021
        Following the Q1 winter heating season, Asian and European natural gas demand and benchmark prices have risen
        Despite the U.S. Gulf Coast polar vortex temporarily disrupting liquefaction activities, the U.S. set new natural gas export records in April 2021

                                                                                                                                                        Dutch
                                                                                                                                                          TTF
                                                                                                                                                   UK NBP
                                                                                                                                                                       Japan
                                                                                                                                       Henry Hub                       Korea

U.S. LNG export volume by terminal                                                      Regional gas hub pricing                                                      Marker

Billion cubic feet                                                                      $2021 per mmBtu, monthly
350                                 Elba Island                                         16         UK Benchmark (NBP)
                                    Cove Point                                                     Dutch Benchmark (TTF)
300                                 Freeport                                            14         Asian Benchmark (JKM)
                                    Corpus Christi                                                 Henry Hub
250                                 Cameron                                             12
                                    Sabine Pass                                         10
200

150                                                                                       8
                                                                                          6
100
                                                                                          4
 50
                                                                                          2
  0
        J     F M A M               J J         A     S    O N   D   J   F M A            0
                                    2020                                 2021                 2016            2017              2018   2019                 2020   2021
        sources: DOE; IHS; Marine Traffic; API Team analysis                                  sources: Bloomberg; Quandl; EIA
Natural gas-dedicated drilling has sustained strong productivity and
historically low breakeven prices
 For dedicated dry gas drilling, producers sustained near-record rig productivity in Q2 2021 per EIA
 Estimated natural gas breakeven prices moved in different directions by producing region but generally remained below recent
 natural gas futures prices

        Natural gas well productivity –production per rig                      Natural gas estimated breakeven prices
                                                                                                            Dollars per million Btu (mmBtu)
        Million cubic feet per day nat. gas-equivalent                                                      0        1        2       3     4
        35                                                                                                                           Henry Hub month-
                                                                                                                      May 2021       ahead futures price
        30                                                                                 Haynesville
                                                                                                                      May 2020       June 8, 2021
        25                                    Appalachia
        20                                                                   Appalachia - Northeast PA
        15
                                             Haynesville
        10                                                                   Appalachia - Southwest PA
         5
         0                                                                           Appalachia - Ohio
             2016     2017            2018           2019      2020   2021
                    source: EIA Drilling Productivity Report
                                                                                           *Half cycle breakevens assuming 10%
                                                                                           discount factor and play-specific costs
                                                                                           sources: BTU Analytics; CME Group
Appalachian natural gas production has continued to grow despite the 2020 COVID-
 19 recession and likely requires more pipeline capacity to enable future growth
     With natural gas production growth of 3.8% y/y in 2020 and another 2.0% y/y in 2021 per EIA, Appalachian has needed more pipeline egress capacity
     With the Mountain Valley pipeline’s tentative completion in 2022, parts of Appalachia could have sufficient egress capacity for the near-term, but
     cancellations of the proposed Atlantic Coast and Constitution pipelines in 2020 could limit the region’s production growth

Appalachian Basin gas pipeline capacity utilization                                 Key Appalachian gas pipeline updates
Billion cubic feet per day (bcf/d)                                                   As of Q1 2021
40

30

20

10

 0 sources: EIA; Rystad; EnSys; Global Energy Monitor; API Team analysis
  1Q18 2Q18 3Q18 4Q18 1Q19 2Q19 3Q19 4Q19 2020 2021 2022
         Hammerhead                  Buckeye Xpress       TX Eastern TEAL
         Demand                      KM Rex 2             Dominion Hub
         ET Rover                    Leach Xpress         NEXUS
         ANR GC                      Columbia Gas Trans   Empire Line
         EQT System                  National Fuel Gas    Leidy South               sources: EIA
         Adelphia                    Mountain Valley      Flows to Canada
         Production
With Permian natural gas pipeline completions, pipeline capacity could
     readily enable production growth and LNG export opportunities
         With an estimated 6.1 bcf/d of Permian gas pipeline capacity by end of 2021, lines stand to benefit post-COVID from
         increased demand, dry exports to Mexico, and LNG exports via the Gulf to emerging markets

Permian Basin gas pipeline capacity utilization                                                Key Permian gas pipeline updates
Billion cubic feet per day (bcf/d)                                                             As of Q1 2021
25                                                                                                  Permian Global Access Pipeline
                                                                                                    Gulf Coast Express
20                                                                                                  Permian Highway
                                                                                                    Pecos Trail
15                                                                                                  Permian-Katy
                                                                                                    Whistler
10
                                                                                                                                  Cancelled
 5
                                                                                                         Cancelled
      sources: EIA; Rystad; EnSys; Global Energy Monitor; API Team analysis
 0
                                                                                                                               Completed        On Hold
  1Q18 2Q18 3Q18 4Q18 1Q19 2Q19 3Q19 4Q19 2020 2021 2022
          Transwestern                     Atmos                              Oasis                            Completed
          Demand                           NNG                                NGPL
          EPNG                             Corpus Christi                     Coastal Bend                                          Est. 2021
          Impusora                         Roadrunner                         KM Texas         source: Permian Texans for Natural Gas
          Red Bluff                        ET Fuel/Enterprise                 Enterprise/DCP
          Oneok West Tex                   Gulf Coast Express                 Gemini
          Permian Highway                  Flows to Mexico                    Whistler
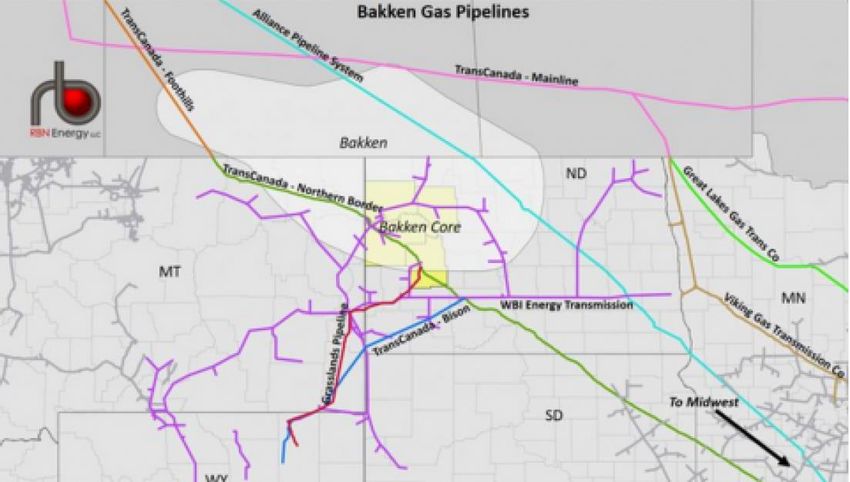
          Production
Bakken natural gas pipeline capacity has historically matched well with
production and appeared ample relative to recent changes

Bakken gas pipeline capacity utilization                                      Key Bakken gas pipelines
Billion cubic feet per day (bcf/d)                                            As of Q2 2021
4

3

2

1

    sources: EIA; Rystad; EnSys; Global Energy Monitor; API Team analysis
0
1Q18 2Q18 3Q18 4Q18 1Q19 2Q19 3Q19 4Q19 2020 2021 2022
            North Bakken Expansion                                            source: RBN Energy
            Current Bakken egress on Northern Border and Alliance pipelines
            Demand
            Production
As natural gas prices have recovered, power sector fuel competition has backed
out gas in most U.S. regions but been largely offset by increased exports
  Power sector gas consumption, which was affected by February polar vortex disruptions varied by region
  Record natural gas exports have largely offset the power sector’s fuel substitution, and EIA projects resumed increases over the next three years

 U.S. power sector gas consumption                                                    U.S. natural gas consumption and production
 Year-to-date through May 1st, y/y%                                                   by sector, Trillion cubic feet
                                                                    ISO-NE
                                                                     +8.4%            40 Dry natural gas                 EIA estimates
                                                                                            production
                                                           ISO-NY
        Northwest                                          +17.4%
                                  SWP                                                       Net Exports
          -4.0%                                                                       30
                                 -26.8%
                                              MISO                                            Electric
                                                             PJM                              Power
CAISO                                        -19.2%
                                                            -0.2%                     20
+7.5%
            Southwest                                                                        Industrial
             -23.2%                                   Southeast
                                                        -7.7%                         10
                                 ERCOT
                                 +2.7%                                                         Res /
                                                                                              Comm
                                                                                       0
                                                                                               2020            2021      2022         2023            2024
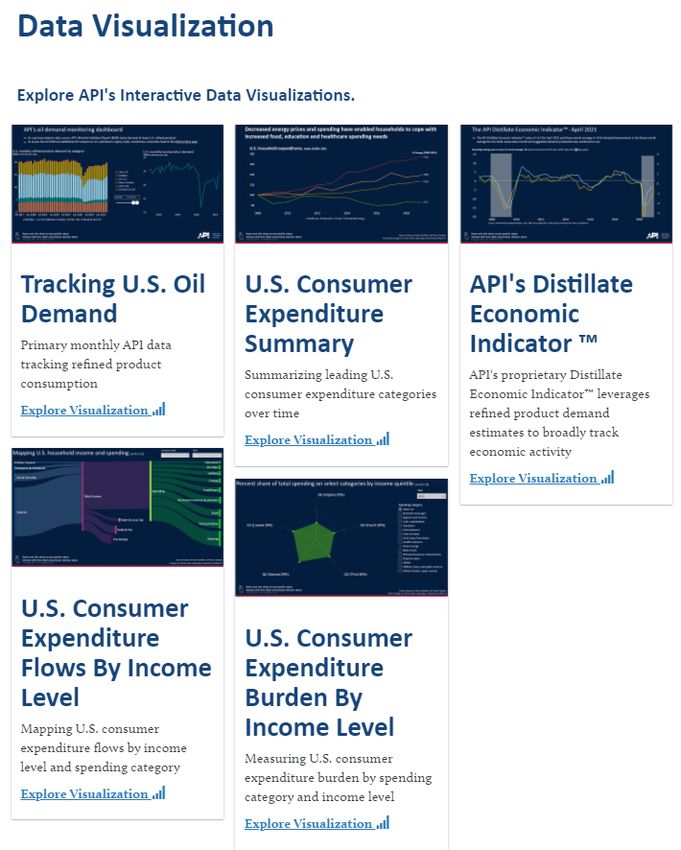
    sources: EIA Hourly Grid Monitor; FERC                                                     sources: EIA AEO 2021
API economics resources available at www.api.org
You can also read