September 2018 - Hemisphere Energy Corporation
←
→
Page content transcription
If your browser does not render page correctly, please read the page content below
September 2018
The Strategy
Focused on creating long-term shareholder value by continually
developing our early stage / low cost / high rate of return oil assets
Geographic Focus
Production and landbase located in friendly jurisdiction of southeast Alberta
Strategic acquisitions of offsetting production and drilling opportunities
Control of Assets & Development
100% owner & operator of land, wells & facilities
Adjustable pace of development
Maximize Oil Recovery
Develop pools with horizontal wells drilled off pads to minimize surface impact
No hydraulic fracturing required due to high reservoir porosity and permeability
Use proven, highly effective waterflood enhanced oil recovery methods to maximize ultimate oil
recovery per well and minimize capital invested
Drive Capital Efficiency
Continue to lower development and operating costs as we increase the size of drilling programs
and improve well performance with increasing reservoir pressure
2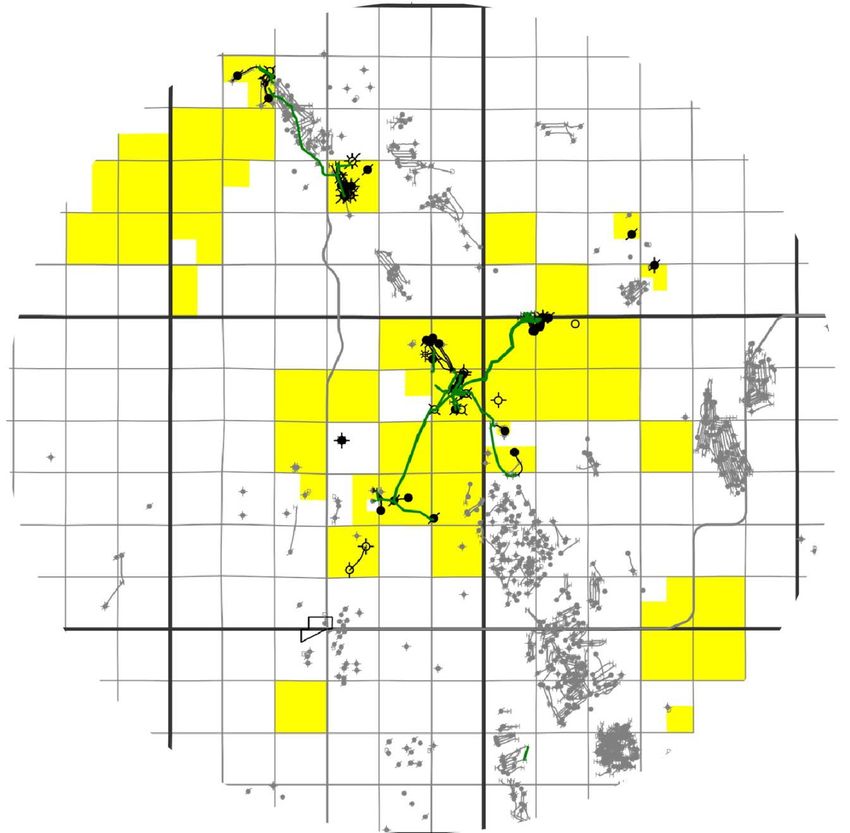
The Snapshot
TSX Venture                                                                                                                                            HME
Share Price                                                                                                                                          $0.22
September 6, 2018

52 Week Range                                                                                                                              $0.18 - $0.36
Basic Shares Outstanding                                                                                                                            89.8 MM
FD Shares Outstanding                                                                                                                           111.8 MM
      Insider Ownership                                                                                                                              ~13%
Enterprise Value*                                                                                                                               $43.5 MM
Q2 Revenue                                                                                                                                       $5.6 MM
Q2 Operating Field Netback                                                                                                                   $34.23/boe
June 30, 2018 Net Debt                                                                                                                          $23.7 MM
Term Loan Facility**                                                                                                                        US$35.0 MM
 5 years; Matures September 15, 2022

Current Production***                                                                                                                      ~1250 boe/d
 Field-estimated; Aug, 13 – Aug 19, 2018                                                                                                               97% oil

Proved + Probable Reserves****                                                                                                                7.2 MMboe
      NPV10 (before tax)****                                                                                                                  $116.7 MM
Liability Management Rating                                                                                                               7.05           (Top 12% of
as at Sept. 1 , 2018 (ratio of Hemisphere’s deemed assets (production) to deemed                                                                         Alberta companies)
liabilities (abandonment & reclamation costs)
* Based on an equity value of $0.22 as of Sept 6, 2018 and a net debt of $23.7 million as of June 30, 2018.
** The lender under Hemisphere’s Term Loan Facility has committed up to US$30.0 million to date.
*** As disclosed in Hemisphere’s news release dated August 22, 2018.
**** Reserve volumes and net present values are as attributed by McDaniel & Associates Consultants Ltd. ("McDaniel") in the reserve report of McDaniel dated March 9, 2018 and effective as of
December 31, 2017 ("McDaniel Reserve Report"). See Advisory Statements – Oil and Gas Information – Net Present Values.

                                                                                                                                                                                                 3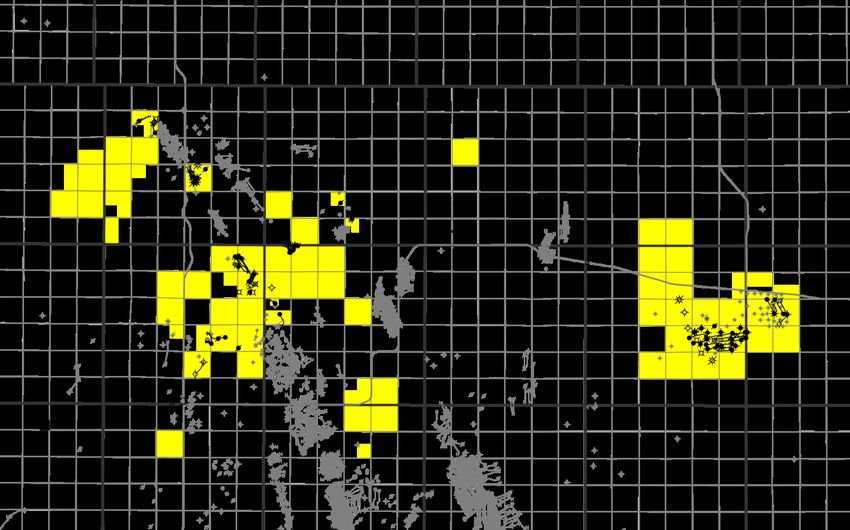
The Recent Production Growth
                                                                                        Sept 2017
                                                                                    Refinanced with 5-
                                                                                    year term loan and
                                                                                      started active
                                                                                       development
        1400                                                                                                        16

        1200                                                                                                        14

                                                                                                                    12

                                                                                                                         Boe/d per million shares
        1000
                                                                                                                    10
        800
Boe/d

                                                                                                                    8
        600
                                                                                                                    6
        400
                                                                                                                    4
        200                                                                                                         2

          0                                                                                                         0
                                                                                                                *

                                                                      Production         Production per share

               * As disclosed in Hemisphere’s news release dated August 22, 2018.

                                                                                                                                                    4
The Outlook @ US$70 WTI
                            o Planned development* estimates corporate production to reach ~2750 boe/d and
                              annualized cashflow to exceed ~$30 million by the end of 2019
                            o Assumptions include: netback**, $18MM of additional capital expenditures from Q4/18-
                              Q4/19 to drill 18 new producers, 2 injectors, and complete additional facility work

                                  35                                                                                                                                                                  3,000

                                  30
                                                                                                                                                                                                      2,500
Funds Flow, Capital Coutlay $MM

                                  25
                                                                                                                                                                                                      2,000

                                                                                                                                                                                                              Production boe/d
                                  20
                                                                                                                                                                                                      1,500
                                  15

                                                                                                                                                                                                      1,000
                                  10

                                                                                                                                                                                                      500
                                   5

                                   0                                                                                                                                                                  0
                                                  Q318                      Q418                      Q119                     Q219                      Q319                      Q419

                                                                         Annualized Funds Flow                   Capital Expenditures                Average Production

                                       * See Advisory Statements – Non-IFRS Measures - Forward Looking Information and Statements, and Annualized Cashflow Estimate.
                                       ** Netback Assumptions: US$70 Flat WTI; US$20 WCS Differential; 1.3 Cdn/US exchange rate; ~Cdn$3/bbl Quality adjustment from WCS; ~Cdn$12.10/boe opex through 2019.

                                                                                                                                                                                                                                 5
The Foundation Assets
  Southeast Alberta Focus

           JENNER
                       ATLEE
                      BUFFALO
                                   Edmonton

                                                Atlee
HME Land                                       Buffalo
                                   Calgary

                                             Jenner

                                                         6
Jenner: The Stable Cash Flow
                                    o   100% average working interest
                                    o   100% operator of production
                                    o   ~24,000 net acres of land
                                    o   8 oil pools defined by 3D seismic
                                    o   30 drilling locations identified*
                             S
                                    o   9 booked locations*
                                    o   Operated oil processing and
                                        water disposal facilities
                         B
                                    o   Expansion capability for growth
                                        in production
                     S

    HME Land
B   Battery
S   Satellite
    Pipeline
    3D Seismic

                                        *   See Advisory Statements – Oil and Gas Information – Drilling Locations.

                                                                                                                      7
Atlee Buffalo: The Growth Opportunity
                                                                                                                 G POOL
o       Upper Mannville F Pool
             o       28 MMbbl OOIP*
             o       Only 5% current oil recovery factor
o       Upper Mannville G Pool
             o       38 MMbbl OOIP*
             o       Only 3% current oil recovery factor                                                F POOL
o       Working Interest – 100% in both pools
o       Excellent Geological Control – Oil
        pools delineated by over 50 vertical wells
o       3D Seismic – Coverage over both pools                                                                        Hz producer
o       Waterflood – Expanding in both pools                                                                         Hz water injector
                                                                                                                     Vertical injector
o       Oil Recovery Factors** – Local
        analogue oil pools have exceeded 40%
        recovery factors with enhanced recovery
        methods (waterfloods, polymer)
o       Hemisphere’s Dec. 31, 2017 Reserve
        Report reflects total 2P booked reserves
        of just 12% of the estimated oil in place

* Based on McDaniel’s reservoir mapping for the purposes of the McDaniel Reserve Report. See Advisory
  Statements – Oil and Gas Information – OOIP.
** See Advisory Statements – Oil and Gas Information – Analogous Information.

                                                                                                                                     8
Atlee Buffalo: The Development Plan
2018 Accomplishments G POOL
Drilled 14 wells to date
Expanded F pool facility to enhance
water separation and increase oil production
o Currently expanding G pool facility
2019 Plans F POOL
o Q1 2019: Plans to drill up to 8 wells
o H2 2019: Plans to drill up to 10 wells
o Continue to expand field-wide reservoir
Hz producer
simulation studies Hz water injector
o Continue to optimize batteries and 2019 producer****
existing waterflood operations 2019 injector****
Future Hz wells****
Vertical injector
WELL ECONOMICS – Internal Evaluation***
Capital Drill, Estimated
Complete, Ultimate Initial Capital
Atlee Buffalo Equip & Tie-in Recovery* Production* Payout** NPV10** ROR** Efficiency**
Area $MM Mbbl bbl/d Years $MM % $/bbl/d
F Pool 0.9 150 70 1.1 2.2 135 13,000
G Pool 0.85 150 80 0.7 3.0 250 10,000
* See Advisory Statements – Oil and Gas Information – Initial Production Rates and Estimated Ultimate Recoveries.
** Assumptions: US$70 Flat WTI Pricing with US$20 WCS Differential ; ~$3 quality differential from WCS; Average ~$18.10/boe lifetime operating and transportation expenses, and ~$8.60/boe royalties.
*** Economics for both Atlee Buffalo F and G Pools have been generated as of July 1, 2018 and are based on internal estimations of reserves and production profiles prepared by a member of management who is a qualified reserves evaluator in
accordance with National Instrument 51-101 for the 2019 development wells as shown on this slide with correlating production profile and economics used in the cash flow model on slide 5
**** See Advisory Statements – Oil and Gas Information – Drilling Locations.
9
The Long-Term Value Growth
                       Reserves*                                                                                                                   NPV10 BT*
        8.0                                                                                                 $140.0                                                                                    $1.50

               57% Growth in the last                                                                                                                                                        $1.30
        7.0                                                                                                 $120.0
                                                                                                                                  69% Growth Per Share
              year through drilling and
                                                                                                                                     in the last year                                                 $1.25
                     waterflood
        6.0                                                                 2.3
                                                                                                            $100.0                 $1.02                                                       2P
                                                                                                                                                                                              $36.3   $1.00
        5.0
                                                                                                              $80.0                                                               $0.77

                                                                                                                                                                                                          Per share (basic)
MMboe

        4.0                                                                                                                                                                                           $0.75
                                                   1.4                                                                                                     $0.64

                                                                                                     $MM
                          1.1                                                                                 $60.0                                                                 2P
        3.0                                                                                                                          2P                                            $20.2
                1.1                                                                                                                 $22.2                                                             $0.50
                                                                            4.9                                                                             2P                                1P
                                                                                                              $40.0                                        $14.1
        2.0                                                                                                                                                                                  $80.4

                          2.8                      3.1                                                                                                                             1P
                                                                                                                                    1P                                                                $0.25
                2.2                                                                                           $20.0                                         1P                    $45.7
        1.0                                                                                                                        $40.3
                                                                                                                                                           $34.3

        0.0                                                                                                     $0.0                                                                                  $0.00
              Dec 31    Dec 31                Dec 31                   Dec 31                                                    Dec 31                  Dec 31                 Dec 31       Dec 31
               2014      2015                  2016                     2017                        Proved                        2014                    2015                   2016         2017
                                                                                                    Probable

                          * Reserve volumes and net present values are attributed in each of the independent reserve reports prepared for Hemisphere effective as of the date noted above.

                                                                                                                                                                                                         10
Atlee Buffalo: The Reserve Upside Potential
2P Booked Potential Additional
Cumulative Reserves as at (Unbooked) Reserves
Pool OOIP* Production to-date December 31, 2017 At Various RF***
(MMBbl) (MMBbl) (MMBbl) (MMBbl)
20% 30% 40%
Upper Mann F 28 1.3 (5% Recovery Factor) 2.9 (15% Recovery Factor)** 1.4 4.2 7.0
Upper Mann G 38 1.3 (3% Recovery Factor) 2.7 (11% Recovery Factor)** 3.6 7.4 11.2
Atlee Buffalo Total 66 2.6 (4% Recovery Factor) 5.5 (12% Recovery Factor)** 5.1 11.7 18.3
Upper Mann F Upper Mann G
Produced
1.3 MMbbl
At a Produced
1.3 MMbbl
P otential
Additional
Booked
2.9 MMbbl
30% P otential
Additional
Booked
2.7 MMbbl
4.2 MMbbl
R ecovery Factor 7.4 MMbbl
* Based on McDaniel’s reservoir mapping for the purposes of the McDaniel Reserve Report. See Advisory Statements – Oil and Gas Information – OOIP.
** Represents the booked recovery factor attributed by McDaniel in the McDaniel Reserve Report.
*** The recovery factors (and reserve volumes) as noted are potential recovery factors (and reserve volumes) only and are based on management's estimates (as prepared by a qualified reserves evaluator in accordance with National Instrument
51-101) and assumes the successful response to Hemisphere's proposed waterflood operations based on the results of analogous pools under waterflood (See Advisory Statements – Oil and Gas Information – Analogous Information). There is
no guarantee that the potential recovery factors will be realized by Hemisphere or that the reserve volumes noted will be attributed by an independent qualified reserves evaluator to Hemisphere.
11The Hemisphere Investment
Assets for Growth
Early stage of development
High rate of return projects with production and reserve growth through strategic low-
risk, low capital expenditure and fast payout projects
Multi-year, low-risk drilling inventory in Atlee Buffalo and Jenner oil pools
Stable, long-life, inclining production through waterflood
Access to Capital
Well funded by strategic energy partner to execute growth of HME’s oil assets
Term Loan Facility of up to US$35.0 MM allows HME to organically develop its oil
assets over the next 2-3 years
Team to Deliver
Competent and experienced management team that has led Hemisphere through
several years of marginal commodity prices during the downturn and has positioned the
company for growth
Time to Execute
Oil market has strengthened and development costs remain low
12The Driven Leadership
Management
Don Simmons, P.Geol.
P resident & Chief Ex ecutive Officer
Over 18 years of experience technical, operational and management
experience (Alberta Energy Company, Encana, Sebring) Board of Directors
Ian Duncan, P.Eng. Charlie O’Sullivan, B.Sc. Chairm an
Chief Operating Officer
Over 16 years of experience which includes drilling, completions, Don Simmons, P.Geol.
facilities, and operations (Talisman and Solaris MCI)
Frank Borowicz, QC, JP, CPA (Hon)
Dorlyn Evancic, CPA, CGA
Chief Financial Officer Bruce McIntyre, P.Geol.
Over 30 years of experience in corporate finance and management
(Guyana Frontier, Northern Continental and Gemco Minerals)
Gregg Vernon, P.Eng.
Andrew Arthur, P.Geol. Richard Wyman, B.Sc., MBA
Vice P resident, Ex ploration
Over 30 years of experience with several hundred wells drilled across
the Western Canadian Sedimentary Basin (Enerplus, Mission, Talisman)
Ashley Ramsden-Wood, P.Eng.
Vice P resident, Engineering
Over 16 years of experience in reservoir engineering, capital planning,
and reserves evaluation (NAL, Petro-Canada)
13Advisory Statements
Forw ard-look ing I nform ation and Statem ents
This corporate presentation contains certain forward-looking information and statements within the meaning of applicable securities laws. The use of any of the words "expect", "anticipate", "continue", "estimate", "may", "will",
"project", "should", "believe", "plans", "intends", "forecast", "goals" and similar expressions are intended to identify forward-looking information or statements. In particular, but without limiting the forgoing, this presentation
contains forward-looking information and statements pertaining to the following: the volumes and estimated value of Hemisphere's oil and gas reserves; resource estimates and volumes in respect of Hemisphere's Jenner and Atlee
Buffalo property areas; the anticipated economics of the oil wells at Atlee Buffalo and Jenner, including timing for anticipated payout and rates of return; Hemisphere's proposed development plans for its properties at Atlee Buffalo
and Jenner; the potential for increased recovery factors in and reserve additions from the oil pools in which Hemisphere holds an interest; potential future production rates, cash flows; future oil and natural gas prices; future results
from operations; future costs, expenses and royalty rates; the exchange rate between the $US and $Cdn; cash flow estimates based on full-scale development plans; the amount and timing of capital projects; corporate costs; the
total future capital associated with development of reserves and resources; the anticipated response of Hemisphere's oil assets at the Atlee Buffalo property area to waterflood stimulation operations (including the potential for
increased recovery factors and reserve volumes resulting there from); estimated ultimate recoveries of producing wells; initial production rates and the estimated payout from wells to be drilled by Hemisphere, NPV10 values, rates of
return and capital efficiencies of Hemisphere’s Jenner and Atlee Buffalo wells.
The recovery, reserve, and resource estimates of Hemisphere's reserves and resources provided herein are estimates only and there is no guarantee that the estimated reserves or resources will be recovered. In addition, forward-
looking statements or information are based on a number of material factors, expectations or assumptions of Hemisphere which have been used to develop such statements and information but which may prove to be incorrect.
Although Hemisphere believes that the expectations reflected in such forward-looking statements or information are reasonable, undue reliance should not be placed on forward-looking statements because Hemisphere can give no
assurance that such expectations will prove to be correct. In addition to other factors and assumptions which may be identified herein, assumptions have been made regarding, among other things: the impact of increasing
competition; the general stability of the economic and political environment in which Hemisphere operates; the timely receipt of any required regulatory approvals; the ability of Hemisphere to obtain qualified staff, equipment and
services in a timely and cost efficient manner; drilling results; the ability of the operator of the projects in which Hemisphere has an interest in to operate the field in a safe, efficient and effective manner; the ability of Hemisphere to
obtain financing on acceptable terms; field production rates and decline rates; the ability to replace and expand oil and natural gas reserves through acquisition, development and exploration; risks associated with the degree of
certainty in resource assessments; the timing and cost of pipeline, storage and facility construction and expansion and the ability of Hemisphere to secure adequate product transportation; future commodity prices; currency,
exchange and interest rates; regulatory framework regarding royalties, taxes and environmental matters in the jurisdictions in which Hemisphere operates; and the ability of Hemisphere to successfully market its oil and natural gas
products. There are a number of assumptions associated with the potential of resource volumes estimated herein, including the quality of the reservoir, future drilling programs and the funding thereof, continued performance from
existing wells and performance of new wells, well density per section and recovery factors and discovery and development of the lands evaluated in Hemisphere's property areas of operation, which necessarily involves known and
unknown risks and uncertainties, including those identified in this presentation and including the risks set forth in Hemisphere's most recent annual information form available for review on SEDAR at www.sedar.com.
The forward-looking information and statements included in this presentation are not guarantees of future performance and should not be unduly relied upon. The forward-looking information and statements contained in this
presentation speak only as of the date of this presentation, and Hemisphere does not assume any obligation to publicly update or revise any of the included forward-looking statements or information, whether as a result of new
information, future events or otherwise, except as may be required by applicable securities laws.
Oil and Gas I nform ation
N et Present Values
It should not be assumed that the estimates of future net revenues presented or disclosed in this presentation represent the fair market value of the reserves. There is no assurance that the forecast prices and costs assumptions
made in estimating such future net revenues will be attained and variances could be material.
BOE
Disclosure provided herein in respect of Boe's may be misleading, particularly if used in isolation. A Boe conversion ratio of 6 Mcf:1 Bbl is based on an energy equivalency conversion method primarily applicable at the burner tip and
does not represent a value equivalency at the wellhead. Given that the value ratio based on the current price of crude oil as compared to natural gas is significantly different from the energy equivalency of 6:1, utilizing a conversion
on a 6:1 basis may be misleading as an indication of value.
OOI P
Original Oil-In-Place ("OOIP") is used by Hemisphere in this presentation as an equivalent to Discovered Petroleum Initially‐In‐Place ("DPIIP"). DPIIP, as defined in the Canadian Oil and Gas Evaluation Handbook, is that quantity of
petroleum that is estimated, as of a given date, to be contained in known accumulations prior to production. The recoverable portion of DPIIP includes production, reserves and contingent resources; the remaining portion of DPIIP is
unrecoverable. It should not be assumed that any portion of the OOIP/DPIIP set forth in this presentation is recoverable other than the portion which has been attributed reserves by McDaniel. There is uncertainty that it will be
commercially viable to produce any portion of the OOIP/DPIIP other than the portion that is attributed reserves. The OOIP/DPIIP set forth in this presentation has been provided for the sole purpose of highlighting the recovery
factors for the reservoirs that have been attributed reserves. The OOIP/DPIIP volumes for Hemisphere's Atlee Buffalo property disclosed in this presentation are from the mapping of the reservoirs by McDaniel (who is independent of
Hemisphere) in connection with preparing the McDaniel Reserve Report. All OOIP/DPIIP estimates set forth herein are provided as of December 31, 2017.
14Advisory Statements
Drilling Locations
This presentation discloses drilling locations in two categories: (i) booked locations; and (iii) unbooked locations. Proved locations and probable locations, which are sometimes collectively referred to as "booked locations", are
derived from the McDaniel Reserve Report and account for drilling locations that have associated proved or probable reserves, as applicable. Unbooked locations, are internal estimates based on the Company's prospective acreage
and an assumption as to the number of wells that can be drilled per section based on industry practice and internal review. Unbooked locations do not have attributed reserves or resources. Of the 30 locations identified at Jenner
in this presentation, 8 are proved locations, 1 is a probable location and 21 are unbooked locations. Of the 46 drilling locations (producers) shown on the map at Atlee Buffalo, 10 are proved locations, 2 are probable locations,
and 34 are unbooked locations.
Unbooked locations have specifically been identified by management as an estimation of Hemisphere's anticipated drilling activities based on evaluation of applicable geologic, seismic, and engineering, production and reserves
data on prospective acreage and geologic formations. The drilling locations on which Hemisphere will actually drill wells ultimately depends upon the availability of capital, regulatory approvals, seasonal restrictions, oil and natural
gas prices, costs, actual drilling results and other factors. While certain of the unbooked drilling locations have been derisked by drilling existing wells in relative close proximity to such unbooked drilling locations, certain unbooked
drilling locations are farther away from existing wells where management has less information about the characteristics of the reservoir and therefore there is more uncertainty whether wells will be drilled in such locations and if
drilled there is more uncertainty that such wells will result in additional oil and gas reserves, resources or production.
Analogous I nform ation
The information concerning Upper Mannville N2N and YYY analogue pools may be considered to be "analogous information" within the meaning of applicable securities laws. Such information was obtained by Hemisphere
management throughout the year ended December 31, 2017 from various public sources including information available to Hemisphere through AccuMap (a mapping, data management and analysis software for companies
operating in the Western Canadian Sedimentary Basin). Management believes such information is analogous to the Upper Mannville F and G pools in which Hemisphere has an interest and is relevant as it may help to
demonstrate the reaction of such pools (in which Hemisphere has an interest) to waterflood stimulations. Hemisphere is unable to confirm whether the analogous information was prepared by a qualified reserves evaluator or
auditor or in accordance with the COGE Handbook and whether such evaluator or auditor was independent and therefore, the reader is cautioned that the data relied upon by Hemisphere may be in error and/or may not be
analogous to the oil pools in which Hemisphere holds an interest.
I nitial Production Rates and Estim ated Ultim ate Recoveries
Initial production rates disclosed herein are not determinative of the rates at which the wells will continue to produce and decline thereafter and may not necessarily be indicative of long-term performance or estimated ultimate
recovery. Such rates should be considered preliminary. The term "estimated ultimate recovery" is the estimated quantity of petroleum that is potentially recoverable or has already been recovered from a well. Estimated ultimate
recovery does not have a standardized meaning and may not be comparable to similar measures presented by other companies. As such, it should not be used to make comparisons. Management uses estimated ultimate recovery
for its own performance measurements and to provide readers with measures to compare the Company's performance over time; however, such measure is not a reliable indicator of the Company’s future performance and future
performance may not compare to the performance in previous periods and therefore should not be unduly relied upon.
N on-I FRS M easures
The presentation contains terms that are non-IFRS measures and commonly used in the oil and gas industry which are not defined by or calculated in accordance with International Financial Reporting Standards ("IFRS"), such as:
(i) funds flow from operations or annualized funds flow; (ii) net debt; and (iii) operating field netback per boe. These terms should not be considered an alternative to, or more meaningful than the comparable IFRS measures (as
determined in accordance with IFRS) which in the case of funds flow from operations is cash provided by operating activities and cash flow from operating activities and in the case of operating field netback is net income or net
loss. There is no IFRS measure that is reasonably comparable to net debt. These measures are commonly used in the oil and gas industry and by Hemisphere to provide shareholders and potential investors with additional
information regarding: (i) in the case of funds flow from operations, the Company's ability to generate the funds necessary to support future growth through capital investment and to repay any debt; (ii) in the case of operating
field netback per boe, the indication of the Company's profitability relative to current commodity prices; and (iii) in the case of net debt, the capital structure of the Company.
15Don Simmons, President & CEO Telephone: 604.685.9255 Email: simmons@hemisphereenergy.ca Scott Koyich, Investor Relations Telephone: 403.619.2200 Email: scott@briscocapital.com Suite 501 – 905 West Pender Street Vancouver, British Columbia V6C 1L6
You can also read