2021 Mid-Year Review 19 August 2021 - CNOOC LIMITED
←
→
Page content transcription
If your browser does not render page correctly, please read the page content below
2021 Mid-Year Review
19 August 2021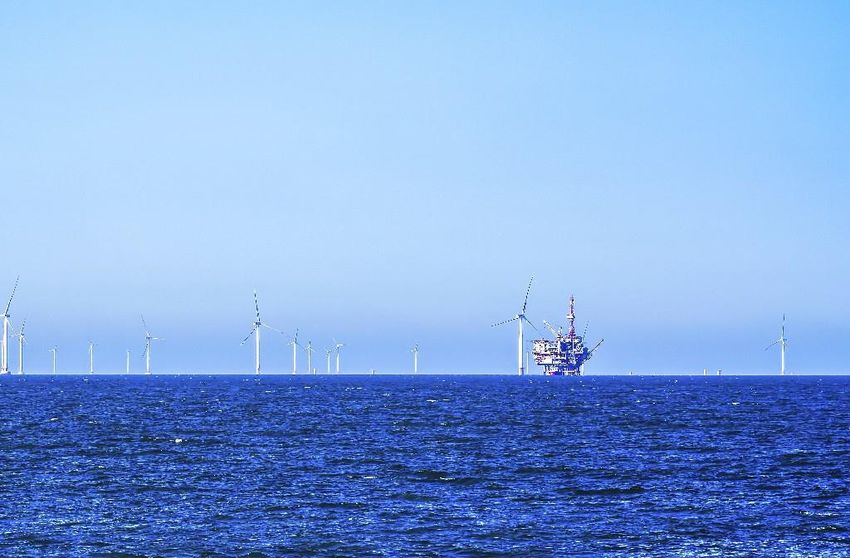
Board of Directors and Management at Today's Conference

                       Chairman    Wang Dongjin

                       CEO         Xu Keqiang

                       President   Xia Qinglong

                       CFO         Xie Weizhi

                                                          2
Disclaimer
This presentation includes “forward-looking statements” within the meaning of the United States Private Securities Litigation Reform Act
of 1995, including statements regarding expected future events, business prospectus or financial results. The words “expect”,
“anticipate”, “continue”, “estimate”, “objective”, “ongoing”, “may”, “will”, “project”, “should”, “believe”, “plans”,
“intends” and similar expressions are intended to identify such forward-looking statements. These statements are based on assumptions
and analyses made by the Company in light of its experience and its perception of historical trends, current conditions and expected future
developments, as well as other factors that the Company believes are appropriate under the circumstances. However, whether actual results
and developments will meet the expectations and predictions of the Company depends on a number of risks and uncertainties which could
cause the actual results, performance and financial condition to differ materially from the Company's expectations, including but not limited
to the company and its controlling shareholder being listed in the list of the U.S. for sanction against companies with alleged ties to the
Chinese military, those associated with fluctuations in crude oil and natural gas prices, macro-political and economic factors, changes in the
tax and fiscal regimes of the host countries in which we operate, the highly competitive nature of the oil and natural gas industry,
environmental responsibility and compliance requirements, the Company's price forecast, the exploration and development activities,
mergers, acquisitions and divestments activities, HSSE and insurance policies and changes in anti-corruption, anti-fraud, anti-money
laundering and corporate governance laws. For a description of these and other risks and uncertainties, please see the documents the
Company files from time to time with the United States Securities and Exchange Commission, including the Annual Report on Form 20-F
filed in April of the latest fiscal year.

Consequently, all of the forward-looking statements made in this presentation are qualified by these cautionary statements. The Company
cannot assure that the results or developments anticipated will be realised or, even if substantially realised, that they will have the expected
effect on the Company, its business or operations.

                                                                                                                                                   3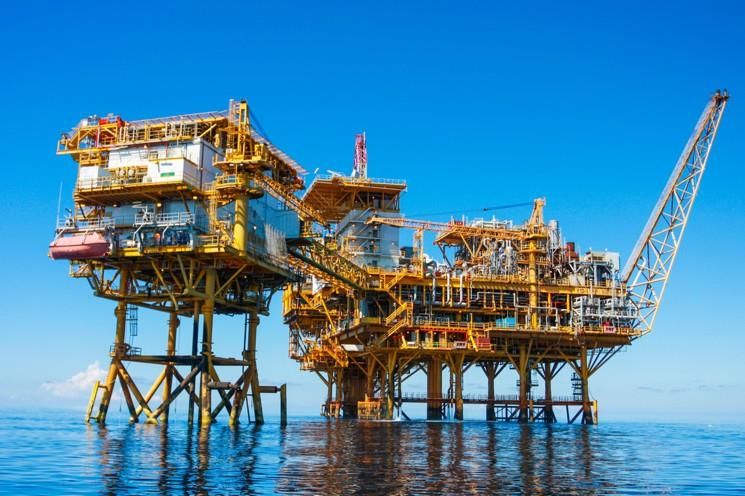
Agenda
Macro Environment
Operating Results
Performance Highlights
Outlook
4
Macro Environment

                    5
Robust Global Economic Recovery
The World Bank forecasted that the global and China's economy will grow by 5.6% and 8.5% in 2021,
respectively
Global economic growth
10%
8%
6%
4%
2%
0%
-2%
-4%
-6%
2020 2021 Forecast
Global Advanced economies EMDEs (excl. China) China
Source: World Bank
6
Oil Demand to Grow Steadily
IEA forecasted that the global oil demand will continue to grow steadily along with the global
economy recovery
Global Oil Demand Forecast
(mmboe/day)
110
105
100
95
90
85
80
2014 2015 2016 2017 2018 2019 2020 2021 2022 2023 2024 2025 2026
2021 Forecast Pre-pandemic Forecast
Source: International Energy Agency(IEA)
7
Global Pandemic Development Remains Uncertain
The number of newly confirmed COVID-19 cases worldwide continued to fluctuate, making the
economic recovery uncertain
The number of newly confirmed COVID-19 cases worldwide (weekly)
(million)
6
5
4
3
2
1
0
2020/3/1 2020/5/1 2020/7/1 2020/9/1 2020/11/1 2021/1/1 2021/3/1 2021/5/1 2021/7/1
Source: WHO
8
Oil Price Trend
International oil price rose significantly in 1H 2021, and the average Brent price increased by 54.9% YoY
Oil price forecast beyond 2021 expected to fluctuate around the current level
International Oil Price Trend (including forecast)
(US$/barrel)
80
70
60
50
40
30
20
10
0
2021/1/1 2021/3/1 2021/5/1 2021/7/1 2021/9/1 2021/11/1 2022/1/1 2022/3/1 2022/5/1 2022/7/1
Brent WTI
Source: Bloomberg
9
Operating Results

                    10
Overview
Major project of Lingshui 17-2 gas fields commenced
production
A breakthrough in 1500m ultra-deepwater independent
exploration and development
Significant results in reserve and production growth
9 new discoveries were made and 14 oil and gas structures
were successfully appraised
6 out of 19 new projects planned for 2021 successfully came
on stream
Net production reached 278.1 million boe*, a new record high
Strong growth in net profit
Oil & gas sales of RMB 100.63 billion, up 51.7% YoY
Net profit of RMB 33.33 billion , up 221.0% YoY
Interim dividend of HK$0.30 per share (tax inclusive)
* Including our interests in equity-accounted investees
11Results Summary
1H 2020 1H 2021 Change %
Production (mm boe) 257.9 278.1 7.9%
- Crude and liquids (mm bbls) 205.5 222.6 8.4%
- Natural gas (bcf) 304.5 323.1 6.1%
Realized oil price (US$/bbl) 38.72 62.38 61.1%
Realized gas price (US$/mcf) 6.29 6.60 5.0%
Oil & gas sales (RMB mm) 66,335 100,625 51.7%
Net profit (RMB mm) 10,383 33,326 221.0%
Basic EPS (RMB) 0.23 0.75 221.0%
*受同一控制下企业合并的影响,2019年上半年报表数据已经重述
12Production Summary
1H 2020 1H 2021
Crude and Liquids Natural Gas Total Crude and Liquids Natural Gas Total
(mm bbls) (bcf) (mm boe) (mm bbls) (bcf) (mm boe)
China
Bohai 82.1 28.3 86.8 87.8 30.7 92.9
Western South China Sea 20.0 76.3 33.2 19.2 80.7 33.3
Eastern South China Sea 36.2 73.2 48.4 46.0 71.7 58.0
East China Sea 1.1 10.4 2.8 1.2 13.2 3.3
Onshore - 16.0 2.7 - 31.9 5.3
Subtotal 139.4 204.2 173.9 154.1 228.1 192.8
Overseas
Asia (Ex. China) 7.8 27.0 12.6 11.9 27.3 16.8
Oceania 0.8 21.9 5.1 0.7 19.0 4.4
Africa 17.3 - 17.3 15.9 - 15.9
North America (Ex. Canada) 11.7 24.3 15.8 11.9 22.1 15.5
Canada 9.6 0.05 9.6 11.3 - 11.3
South America 8.5 25.4 12.9 9.9 26.0 14.3
Europe 10.4 1.6 10.7 7.0 0.6 7.1
Subtotal 66.1 100.3 83.9 68.5 95.0 85.4
Total* 205.5 304.5 257.9 222.6 323.1 278.1
* Including our interests in equity-accounted investees, which is approximately 9.6 mm boe in 1H 2021 and 9.7 mm boe in 1H 2020.
In 1H 2021, production percentage of China and overseas was 69% v.s. 31%; Crude and liquids and natural gas was 80% v.s. 20%.
13Exploration Activities
Aiming at mid-to-large sized oil and gas discoveries, increased efforts on venture exploration and strengthened
integration of exploration and development
7 new discoveries and 14 successfully appraised oil and gas structures in offshore China,2 new discoveries were
made overseas
Exploration workload and new discoveries*
1H 2020 1H 2021
Type
Offshore China Overseas Offshore China Overseas
Wildcat 32** 2 32** 4
Appraisal 79 0 74 4
3D Seismic(km2) 12,388 3,512 6,421 2,701
New discovery 4 1 7 2
* Excluding onshore unconventional wells (31 exploration wells and 304 km2 of 3D seismic acquisition in 1H 2020;
55 exploration wells and 431 km2 of 3D seismic acquisition in 1H2021)
** Including PSC wells (1 well in H1 2020; 1 well in H1 2021)*
14New projects in 2021
Peak Production Working Peak Production Working
Project Status Project Status
(boe/d) Interests (boe/d) Interests
Installation and
Offshore China Luda 5-2 oilfield North 6,900 100%
commissioning
Onshore Installation and
Bozhong 19-4 oilfield adjustment 9,300 83.8% Luda 6-2 oilfield 9,000 100%
construction commissioning
Installation and Qinhuangdao/Caofeidian onshore power Installation and
Bozhong 26-3 oilfield expansion 2,060 100% 7,400 75.5%
commissioning project commissioning
Installation and Commenced
Caofeidian 11-6 oilfield expansion 4,600 51% Lingshui 17-2 gas fields development 58,000 100%
commissioning production
Commenced Commenced
Caofeidian 6-4 oilfield 15,000 100% Weizhou 11-2 oilfield phase II 5,600 100%
production production
Onshore Commenced
Jinzhou 31-1 gas field 2,100 100% Liuhua 21-2 oilfield 15,070 100%
construction production
Onshore Commenced
Kenli 16-1 oilfield 7,500 100% Liuhua 29-2 gas field 7,200 100%
construction production
Kenli 6-1 oilfield block 4-1 development Onshore Installation and
3,400 100% Lufeng oilfields regional development 42,600 100%
project construction commissioning
Commenced Overseas
Luda 29-1 oilfield 2,890 100%
production
Installation and Installation and
Luda 4-2 oilfield block 4-3 5,900 100% Buzzard oilfield Phase II 12,000 43.21%
commissioning commissioning
Onshore
Mero oilfield phase I 171,000 10%
construction
15Key Financial Items - Consolidated
(RMB mm) 1H 2020 1H 2021 Change %
Revenue
Oil and gas sales 66,335 100,625 51.7%
Marketing revenues 6,497 6,370 -2.0%
Other revenue 1,728 3,238 87.4%
Revenue subtotal 74,560 110,233 47.8%
Expenses
Operating expenses (11,346) (12,711) 12.0%
Taxes other than income tax (3,421) (4,879) 42.6%
Exploration expenses (2,560) (5,025) 96.3%
DD&A (26,309) (28,916) 9.9%
Special oil gain levy (79) (335) 324.1%
Impairment and provision (3,133) (57) -98.2%
Crude oil and product purchases (6,179) (6,251) 1.2%
SG&A (3,807) (3,872) 1.7%
Others (2,147) (2,738) 27.5%
Expenses subtotal (58,981) (64,784) 9.8%
Profit from Operating Activities 15,579 45,449 191.7%
Interest income 758 542 -28.5%
Finance costs (3,130) (2,838) -9.3%
Exchange (losses)/gains, net (16) 177 -1206.3%
Investment income 1,786 1,079 -39.6%
Share of profits of associates 202 365 80.7%
(Loss)/profit attributable to a joint
venture (224) 104 -146.4%
Other (expense)/income, net (9) 95 -1155.6%
Profit before tax 14,946 44,973 200.9%
Income tax expense (4,563) (11,647) 155.2%
Net profit 10,383 33,326 221.0%
16Change Analysis of Net Profit
(RMB mm)
60,000
6,093
50,000 36,874
8,677 1,458 3,076 812
256
40,000 1,365
2,465
2,607
7,084
30,000
20,000
33,326
10,000
10,383
-
17Movement of Financial Position
(RMB bn) Total assets mainly include:
Dec 31, 2020 Jun 30, 2021 RMB448.1 bn of PP&E
Cash, cash equivalent and
time deposits with maturity 83.5
over three months 65.8
97.6
112.0 RMB68.8 bn of corporate wealth
Other Current Assets
management
Non-current Assets 557.9
560.5 Equity increased by RMB23.7 bn:
Net profit of RMB33.3 bn
Other Liabilities 161.9 Dividend paid of RMB9.3 bn
143.8
Debt 143.5 136.5 Other comprehensive income
Equity
433.9 457.6
As at Dec 31, As at Jun30,
2020 2021
Total Assets (RMB bn): 721.3 756.0
Gearing Ratio* 24.9% 23.0%
* Gearing ratio = Interest Bearing Debt / (Interest Bearing Debt + Equity)
18Movement of Cash and Cash Equivalents
Free cash flow reached RMB 32.95 bn
(RMB mm)
120,000
100,000
64,159
80,000
31,207
60,000 5,822 4,695
733 9,857
3,241
7,290
551
40,000
47,282
20,000
24,019
-
*Free cash flow = Net operating cash inflow - Cash capex outflow .
19All-in Cost per BOE
Overcame the pressure of rising commodity prices, RMB appreciation against USD and strengthened
our cost competitiveness
(US$/boe) 29.00 28.98
30
25.72
2.78 2.81
2.11 1.96 2.23
25 0.66 0.84
2.18
0.92
20
16.07 15.79
15 14.16
10
5 7.39 6.50 7.31
0
1H 2019 1H 2020 1H 2021
Brent price
66.17 42.10 65.23
(US$/boe)
Opex DD&A Dismantlement SG&A Taxes other than income tax
20Cost Analysis
Opex DD&A
(US$/boe) (US$/boe)
7.39 6.50 7.31 16.07 14.16 15.79
1H 2019 1H 2020 1H 2021 1H 2019 1H 2020 1H 2021
Slightly increased year over year, mainly due Slightly increased year over year, mainly
to certain oil fields' scheduled overhaul and due to the changes in production mix
changes in RMB exchange rate and RMB exchange rate
21Capex
(RMB bn)
35.6 36.0
40
0.2 0.2
6.8 8.4
30
20 21.7 19.1
10
6.9 8.3
0
1H 2020 1H 2021
Exploration Development Production Others
Note: Above amounts exclude capitalized interest of RMB1.3 bn and RMB1.1 bn in 1H 2020 and 1H 2021 respectively.
22Dividend
2021 interim dividend: HK$0.30 per share (tax inclusive)
Dividend yield of 7.1%(1), payout ratio of 33.4%(2)
Time arrangement:
Book close period: September 6 – September 10
Payment date: October 13
(1) Based on closing share price of HK$7.70 as of July 30, 2021
(2) Exchange rate quoted HK$1= RMB0.83120 as of July 30, 2021
23Performance Highlights
24Significant Improvement of Operating Results
Ramped up reserve and production, net production reached a record high of 278.1 million BOE
Profitability improved significantly, with Brent price at $65.2, net profit reached a level similar to the years with
Brent price above $100
Net production, net profit and average Brent oil price in last ten years (first half of the year)
(net production: mmboe/
(US$/barrel)
net profit: RMB100 million)
400 120
100
300
80
200
60
100
40
0
20
1H 2012 1H 2013 1H 2014 1H 2015 1H 2016 1H 2017 1H 2018 1H 2019 1H 2020 1H 2021
-100 Net Production Net Profit Brent 0
25Major Project of Lingshui 17-2 Gas Fields Commenced
Production
Gaining the capability of 1500m ultra-deepwater
independent exploration and development
The “Shenhai-1”energy station supporting Lingshui
17-2 gas fields project came on stream on 25th June
Streamlined the management and completed
construction in only 3 years
Enhanced natural gas supply capacity
Produce 3 billion cubic meters of natural gas for 10
consecutive years
Promote efficient development of adjacent gas fields
in the future
Provide low-carbon energy supply to the Guangdong,
Hong Kong, and Hainan region
26Exploration Achievements – Offshore China
Continued to promote the appraisal of mid-to-large sized oil and gas fields, expanded the venture
exploration of new areas, new fields, new types and new layers
Significant progress in appraisal of Kenli 10-2
Luda 10-6
Located in the southern part of Laizhou Bay Depression in Bohai
The proved in-place volume was nearly 100 million tons, indicating broad
Bohai
exploration prospects of shallow lithologic reservoirs in Bohai
Medium-sized commercial discovery made in Luda 10-6
Located in the Liaoxi uplift in Bohai
Kenli 10-2
Discovered commercial high-yielding oil and gas flow, expected to become a
medium-sized oil and gas field
Breakthrough in appraisal of Wenchang 9-7
Located in Wenchang, A Depression in the Pearl River Mouth Basin
Eastern South
China Sea The largest oil discovery in this depression in the past 10 years, expected to
become a medium-sized oil and gas field
Baodao 21-1
Wenchang 9-7 New exploration progress made in Baodao 21-1
The high-yield gas flow achieved from the test showed the prospect of 100 billion
cubic meters of resources in Baodao sag and adjacent area
Note: According to the Regulation of Offshore Petroleum Reserves Estimation of China, a mid-size oil field is defined as a
field with technically recoverable resources of ≥2,500~<25,000 thousand cubic meters and a large-size oil field is defined as a
field with technically recoverable resources of ≥25,000~<250,000 thousand cubic meters.
27Exploration Achievements – Overseas
Two new discoveries of Uaru-2 and Longtail-3
achieved in Stabroek Block, Guyana
Well Uaru-2 encountered oil pay zones with a thickness
of ~37 meters, at a water depth of 1,725 meters
Uaru-2
Well Longtail-3 encountered oil pay zones with a
thickness of ~70 meters, at a water depth of 1,860
meters
Total recoverable resources exceeded 9 billion boe*,
expected to be further enhanced
Longtail-3
* According to the disclosure of the Operator
28Stable Oil and Gas Production Growth
Accelerated production capacity construction
Lingshui 17-2 gas fields, Caofeidian 6-4 oil field and
other projects commenced production ahead of
schedule
Increased oil and gas production through various
measures
High workload of water control and oil stabilization,
which effectively lowered oil and gas field decline rate
Shortened cycle of infill drilling wells, improving
production performance
Continuously carried out thermal recovery of heavy oil
and improvement of low efficiency wells
Optimized production and operation procedure
Accelerated the speed of drilling and completion
29Maintain Cost Competitiveness
Continued to explore the law of cost reduction and
efficiency enhancement
Established a KPI system of cost control
Formed a system covering the whole process of
exploration, development, production, sales and other
aspects
Strengthened benchmarking analysis, early warning
and monitoring of key costs items
Implementing cost control throughout the whole cycle
Strengthened cost competitiveness through
collaboration and integration of business operation
and financial management
30Impressive Results in Technology Innovation
New achievements in key scientific and technological
development
The world's first 100,000-ton deepwater semi-submersible
production and storage platform, “Shenhai-1", independently
developed and put into production
Increased production by intelligent water injection and heavy oil
thermal recovery technologies
Promoted drilling and completion technology research and
improved drilling efficiency
Digitalization progressed smoothly
Built Dongfang Gas Fields, with the intellectualized system
covering the whole production process
Completed the unmanned technical transformation of 9 offshore
platforms, launched the trial of intelligent oilfield system
31Low-carbon Transition and Sustainable Development
Accelerated the progression of low-carbon
operation and emission reduction
Implemented entire process of energy saving and emission
reduction plan
Promoted reduction of effluent from offshore platforms
Increased proportion of natural gas exploration and
development
Consistently promoted onshore power project
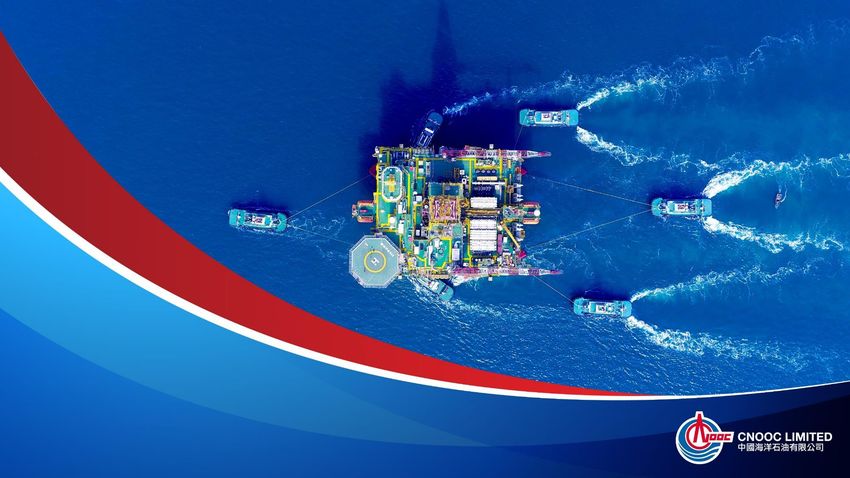
Actively developed new energy business
Established New Energy Department to proactively develop new
business
Leveraged differentiated advantages and continued to develop
offshore wind power projects
32ESG Management
Practice the concept of environmental protection
Strengthened the complete management process for environmental
protection, enforced corporate environmental responsibility throughout
all operating aspects
Fulfill social responsibility
Includes offshore rescue, targeted poverty alleviation, community
development, volunteer services, etc.
Strict corporate governance
Adhere to high standards of business ethics, operating with integrity
and compliance
Market recognition
Ranked 13th place in “2021 Brand Finance Top 50 Most valuable Global Oil & Gas Brands’list”, February 2021
Recognized as "2021 Forbes China - Most Sustainable Employer of the Year" , July 2021
Honoured as Oil & Gas sector's “Best ESG”in Institutional Investor's “2021 All Asia Executive Awards”, July 2021
33Pandemic Control and Safety Responsibility
Strictly implement regular prevention and control of the
pandemic
Strengthened pandemic prevention efforts and control in offices
and work sites
Encourage vaccination for staff, the vaccination rate of offshore
employees reached 99.2%
Strengthened safety management
Define safety management responsibilities, completed full
inspection of major production facilities and drilling rigs
Established an expert database, conducted regular well control
inspections
Improve safety management based on lessons learned from the V
platform accident
34Outlook
35Low-carbon Development Strategy
Build a low-carbon development system
Leveraging the company's comparative advantages to
integrate the development of oil and gas business and new
energy business
Continuously increasing the supply of natural gas and
promote green and low-carbon products
Accelerate the construction of green oil fields, focusing on
energy saving and carbon reduction in the entire
development process
Actively explore new energy development
Drive development of offshore wind power projects
Develop onshore photovoltaic and onshore wind power on a
selective basis
362H 2021 Plan
Strive to achieve the annual production and
operation targets
Production target of 545-555 mmboe
Capex plan of RMB 90-100 billion
Reserve replacement ratio of over 120%
Continue to promote high-quality development
Accelerate reserve and production growth
Strengthen cost control
Maintain high standards on HSE performance
37Thank you!
38You can also read