Q3 & 9M FY20 RESULT UPDATE - January 2020 - cloudfront.net
←
→
Page content transcription
If your browser does not render page correctly, please read the page content below
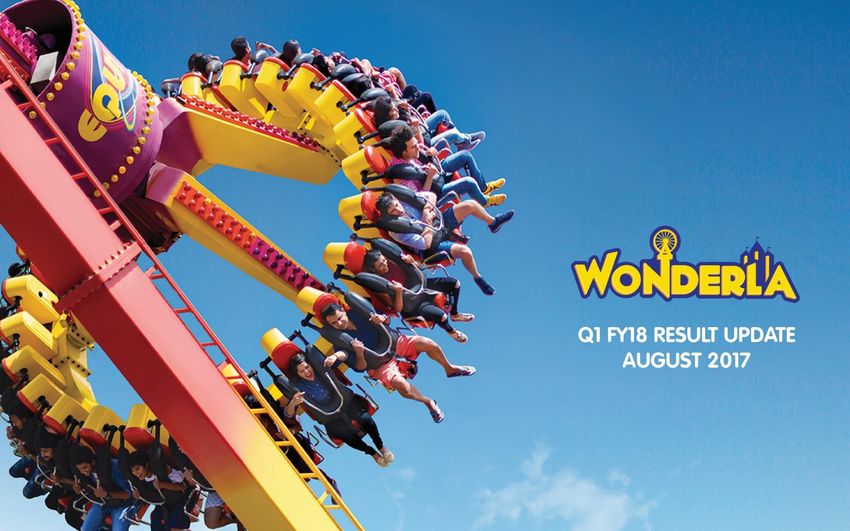
Q3 & 9M FY20 RESULT UPDATE
       January 2020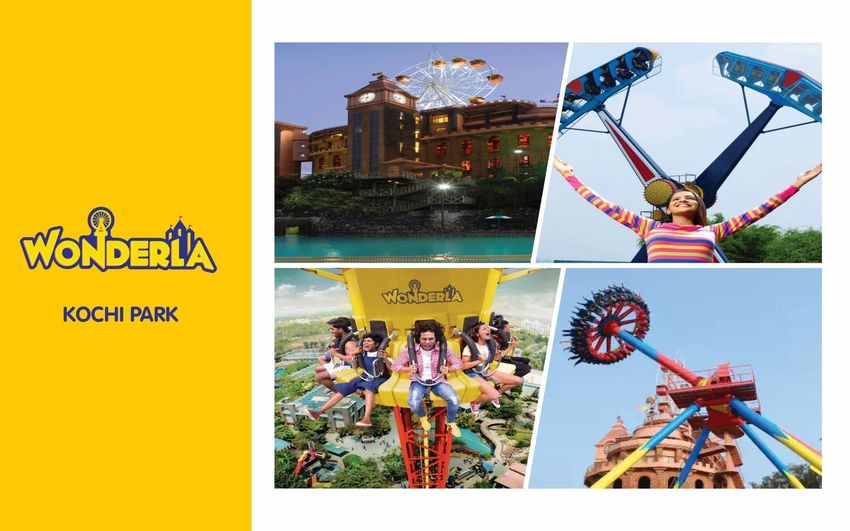
• Q3 & 9M FY20 RESULT HIGHLIGHTS
• Q3 & 9M FY20 PORTFOLIO UPDATE
   • AMUSEMENT PARK, BANGALORE
   • RESORT, BANGALORE
   • AMUSEMENT PARK, KOCHI
   • AMUSEMENT PARK, HYDERABAD
• FINANCIALS
• COMPANY OVERVIEW

                                   2
Q3 & 9M FY20 RESULT HIGHLIGHTS

                                       Q3 FY20 YoY Analysis                                                    In Rs Mn

               REVENUES               EBITDA & EBITDA MARGIN               CASH PAT, PAT & PAT MARGIN
                                     39.1%              35.6%                                        30.0%
                                                                             19.1%
                                                                 40. 0%

     760.5
                           700.1                                 35. 0%

                                                                                                             315.0
                                      297.7
                                                                 30. 0%

                                                                                  243.7
                                                        249.6    25. 0%

                                                                                                  210.3
                                                                 20. 0%

                                                                          145.2
                                                                                                             29.3%
                                                                 15. 0%

               7.9%                            16.2%             10. 0%

                                                                                          44.9%
                                                                 5.0 %

                                                                 0.0 %

    Q3 FY19               Q3 FY20    Q3 FY19           Q3 FY20              Q3 FY19                 Q3 FY20
                                                                          PAT         Cash PAT            PAT Margin %

                                       9M FY20 YoY Analysis
               REVENUES               EBITDA & EBITDA MARGIN               CASH PAT, PAT & PAT MARGIN

                                                                              21.9%                   27.7%
     2,212.3               2,284.5    43.5%            43.3%
                                                                                                             946.4
                                                                                  780.6
                                      963.2             990.3
                                                                          484.3                   632.2

                                               2.8%                                                          21.2%
               3.3%                                                                       30.5%

    9M FY19               9M FY20    9M FY19           9M FY20              9M FY19                 9M FY20
                                                                           PAT        Cash PAT            PAT Margin %
                                                                                                                          3
Q3 FY20 RESULT HIGHLIGHTS

FINANCIAL UPDATE

▪ Q3 FY20 Revenue from operations seen at Rs 700.12 mn impacted majorly by 5.3% YoY decline in footfalls attributable to poor
  consumer sentiment & reduced discretionary spends, and 2.6% YoY reduction in avg. revenue per visitor

▪ Q3 FY20 ticket revenue reduced by 10% YoY and non-ticket revenue reduced by 3% YoY
   ▪ Kochi park witnessed 1.2% YoY growth in avg. ticket revenue, 4.8% YoY growth in avg. non-ticket revenue and 2% YoY growth in
     footfalls.
   ▪ Hyderabad park witnessed 8.6% YoY reduction in avg. ticket revenue, avg. non-ticket revenue was flat and 9% YoY growth in
     footfalls.
   ▪ Bangalore park witnessed 2.2% YoY reduction in avg. ticket revenue, 6.7% YoY growth in avg. non-ticket revenue and 22% YoY
     reduction in footfalls.

▪ Q3 FY20 EBITDA at Rs 250 mn, down by 16% YoY. EBITDA margin at 36% in Q3 FY20 vs 39% in Q3 FY19

▪ Q3 FY20 PAT increased by 45% YoY from Rs 145.2 mn to Rs. 210.3 mn. PAT margin increased from 19% in Q3 FY19 to 30% in Q3
  FY20 on account of exceptional item. The company has opted to avail Sabka Vikas (Legacy Dispute Resolution) Scheme, 2019
  announced by the Government of India in Sept. 2019. As per this scheme, the company will get relief ranging from 40% to 70% of
  the disputed service tax demands and full waiver of interest and penalty thereon. Accordingly, the payments made during the
  current quarter towards settlement of these pending litigations under the scheme and the earlier payments made under protest
  have been adjusted against the provision and the excess balance as per the books has been reversed as income during the quarter
  ending 31st Dec. 2019.

▪ Q3 FY20 Cash PAT (PAT + depreciation) increased by 29% YoY from Rs. 244 mn to Rs 315 mn, indicating continued generation of
  healthy operating cash flows which will be employed for upcoming projects
                                                                                                                                    4
Q3 FY20 RESULT HIGHLIGHTS

NEW PROJECTS UPDATE

▪ Chennai : The Company has acquired 64 acres of land for the new Amusement Park project in Kelambakkam in
  Chennai. The Government of Tamil Nadu has given exemption to the Company from levy of Entertainment Tax
  under Tamil Nadu Local Authority Entertainment Tax Act for a period of 5 years commencing from 1st November
  2019. Consequently, the Company shall be commencing construction of the Chennai Project soon, subject to
  necessary Project approvals by the Authorities. The Company is in the process of getting project approval from
  the Tamil Nadu Single Window Guidance Bureau.

▪ Odisha : We have received an offer from the Government of Odisha for setting up an amusement park. The land
  will be given on a long-term lease and our strategy is to develop asset light amusement park at an estimated cost
  of Rs.100 crores. This model will enable us to offer entry ticket at affordable rates. The board has approved the
  proposal after evaluating the feasibility and decided to proceed with the project.

▪ Means of Finance : The above projects will be funded through internal accruals and term loans.

                                                                                                                      5
Q3 & 9M FY20 REVENUE ANALYSIS

                                                                                                                                                 In Rs Mn

                     SERVICES VS. PRODUCTS                                                        PORTFOLIO BREAKUP
         760.5             700.1           2,212.3         2,284.5            760.5               700.1              2,212.3                2,284.5
                                                                      4%                  3.9%                3.9%                  3.9%
 25.6%            26.7%            23.5%              23.5%                                                  26.5%                  26.9%
                                                                     26.1%                29.0%
                                                                                                             24.3%                  27.7%
                                                                     28.2%                31.9%
 74.4%            73.3%             76.5%              76.5%
                                                                     41.7%               35.2%               45.3%                  41.5%

        Q3 FY19        Q3 FY20         9M FY19             9M FY20           Q3 FY19             Q3 FY20          9M FY19                  9M FY20

                  Services                      Products               Park - Bangalore       Park - Kochi   Park - Hyderabad        Resort - Bangalore

                      TICKET VS. NON-TICKET                                                   TOTAL FOOTFALLS (In ‘000)
         760.5             700.1       2,212.3             2,284.5
                                                                                                                  1,937.2                  1,976.0
29.2%             30.7%            27.6%              27.8%

                                                                              760.4               720.0
 70.8%            69.3%            72.4%              72.2%
                                                                                       5.3%                                    2%

     Q3 FY19          Q3 FY20          9M FY19             9M FY20           Q3 FY19            Q3 FY20          9M FY19               9M FY20

                  Ticket                      Non-Ticket
                                                                                                                                                          6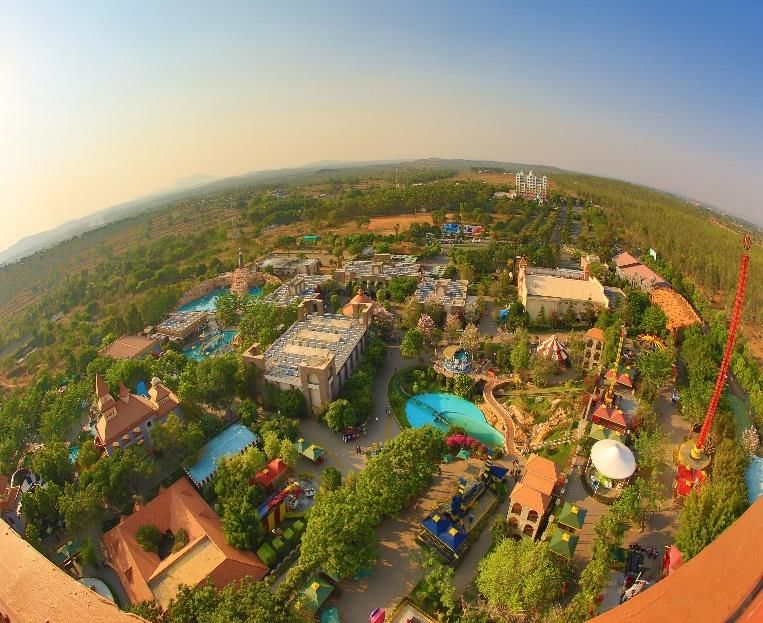
Q3 & 9M FY20 REVENUE ANALYSIS

               AVG. REVENUE PER VISITOR (PARKS) (In Rs) *                                     AVG. TICKET REVENUE PER VISITOR (PARKS) (In Rs)

                                                1,097.8             1,110.8
          959.5              934.3                                                                                             826.6               834.3
                                                                                         707.8              673.8

                    2.6%                                   1.2%                                     4.8%                                0.9%

        Q3 FY19             Q3 FY20            9M FY19             9M FY20              Q3 FY19            Q3 FY20            9M FY19          9M FY20

         AVG. NON-TICKET REVENUE PER VISITOR (PARKS) (In Rs)                        BREAK-UP OF NON-TICKET REVENUE (PARKS + RESORT) (In Rs Mn) *

                                                                                    5.5%               5.6%             7.3%               7.4%
                                                                                    13.9%              12.8%           14.1%               14.1%

                                                                                    34.5%              33.5%           36.0%
          251.7              260.5               271.2              276.5                                                                  35.0%
                     3.5%                                   2%
                                                                                    46.1%              48.1%               42.6%           43.5%

        Q3 FY19             Q3 FY20            9M FY19            9M FY20                   Q3 FY19         Q3 FY20           9M FY19          9M FY20
* Includes sale of services, sales of products & other operating income.                     Restaurants        Products          Resort        Others

                                                                              Q3 FY15                                                                      7
8
PORTFOLIO UPDATE – AMUSEMENT PARK, BANGALORE

•       Launched in 2005 by the name ‘Wonderla’

•       Wonderla Bangalore is located off the Bangalore-Mysore highway, 28
        km from Central Bangalore

•       Situated on 81.75 acres of land with 61 land and water based
        attractions and other allied facilities

•       5 company-operated restaurants offering various cuisines

•       The park has won 13 awards since inception

•       Launched Wave Rider - A family ride imported from Italy, it has a cabin
        wherein the riders stand at both sides. Cabin rotates on a pivot giving
        the riders an experience of surfing through waves. The ride has a
        capacity of 12 persons at a time with a duration of 2 minutes per ride.

                                                 Q3 FY20         Q3 FY19       YoY %   LOCATION                          BANGALORE
     Total Revenues (Rs Mn) *                        246.4          316.8       -22%   Total Land Available (In Acres)     81.7
     No of Visitors (In ‘000)                        225.9          290.4       -22%   Developed Land (In Acres)           39.2
     Avg. Revenue Per Visitor (Rs)                   1,091        1,090.8          -   Land Availability for
                                                                                                                           42.5
                                                                                       Future development (In Acres)
                                                 9M FY20        9M FY19        YoY %
     Total Revenues (Rs Mn) *                        947.7        1,001.9        -5%   Total No of Rides                    61
     No of Visitors (In ‘000)                        764.5          837.8        -9%   No of Wet Rides                      21
     Avg. Revenue Per Visitor (Rs)                1,239.6         1,195.9        4%    No of Dry Rides                      40
    * Includes sale of services, sales of products & other operating income.

                                                                                                                                     9
BANGALORE PARK – REVENUE & FOOTFALL ANALYSIS

            AVG. TICKET REVENUE PER VISITOR (In Rs)                             AVG. NON-TICKET REVENUE PER VISITOR (In Rs)

                                          917.0               949.5
    828.7                810.9

                                                                                                  279.8             278.9                290.2
                                                                              262.2
              2.2%                                  3.5%
                                                                                      6.7%                                         4%

   Q3 FY19             Q3 FY20       9M FY19               9M FY20       Q3 FY19              Q3 FY20              9M FY19              9M FY20

    FOOTFALLS – WALK-IN Vs. GROUP / CHANNEL (‘000)                                FOOTFALLS – REGIONWISE BREAKUP (‘000)
     290.4               225.9            837.8               764.5           290.4               225.9             837.8                764.5
                                                                       3.8%                                3.6%         3.4%                 4.0%
                                  25.0%               27.3%            3.4%                                 4.3%         3.2%                4.7%
 46.2%            51.4%                                               10.5%                                                                  13.7%
                                                                                                           10.4%        10.4%
                                                                      71.4%                               69.9%         78.0%                72.1%
                                  75.0%               72.7%
 53.8%           48.6%
                                                                       10.9%                              11.8%             5.1%                 5.5%
    Q3 FY19             Q3 FY20      9M FY19               9M FY20        Q3 FY19             Q3 FY20              9M FY19              9M FY20

                     Walk-in                      Group                 Kerala        Karnataka       Tamil Nadu     Andhra Pradesh         Others

                                                                                                                                                        10
PORTFOLIO UPDATE – WONDERLA RESORT, BANGALORE
• Three Star leisure resort attached to the amusement park; launched
in March 2012
• The resort has 84 luxury rooms
• The resort also has 4 banquet halls / conference rooms, totalling
8,900 sq. ft. with a capacity to hold 800 guests and a well equipped
board room
• Suitable for hosting wedding receptions, parties and other corporate
events and meetings
• Other amenities include a multi-cuisine restaurant, rest-o-bar, solar
heated swimming pool, recreation area, kids’ activity centre and a
well equipped gym
Q3 FY20 Q3 FY19 YoY % 9M F20 9M FY19 YoY %
Total Revenues (Rs Mn) * 27.7 31.3 -11% Total Revenues (Rs Mn) * 90.4 86.4 5%
Total No of Room Nights Total No of Room Nights
7,561 7,549 22,609 22,632
Available (No.) to Guests Available (No.) to Guests
Occupancy % 43% 47% -4% Occupancy % 49% 43% 6%
Avg. Room Rental for the Avg. Room Rental for the
5,025 4,422 14% 4,817 4,634 4%
period (Rs) period (Rs)
* Includes other operating income.
1112
PORTFOLIO UPDATE – AMUSEMENT PARK, KOCHI
•       Launched in 2000 by the name ‘Veegaland’ and operating under the
        name ‘Wonderla’ since April 2008
•       Situated on 93.17 acres of land, and currently occupying 28.75 acres
        for 56 land and water based attractions and other allied facilities
•       6 restaurants offering various cuisines, all are operated by the
        Company. The park has won 18 awards since inception
•       Launched 2 Rides: Fusion Slide - A water tube slide with a diameter
        of 1.4 meter, starts from a height of 9 meter. Two riders can enjoy at a
        time. Inflated tubes are used to carry riders through the slide.
        V R Coaster – This ride is an advanced version of roller coaster, located
        inside a castle themed building which goes up to a height of 6m
        & through 190m track with steep incline, curves and dips. Each rider is
        provided with virtual reality headsets to experience the movement
        through virtual environment along with movement of car through
        track and a synchronised themed video.
                                              Q3 FY20       Q3 FY19        YoY %       LOCATION                          KOCHI
     Total Revenues (Rs Mn) *                        223.1          214.1        4%    Total Land Available (In Acres)   93.2
     No of Visitors (In ‘000)                        265.4          260.3        2%    Developed Land (In Acres)         28.7
     Avg. Revenue Per Visitor (Rs)                   840.6          822.7        2%
                                                                                       Land Availability for
                                                                                                                         64.4
                                                 9M FY20        9M FY19        YoY %   Future development(In Acres)

     Total Revenues (Rs Mn) *                        633.1          537.5       18%    Total No of Rides                  57
     No of Visitors (In ‘000)                        643.1          564.3       14%    No of Wet Rides                    22
     Avg. Revenue Per Visitor (Rs)                   984.5          952.6        3%    No of Dry Rides                    35
    * Includes sale of services, sales of products & other operating income.

                                                                                                                                 13
KOCHI PARK – REVENUE & FOOTFALL ANALYSIS
AVG. TICKET REVENUE PER VISITOR (In Rs) AVG. NON-TICKET REVENUE PER VISITOR (In Rs)
713.6 737.9
596.0 603.1
226.7 237.5 239.0 246.7
1.2% 3.4% 4.8% 3.2%
Q3 FY19 Q3 FY20 9M FY19 9M FY20 Q3 FY19 Q3 FY20 9M FY19 9M FY20
FOOTFALLS – WALK-IN Vs. GROUP / CHANNEL (‘000) FOOTFALLS – REGIONWISE BREAKUP (‘000)
260.3 265.4 564.3 643.1 260.3 265.4 564.3 643.1
2.0% 1.8% 2.8% 2.1%
0.2% 0.4% 0.4%
9.8% 17.3% 0.4%
42.2% 48.6% 19.9%
71.1% 0.5% 1.2% 30.5%
74.6% 0.8%
0.9%
87.5% 79.3% 76.1% 66.1%
57.8%
28.9% 25.4% 51.4%
Q3 FY19 Q3 FY20 9M FY19 9M FY20 Q3 FY19 Q3 FY20 9M FY19 9M FY20
Walk-in Group Kerala Karnataka Tamil Nadu Andhra Pradesh Others
14PORTFOLIO UPDATE – AMUSEMENT PARK, HYDERABAD
• Launched in April 2016 by the name ‘Wonderla’.
• Situated on 49.5 acres of land, and currently occupying 27.0 acres
for 46 land and water-based attractions and other allied facilities.
• 4 company operated restaurants offering various cuisines
• The Park has won 6 awards since inception
• Launched 2 rides: Funky Monkey - Drop Tower specially designed
for children . The ride takes to a maximum height of 4 meters, giving
a miniature experience of a free fall. The capacity of the ride is 6 kids
at a time with a duration of 4 minutes per ride.
Rocking Tug – A family ride imported from Italy; shaped like a ship,
it gives the riders a thrilling ship riding & sailing experience.
Q3 FY20 Q3 FY19 YoY % LOCATION HYDERABAD
Total Revenues (Rs Mn) * 203.2 198.6 2% Total Land Available (In Acres) 49.5
No of Visitors (In ‘000) 228.7 209.7 9% Developed Land (In Acres) 27.0
Avg. Revenue Per Visitor (Rs) 888.3 947.3 -6%
Land Availability for Future
22.5
9M FY20 9M FY19 YoY % development(In Acres)
Total Revenues (Rs Mn) * 614.3 587.1 5% Total No of Rides 44
No of Visitors (In ‘000) 568.5 535.0 6% No of Wet Rides 18
Avg. Revenue Per Visitor (Rs) 1080.5 1,097.3 -2% No of Dry Rides 26
* Includes sale of services, sales of products & other operating income.
16HYDERABAD PARK – REVENUE & FOOTFALL ANALYSIS
AVG. TICKET REVENUE PER VISITOR (In Rs) AVG. NON-TICKET REVENUE PER VISITOR (In Rs)
804.1 788.55
679.0
620.3
293.2 292.0
268.3 268.0
8.6% 1.9% 0.1% 0.4%
Q3 FY19 Q3 FY20 9M FY19 9M FY20 Q3 FY19 Q3 FY20 9M FY19 9M FY20
FOOTFALLS – WALK-IN Vs. GROUP / CHANNEL (‘000) FOOTFALLS – REGIONWISE BREAKUP (‘000)
209.7 228.7 535 568.5 209.7 228.7 535 568.5
8.1% 6.1% 4.7% 5.9%
32% 38%
60% 71%
91.9% 93.9% 95.3% 94.1%
68% 62%
40% 29%
Q3 FY19 Q3 FY20 9M FY19 9M FY20 Q3 FY19 Q3 FY20 9M FY19 9M FY20
Walk-in Group Telangana Others
17FINANCIALS – P&L STATEMENT
Particulars (Rs Mn) Q3 FY 20 Q3 FY 19 YoY % 9M FY 20 9M FY 19 YoY %
Sale of Services 513.4 566.1 -9.3% 1,747.6 1,691.9 3.3%
Sale of products 186.4 194.4 -4.1% 535.5 520.4 2.9%
Other Operating Revenue 0.3 - - 1.5 - -
Revenue from Operations 700.1 760.5 -7.9% 2,284.5 2,212.3 3.3%
Cost of materials consumed 39.5 37.4 5.8% 107.8 99.8 8.0%
Purchase of stock-in-trade 51.5 55.5 -7.3% 136.4 133.7 2.0%
Changes in inventories of stock-in-trade -6.0 -6.4 - -8.3 -3.7 -
Employee benefits expense 103.8 95.7 8.6% 309.6 289.9 6.8%
Other expenses 261.6 280.7 -6.8% 748.7 729.5 2.6%
Total Expense 450.6 462.8 -2.7% 1,294.2 1,249.2 3.6%
EBITDA 249.6 297.7 -16.2% 990.3 963.2 2.8%
EBITDA Margin % 35.6% 39.1% -350bps 43.3% 43.5% -19bps
Other Income 27.3 25.8 5.8% 95.2 68.7 38.5%
Depreciation 104.8 98.6 6.3% 314.2 296.3 6.0%
Finance Cost 1.7 0.4 - 5.3 4.0 31.7%
PBT 170.4 224.6 -24.1% 766.03 731.56 4.7%
Exceptional item 155.7 - - 155.7 - -
Tax Expense 115.7 79.4 45.8% 289.5 247.3 17.1%
PAT 210.3 145.2 44.9% 632.2 484.3 30.5%
PAT Margin % 30.0% 19.1% 1095bps 27.7% 21.9% 578bps
Note –
Income from services includes income from sale of entry tickets, share of revenue from restaurant sales and income from resort.
Income from sale of products includes income from sale of traded goods, packaged food and other merchandise sold within amusement parks
18COMPANY OVERVIEW – BOARD OF DIRECTORS & MANAGEMENT TEAM
• 19 years in the industry • 14+ years in the industry
ARUN KOCHOUSEPH
KOCHOUSEPH CHITTILAPPILLY • Founded V-Guard Industries Ltd., a publicly • Holds a masters degree in industrial
CHITTILAPPILLY
PROMOTER AND listed company since 2008 and is currently engineering
its Chairman PROMOTER AND
EXECUTIVE VICE CHAIRMAN • Actively involved in day-to-day operations and
• Post Graduate Degree in Physics
NON EXECUTIVE DIRECTOR management of Wonderla since 2003
• 25+ years of work PRIYA SARAH • 14+ years in the Industry
• 38+ years of total work experience
GEORGE JOSEPH experience
GOPAL SRINIVASAN CHEERAN • Involved in F&B
JOINT MANAGING INDEPENDENT • Chairman of TVS Capital JOSEPH Operations and HR
• Director in Muthoot Funds & Independent
DIRECTOR Finance Ltd.
DIRECTOR Director in TVS & Sons
EXECUTIVE department of Wonderla
DIRECTOR since 2005
Limited.
• 43+ years of work experience
• 10+ years of work experience in Retail M RAMACHANDRAN
R LAKSHMINARAYANAN • Served as partner for 20 years with audit firm
• Independent Director in Jyothi Laboratories CHAIRMAN & Deloitte Haskins & Sells LLP
INDEPENDENT DIRECTOR
Limited INDEPENDENT DIRECTOR
• Member of ICAI & ICSI
• 25 years of experience
SIVADAS M. • 27 years of experience SATHEESH SHESHADRI
• Worked in Finance & Accounts at Bangalore
PRESIDENT – • Bachelor’s Degree in CHIEF FINANCIAL International Airport, Dubai Transport Corporation
OPERATIONS Physics OFFICER (CFO)
• Chartered Accountant & SAP ERP certified
MAHESH M.B. • 21 years of experience
AJIKRISHNAN A. G. • 18 years of experience
AVP – • MBA in International
Business VP – PROJECTS • B.E, MBA
COMMERCIAL
19COMPANY OVERVIEW – UNDERSTANDING THE WONDERLA ADVANTAGE
KEY CONCERNS ON SCALABILITY WONDERLA ADVANTAGE
• In-House Design Capability for the Amusement Park
HIGHLY CAPITAL • In-House Ride Manufacturing Facility in Kochi
INTENSIVE BUSINESS • Manufactured / constructed 42 rides / attractions in-house
• Typical Capex for a New Park is ~Rs 2,500 mn – Rs 3,500 mn including Land cost
• Typical Target Audience is the Middle class which can spend Rs 4,000-5,000 per
AFFORDABILITY – trip for a Family
TICKET PRICES ARE HIGH • All three Parks have Land as well as Water rides under the same Ticket
• Average ticket prices in the range of Rs 800 – Rs 1200
• All three Operational Parks have large Land Parcels and have good connectivity
LAND AVAILABILITY, (Within 15-25 km from the city)
LOCATION & • Parks provide a thrilling & unforgettable experience to visitors from
CONNECTIVITY neighbouring states like Tamil Nadu and Andhra Pradesh while also being an
attractive tourist spot for pan India population
20COMPANY OVERVIEW – SUSTAINABLE COMPETITIVE ADVANTAGES
OVER A DECADE OF OPERATIONAL PROXIMITY TO CITY WITH AMPLE LAND
EXPERIENCE AND BRAND EQUITY AVAILABLE FOR FUTURE DEVELOPMENT
• 19+ yrs of successful operations of the parks has built
significant brand equity • Owns 93.17 acres in Kochi, 81.75 acres in Bangalore
• Mr. Kochouseph and Mr. Arun have over 19 yrs and and 49.50 acres in Hyderabad, within which further
14+ yrs of experience respectively in amusement expansion of existing parks can be undertaken
park industry • All the three parks - Kochi, Bangalore and
• Won several awards, including ‘best tourism Hyderabad - are situated in the proximity of the
destination’ and ‘highest number and variety of main city.
innovative rides’
STRONG CUSTOMER INSIGHTS -
IN-HOUSE MANUFACTURING FACILITY
CONSTANTLY INNOVATING NEW
AT WONDERLA KOCHI
ATTRACTIONS
• Benefits from certain cost efficiencies and improves
maintenance efficiency of rides • In-depth understanding of customer preference and
• Enables customisation and modification of rides needs helps while conceptualising new rides
purchased • Won the IAAPI excellence award for the highest
• Manufactured / constructed 42 rides / attractions in- number and variety of innovative rides four times
house
21COMPANY OVERVIEW – FUTURE GROWTH STRATEGY
• Currently in process of Construction of Project in Chennai as well as identifying potential
SCALABILITY – EXPANSION THROUGH SETTING
opportunities for setting up new parks in other key geographies
NEW AMUSEMENT PARKS • Board has recently approved setting up another park in Odisha
• Evaluate customer preferences to innovate attractions based on popular concepts
FOCUS ON IMPROVISING EXISTING PARKS TO
• Develop the undeveloped land at existing parks to increase operational capacity
IMPROVE FOOTFALLS • Efforts to cover tourists through portals developed for tour operators.
ENHANCED VISITOR • Wonderla Resort enables visitors to stay longer at the park & increases spend per head
EXPERIENCE THROUGH PARKS • Enhance visitor experience at other parks by integrating them with resorts
INTEGRATED WITH RESORTS • Introduced stay & paly scheme at Kochi park in association with a leading hotel
• Introduce new rides and attractions based on customer preferences and research done
EXPAND IN-HOUSE RIDE DESIGN
by visiting parks in other parts of the world
AND MANUFACTURING CAPABILITIES • Continue to invest in new manufacturing facilities at upcoming parks
EXPAND REVENUE STREAMS AND • Bolster revenues from entry tickets by offering value-added services
INNOVATING MARKETING INITIATIVES TO • Introduce character and theme based attractions and promote this through marketing
SUPPLEMENT INCOME FROM ENTRY FEES initiatives , ad campaigns using media as well as tour operators
22COMPANY OVERVIEW – GLOBAL RANKING AND RECOGNITION
Wonderla parks in Bangalore, Kochi and Hyderabad
were ranked at #3, #4 and #7 in India by Tripadvisor
Wonderla Bangalore ranked 8th Best and Wonderla
Kochi ranked 16th Best in Asia.
23FOR FURTHER QUERIES -
Mr. Satheesh Seshadri
Mehul Mehta/Nachiket Kale
CFO IR Consultant
Email – Dickenson World
satheesh.seshadri@wonderla.com Contact No : +91 9920940808
Email – wonderla@dickensonworld.com
Disclaimer
This presentation and the following discussion may contain “forward looking statements” by Wonderla Holidays
Limited (“Wonderla” or the Company) that are not historical in nature. These forward looking statements, which
may include statements relating to future results of operations, financial condition, business prospects, plans and
objectives, are based on the current beliefs, assumptions, expectations, estimates, and projections of the
management of Wonderla about the business, industry and markets in which Wonderla operates.
These statements are not guarantees of future performance, and are subject to known and unknown risks,
uncertainties, and other factors, some of which are beyond Wonderla’s control and difficult to predict, that could
cause actual results, performance or achievements to differ materially from those in the forward looking
statements. Such statements are not, and should not be construed, as a representation as to future performance
or achievements of Wonderla.
In particular, such statements should not be regarded as a projection of future performance of Wonderla. It should
be noted that the actual performance or achievements of Wonderla may vary significantly from such statements.
24You can also read