Class Limited 31 December 2018 Half Year Results Presentation - Glenn Day, Acting CEO 14 February 2019 - Open Briefing
←
→
Page content transcription
If your browser does not render page correctly, please read the page content below
Class Limited
    31 December 2018
    Half Year Results Presentation

Glenn Day, Acting CEO
14 February 2019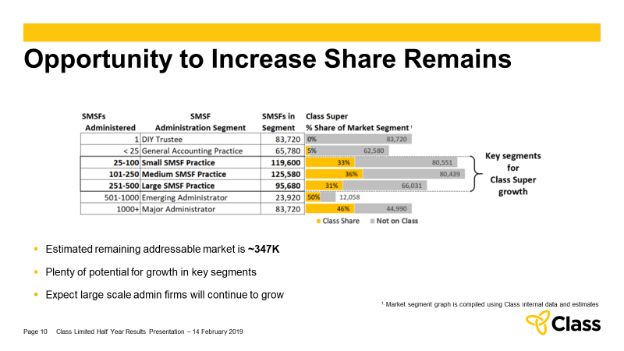
Important information
•   This presentation is provided for information purposes only. The information in this presentation is in a summary form, does not purport to be complete and is not intended to be relied upon
    as advice to investors or other persons. The information contained in this presentation was provided by Class Limited ACN 116 802 058 (Class) as of its date, and remains subject to change
    without notice. This presentation has been provided to you solely for the purpose of giving you background information about Class and should be read in conjunction with Class’ Interim
    Report for the period ended 31 December 2018 and Class’ other market releases on the ASX.
•   No representation or warranty, express or implied, is made as to the accuracy, reliability, completeness or fairness of the information, statements, opinions or matters contained in this
    presentation. Class, its related bodies corporate, shareholders or affiliates, nor any of their respective officers, directors, employees, related bodies corporate, affiliates, agents or advisers
    makes any representations or warranties that this presentation is complete or that it contains all material information about Class or which a prospective investor or purchaser may require in
    evaluating a possible investment in Class or applying for, or a subscription for or acquisition of, shares in Class. To the maximum extent permitted by law, none of those persons accept any
    liability, including, without limitation, any liability arising out of fault or negligence for any loss arising from the use of information contained in this presentation or in relation to the accuracy
    or completeness of the information, statements, opinions or matters, express or implied, contained in, arising out of or derived from, or for omissions from, this presentation.
•   Certain statements in this presentation may constitute forward-looking statements or statements about future matters (including forecast financial information) that are based upon
    information known and assumptions made as of the date of this presentation. These statements are subject to internal and external risks and uncertainties that may have a material effect on
    future business. Actual results may differ materially from any future results or performance expressed, predicted or implied by the statements contained in this presentation. As such, undue
    reliance should not be placed on any forward looking statement. Past performance is not necessarily a guide to future performance. Nothing contained in this presentation nor any
    information made available to you is, or shall be relied upon as, a promise, representation, warranty or guarantee, whether as to the past, present or future by Class or any other person.
•   The provision of this presentation is not a representation to you or any other person that an offer of securities will be made and does not constitute an advertisement of an offer or proposed
    offer of securities.
•   Class has not independently verified any of the contents of this presentation (including, without limitation, any of the information attributed to third parties).
•   This presentation is not, and does not constitute, an offer to sell or the solicitation, invitation or recommendation to purchase any securities in Class and neither this presentation nor any of
    the information contained herein shall form the basis of any contract or commitment. This presentation does not constitute financial product advice to investors or other persons and does
    not take into account the objectives, financial situation or needs of any particular investor. A reader should, before making any decisions in relation to their investment seek their own
    professional advice.
•   This presentation contains non-IFRS measures which are used internally by management to assess the performance of the business and have been extracted or derived from the FY18
    financial report.
•   All currency amounts are in AUD unless otherwise stated.

Page 2      Class Limited Half Year Results Presentation – 14 February 2019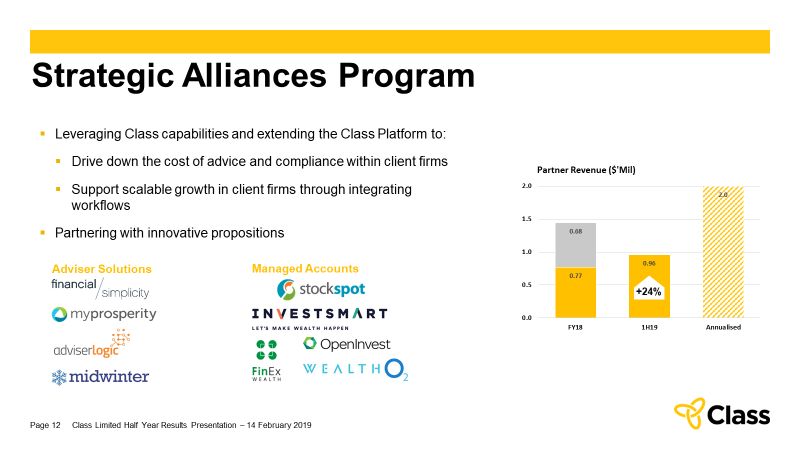
Positioned for Success

                                     Class Portfolio                                  Portfolio Engine
                          New

                                     • Increase penetration of Class Super users      • Leverage Class capabilities through
                                     • Promote Class platform to financial planners     Portfolio Engine

         Markets

                                     Class Super                                      Strategic Alliances
                          Existing

                                     •
                                     •
                                         Continue to increase market share
                                         New features due for release
                                                                                      Program
                                     •   Focus on sales & marketing                   • Integrations with wealth accounting &
                                     •   Strong lifetime value                          financial advice tools
                                                                                      • Partner API & feature development

                                                      Existing                                           New
                                                                             Products
Page 3   Class Limited Half Year Results Presentation – 14 February 2019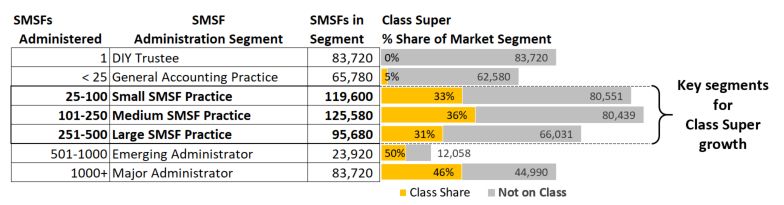
Account Growth
Account Growth (SMSF & Portfolio)
14000 As at 31 December 2018:
4,799 net new accounts 1H19
12000
4,167 from SMSF accounts
10000 632 from Portfolio accounts
8000
AMP continues to migrate off Class,
Accounts
suspending ~2,150 funds in 1H19
6000
Lower account growth due to regulatory
headwinds and increased competition
4000
Significant new features about to be
2000 released to enhance product leadership
and improve customer acquisition
0
September December March June
FY 14 FY 15 FY 16 FY 17 FY 18 FY 19
Page 4 Class Limited Half Year Results Presentation – 14 February 2019Strong Revenue & EBITDA Growth
Operating Revenue ($'Mil) EBITDA ($'Mil)
40.0 20.0
• Interim fully
30.0 15.0
franked dividend
17.0 2.5c declared
8.1
20.0 14.9 10.0 7.6
17.0
19.0
8.6 • NPAT growth at
7.8
10.0 14.0 5.0 6.4 2% due to
+12% +11%
investment in
0.0 0.0
FY17 FY18 1H19 FY17 FY18 1H19 product
NPAT ($'Mil) ARR ($'Mil) *
9.0 40.0
21 st Half Year
4.4
nd Half Year
6.0 4.4 35.0
Growth % is relative to
4.4 prior corresponding period
4.3 37.1
3.0
3.6 36.0 (PCP)
30.0
33.7
+2% 30.9 +10%
28.2
0.0
FY17 FY18 1H19 25.0
FY17 FY18 1H19
* License fees only. Excludes Partner revenue (currently $2m pa)
Page 5 Class Limited Half Year Results Presentation – 14 February 2019Class Super Growth
Class Super Growth
180,000 1800
160,000 1600 As at 31 December 2018:
140,000 1400
167,631 SMSFs
120,000 1200
+4,167 1H19 (6,317 gross of AMP)
Customers
Accounts
100,000 1000
1,459 Class Super customers
80,000 800
$216 ARPU
60,000 600
40,000 400
CAC $177
20,000 200
0 0
Dec Jun 2017 Dec Jun 2018 Dec
Class Super (LHS) Customers (RHS)
1 Estimated SMSF market 598k
Page 6 Class Limited Half Year Results Presentation – 14 February 2019Investing in Product "The automated data feed from Class to XPLAN is fantastic!"
Allisa Pope, Paraplanner, RA Veitch & Co.
Product Investment $4.4m1 in 1H19, +$1.6m
Significant new features due for release: “The new Class Tax Statement Console enhancement is
another game changer!"
- Tax statement automation increased efficiency Paul Murray, CEO, First Class Super
- Adviser Dashboard dedicated adviser tool
- New and enhanced data feeds and corporate actions increased automation
- Enhanced support for Managed Accounts increased automation
- TBAR Reporting increased compliance and efficiency
- Partner API platform enabling more meaningful integrations
Forecast FY19 D&A ~$5.9m
- Development & Fixed Assets ~$5.1m
- AASB 15 ~$0.8m
1. $4.4 total development expenditure of which $3.3m was capitalised
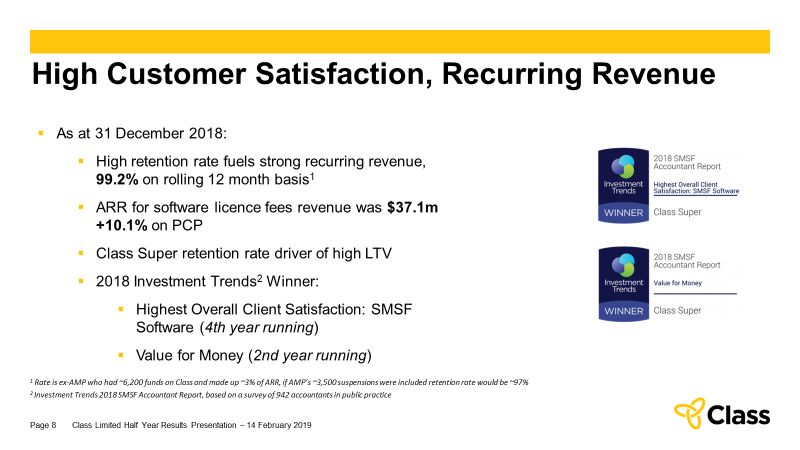
Page 7 Class Limited Half Year Results Presentation – 14 February 2019High Customer Satisfaction, Recurring Revenue
As at 31 December 2018:
High retention rate fuels strong recurring revenue,
99.2% on rolling 12 month basis1
ARR for software licence fees revenue was $37.1m
+10.1% on PCP
Class Super retention rate driver of high LTV
2018 Investment Trends2 Winner:
Highest Overall Client Satisfaction: SMSF
Software (4th year running)
Value for Money (2nd year running)
1 Rate is ex-AMP who had ~6,200 funds on Class and made up ~3% of ARR, if AMP’s ~3,500 suspensions were included retention rate would be ~97%
2 Investment Trends 2018 SMSF Accountant Report, based on a survey of 942 accountants in public practice
Page 8 Class Limited Half Year Results Presentation – 14 February 2019Sales & Organic Growth Increase Market Share
Market share1 28%, +3% on PCP
21% of new accounts are from other cloud products
Class Customers continue to win market share from
peers
33% of growth was organic where established Class
Users grew an average 4.7% in the previous 12
months… over 2 times SMSF industry growth rate1 of
2.3%
What we won 1 Based on an estimated SMSF market at 31 Dec 2018 of 598k
(% of new funds Class signed
in previous 12 months)
Page 9 Class Limited Half Year Results Presentation – 14 February 2019Opportunity to Increase Share Remains
1
Estimated remaining addressable market is ~347K
Plenty of potential for growth in key segments
Expect key segments will benefit from industry consolidation
1. Market segment graph is compiled using Class internal data and estimates
Page 10 Class Limited Half Year Results Presentation – 14 February 2019Class Portfolio Growth
As at 31 December 2018:
Class Portfolio Growth
7,000 700 6,581 accounts +61% on PCP
6,000 600 +632 1H19 accounts, +10.6%
5,000 500
32% of Class Super subscribers now use Class
Customers
Accounts
4,000 400 Portfolio, average 14 accounts per subscriber
3,000 300
$136 ARPU
2,000 200
1,000 100
Product refinements based on planner feedback well
received
0 0
Dec Mar Jun 2018 Sep Dec
Focused on multi-disciplinary firms and integrations
Class Portfolio (LHS) Customers (RHS)
with financial planning solutions
Release of Portfolio Engine
Page 11 Class Limited Half Year Results Presentation – 14 February 2019Strategic Alliances Program
Leveraging Class capabilities and extending the Class Platform to:
Drive down the cost of advice and compliance within client firms
Partner Revenue ($'Mil)
Support scalable growth in client firms through integrating 2.0
2.0
workflows
1.5
Partnering with innovative propositions 0.68
1.0
0.96
Adviser Solutions Managed Accounts 0.77
0.5
+24%
0.0
FY18 1H19 Annualised
Page 12 Class Limited Half Year Results Presentation – 14 February 2019Summary
The future for Class is positive and there are many more opportunities for continued growth.
Strong Revenue & EBITDA Growth
Increasing SMSF market share, now at 28%
Well positioned to take advantage of the shift away from manual processing, the move to the cloud and
industry consolidation
Taking a more active approach towards expanding our reach into the broader wealth management
space
Account growth, along with our strong retention and ARPU, will increase our annualised recurring
revenue and deliver value to shareholders
Page 13 Class Limited Half Year Results Presentation – 14 February 2019Appendix Page 14 Class Limited Half Year Results Presentation – 14 February 2019
Glossary
 •   Accounts: Class Super funds and Class Portfolio entities
 •   Accounts Lost: the maximum number of Accounts the customer had in the 12 months prior to terminating
 •   API: Application programming interface
 •   APR: Annualised Partner Revenue: calculated using known recurring Partner Revenue at reporting date multiplied by number of
     periods required to determine revenue over a 12 month period.
 •   ARPU: Average Revenue Per Unit: licence fee assuming any sales promotions have ended and other factors such as pricing remain
     unchanged
 •   ARR: Annualised Recurring Revenue: number of Accounts at the end of period multiplied by ARPU
 •   CAC: Customer Acquisition Costs: sales, marketing & implementations expenses divided by gross new Accounts added (rolling 12
     month basis)
 •   CAC Months: number of months required to offset cost of acquiring an Account = CAC/(ARPU/12)
 •   EBITDA margin: calculated by dividing EBITDA by operating revenue
 •   Established Customers: practices that have been using Class for over 12 months
 •   NPAT margin: calculated by dividing Net profit after tax by operating revenue
 •   NPBT margin: calculated by dividing Net profit before tax by operating revenue
 •   Retention Rate: (average accounts for the period less accounts Lost) / average accounts for the period
 •   TBAR: Transfer balance account reporting

Page 15   Class Limited Half Year Results Presentation – 14 February 2019
Summary Cash Flow & Balance Sheet
Cash flow before Financing and Taxation ($m) Balance Sheet ($m) 30-Jun-18 31-Dec-18
Current Assets
Cash and cash equivalents 22.7 19.0
Trade and other receivables 3.2 3.7
Other current assets 0.7 2.1
Total Current Assets 26.6 24.8
Property and equipment 0.9 0.9
Intangible assets 6.4 8.0
Customer Acquisition Costs 0.0 2.0
Total Non Current Assets 7.3 10.9
Total Assets 33.9 35.7
Current Liabilities
Trade and other payables 3.0 2.9
Provisions 0.7 0.7
Tax liabilities 1.4 0.4
$m 1H18 1H19 Total Current Liabilities 5.1 4.0
EBITDA 7.8 8.6 Deferred Tax 0.9 2.0
Non-Cash/Net Working Capital (0.2) (0.8) Provisions 0.4 0.4
Capex (2.5) (4.3) Total Non Current Liabilities 1.3 2.4
Net free cash flow 5.1 3.5 Total Liabilities 6.4 6.4
% of EBITDA 65% 41% Net Assets 27.5 29.3
Page 16 Class Limited Half Year Results Presentation – 14 February 2019Summary P&L and Key Operating Metrics
$m 1H18 1H19 31-Dec-17 31-Dec-18
Operating Revenue 17.0 19.0 +12%
No. of subscribers 1,291 1,470
Costs of undertaking business (9.2) (10.4)
Class Super accounts 154,053 167,631
EBITDA 7.8 8.6 +11%
Depreciation (0.2) (0.2) Class Portfolio accounts 4,100 6,581
Amortisation (1.5) (2.5) No. of accounts at end of period 158,153 174,212
Net interest benefit 0.2 0.2
ARR ($m) 33.7 37.1
NPBT 6.3 6.1
APR ($m) 1.4 2.0
Income tax (expense) / benefit (2.0) (1.7)
ARPU - Super ($) 215 216
NPAT1 4.3 4.4 ARPU - Portfolio ($) 139 136
EBITDA margin (% of revenue) 46.0 45.9 CAC ($) 135 177
NPBT margin (% of revenue) 37.0 32.6
NPAT margin (% of revenue) 25.3 23.2
Page 17 Class Limited Half Year Results Presentation – 14 February 2019Investing in Product $m 1H18 1H19 Total Development Costs 2.8 4.4 Development costs / Operating Revenue 16.4% 23.1% Less: Development recognised as expenditure (0.8) (1.1) Capitalised Development Costs 2.0 3.3 Capitalised development / Operating Revenue 11.7% 17.3% Other Intangibles 0.4 0.4 Computer and Office Equipment & Other 0.1 0.2 Capitalised Acquisition Costs (AASB 15) - 0.4 Total Capital Expenditure 2.5 4.3 Less: Leasehold Improvements & Fit-out/Furniture - (0.1) Adjusted Capital Expenditure 2.5 4.2 Capex / Operating Revenue 14.6% 22.2% Capex / EBITDA 31.8% 48.9% Page 18 Class Limited Half Year Results Presentation – 14 February 2019
CLASS INVESTOR PRESENTATION 1H18
                                                        CEO COMMENTARY

Good morning everyone and thanks for joining us for the presentation of our Half Year Results.

My name is Glenn Day and I’m the Acting CEO of Class. I am joined on the call this morning by our Chairman,
Matthew Quinn and our Investor Relations Manager, Ebby Carson.

3. POSITIONED FOR SUCCESS
When Class Super was launched in 2009, it aimed to streamline all
aspects of SMSF administration in a way that had never been done
before, delivering a truly automated solution. As we celebrate Class
Super's 10 year anniversary this month, we can now say that we
have over 167,000 SMSFS on Class and a 28% SMSF market share.

We continue to invest in Class Portfolio and our partner program
and are taking a more active approach to expand our reach and
leverage the core capability and competitive advantage of our
platform into the broader wealth management industry.

We have a talented workforce all looking towards the future with a common goal and the recruitment process for
new leadership is reaching completion. The Board expects to announce a new CEO early next week.

4. ACCOUNT GROWTH
Despite the success of Class since the launch in 2009, there have
been also been some real challenges along the way. The Super
Reforms were more disruptive than we had anticipated, taking time
and investment away from the innovation and new market leading
features we had become so well known for.

There has also been uncertainty created around the Royal
Commission, a Productivity Commission and the federal election
later this year, and what that would all mean for the Self Managed
Super industry going forward.

Although we have continued to grow, over the last 3 quarters our momentum has slowed. This can be attributed to
the increase in competition, the uncertainty we’ve just mentioned and the difficulty in getting in front of the late
majority adopters.

Despite a disappointing first half with lower than expected account numbers being added to the platform, Class has
a very strong underlying business. We have significant market share, our retention rate is 99.2% and our Annualised
Recurring Revenue has grown to $37.1m, up 10% on the previous corresponding period.

We continue to refine our sales and marketing approach for Class Portfolio, focusing on multi-disciplinary firms. We
have now integrated with both the XPLAN and Midwinter financial planning solutions.

We need to continue to apply learnings as the SMSF market matures and changes and we are well positioned to take
advantage of several trends that will drive our growth over the next few years. This growth, along with our strong
retention and ARPU, will increase our annualised recurring revenue and deliver value to shareholders.

We know there is work to do to regain momentum and we are excited to be releasing some great new features this
quarter.

Class Limited Half Year Results Presentation – 14 February 2019
5. STRONG REVENUE & EBITDA Growth As we’ve highlighted, Class remains a profitable business with solid revenue. Our 1H19 revenue was up 12% compared to this time last year, driven by the addition of just over 30,000 funds over the past 18 months. Expenses increased by 13% driven mainly by investments in the Partner program and new incentive plan. CAC increased to $177, primarily due to lower than expected additions during the period. This result flowed through to EBITDA with an 11% increase. Our increased investment in product development made over the last couple of years, and changes from AASB 15, saw a 56% increase in depreciation and amortisation with a 2% increase in net profit after tax to $4.4m, a net profit margin of 23.2%. A fully franked interim dividend of 2.5 cents has been declared and will be paid in March 2019 6. CLASS SUPER GROWTH Net new Class Super accounts have grown by 4,167 for the period. As previously advised, AMP are migrating off Class Super and they reduced our net growth by ~2,150 accounts. Excluding AMP, the 1H19 net account adds were over 6,300. We are operating in a highly competitive environment. Most providers are offering fee holidays and other incentives to win cloud market share and while our ARPU remains steady at $216 there is a lag with the revenue from new customers. We previously scaled-up acquisition staff in expectation of higher growth. The lower actual gross account adds in the year resulted in CAC months increasing to 10. This still compares favourably with many other cloud software providers. 7. INVESTING IN PRODUCT Class is committed to strengthening its product leadership over its competitors. We have increased our investment in innovation and product development which is up +1.6M on the previous corresponding period in support of our strategy to provide solutions to win new customers and enable our existing customers to deliver a superior service and grow their business. Using the right technology is essential for accountants to effectively manage their workflow and their bottom line. We will deliver a number of significant new features in Q3 which aim to increase automation, compliance and enable our customers to provide a better service. Class Limited Half Year Results Presentation – 14 February 2019
8. HIGH CUSTOMER SATISFACTION, RECURRING REVENUE
We are also investing in new support systems to continue
delivering award-winning satisfaction levels and value for
money.

Our high retention rate and annualised recurring revenue and
the ability to deliver at scale drive our high LTV and more than
justify our spend on development and customer acquisition.

9. SALES & ORGANIC GROWTH
Most of our new customer wins now come through a competitive
‘cloud’ selection process. We are seeing a growing number of
established cloud users switching to Class from other cloud software
providers; 21% of our new accounts came from other cloud products in
last 12 months. These are users who have tried a competitor’s cloud
products and typically found that they did not get the value for money
or efficiencies they expected.

In the last 12 months Class users (excluding AMP) won market share from their peers and grew an average of 4.7%,
more than double the industry growth rate of 2.3% accounting for 33% of additions.

We also continue to see the shift from “other” solutions, which is predominately accountants using excel and non-
specialised accounting solutions.

Given the demands of the higher regulations and tighter caps and limits, we expect to see this trend continue as
manual and excel based operators move to the cloud, outsource or exit SMSF admin over the next few years.

10. OPPORTUNITY TO INCREASE SHARE
We estimate our remaining addressable market is ~347,000 funds,
that is, after taking out the Class share and the dedicated 14%
of trustees administering their own funds. The Super Reforms and
better services from accountants have seen a small drop in the
number of these accounts over the years but we do not expect this
to decline in the same way that we expect the excel accounting firms
to do.

Despite Q2 being the second ever highest December quarter for new customer additions, the average number of
accounts per new customer (~40) was lower than usual. We do not believe that this is reflective of the remaining
opportunity.

We are now in the late majority, the prospects that we are selling to are quite different to those we sold to earlier
and we need to continue to adjust our Sales and Marketing approach. As the slide shows, we believe there is plenty
of potential for growth in our key segments which make up 68% of our funds.

We continue to see industry consolidation with 24 Class-to-Class consolidations in the last six months, with ~60%
going to larger administration firms (>251).

Similar to the shift from non-specific or other software providers, we expect large scale admin firms will continue to
grow and service financial planners and accounting firms that do not want to specialise in SMSFs, but we believe the

Class Limited Half Year Results Presentation – 14 February 2019
25-500 fund SMSF practices will continue to consolidate market share, particularly as smaller players exit the market
under the weight of increased regulatory pressure.

11. CLASS PORTFOLIO GROWTH
Class is continuing to promote a broadening of our wealth
management platform outside Super.

32% of Class Super customers are now also using Class Portfolio
with the average number of accounts per customer being 14.

The product refinements we’ve made based on planner feedback
have been well received and we are seeing an increase in uptake.

Class has also released Portfolio Engine, which leverages the core Class Platform to provide back office software
solutions for investment portfolio administration and reporting. Class has recently signed OpenInvest and
InvestSMART as Portfolio Engine partners to drive their managed account offerings.

12. STRATEGIC ALLIANCES PROGRAM
Class is investing in building its Partner program to lay foundations
to lift partner revenue.

We are expanding the partner network and discussions are
underway with providers including practice management, advice
platform and audit.

We are working with Partners to provide clients with additional
benefits across integrated workflows.

We are expanding API support with a dedicated team now focused on API and partner feature development and are
implementing capabilities to allow more sophisticated integrations.

There is a seasonality to Partner revenue which grew by 24% on the PCP and is now $2M on an annualised basis.

13. SUMMARY
The future for Class is positive and there are many more
opportunities for continued growth.

We have strong revenue and EBITDA growth.

We are increasing our market share and are now at 28%.

We are well positioned to take advantage of the shift away from
manual processing, the move to the cloud and industry
consolidation and are taking a more active approach towards expanding our reach into the broader wealth
management space.

Account growth, along with our strong retention and ARPU, will increase our annualised recurring revenue and
deliver value to shareholders.

Class Limited Half Year Results Presentation – 14 February 2019
You can also read