RESULTS PRESENTATION for the year ended 28 February 2019 - www.deltafund.co.za - Delta Property Fund
←
→
Page content transcription
If your browser does not render page correctly, please read the page content below

RESULTS PRESENTATION
                                 for the year ended 28 February 2019

P RO P ERT Y F U N D

           www.deltafund.co.za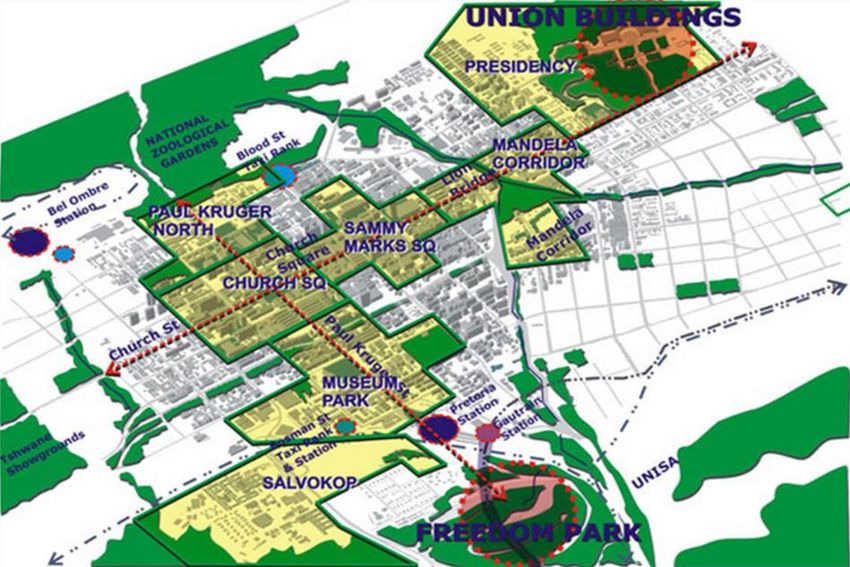
AGENDA                                                P RO P ERT Y F U N D

  01    Introduction and Business Update

       02    Financial Review

            03      Portfolio Review

                 04       Conclusion

                       05       Questions & Answers

                             06        Annexures
P RO P ERT Y F U N D

www.deltafund.co.za

                      INTRODUCTION AND BUSINESS UPDATE
                                                   Sandile Nomvete
INTRODUCTION TO DELTA
Sovereign
Highly Market
underpinned
empowered fund capitalisation of
JSE listed REIT
79.0% Level 2 R1.8bn
B-BBEE
of revenue from sovereign tenants Rating on new sector codes as at 28 February 2019
Average property Assets under
Dominant in
value of management of
Pretoria &
Durban CBDs
R109.1m R11.8bn
(Feb 2018 : R109.6m) By 100% black-owned asset manager
RESULTS PRESENTATION FOR THE YEAR ENDED 28 FEBRUARY 2019
4
BUSINESS UPDATE
Delta experienced its toughest and most challenging year since its listing. Slow pace of lease renewals from DPW,
increased vacancies and higher cost of debt resulted in distributable earnings declining. The board and management
subsequently decided to retain 25% of earnings to facilitate capital expenditure and working capital in the business,
resulting in distribution of 55.39 cents per share being declared.
Leasing Progress
Robust engagement and negotiations held during FY2019
Significant progress in renewals underway in FY2020
New leasing
Vacancies
Tough economic environment with many funds impacted by higher vacancies
Bloemfontein provincial leases continue to impact vacancies with tenants moving to alternate premises
Sunninghill still challenging, however, significant progress seen in the market recently
RESULTS PRESENTATION FOR THE YEAR ENDED 28 FEBRUARY 2019
5
BUSINESS UPDATE cont…
Debt Funding
Low WALE and non-conclusion of DPW renewals significantly impacted our ability to renew expiring facilities for longer
periods
Our long-standing banking partners approved extensions, however, at higher interest costs and associated fees due to
increased risk
Disposals
Our market is limited due to our assets that are configured to sovereign tenants
BEE opportunities to acquire and secure long-term leases prevalent in the market but access to funding seen as barrier
Improvement in economic environment and increased lending by banks post elections should provide traction on
disposals
RESULTS PRESENTATION FOR THE YEAR ENDED 28 FEBRUARY 2019
6
P RO P ERT Y F U N D

www.deltafund.co.za

                      FINANCIAL REVIEW
                                     Shaneel Maharaj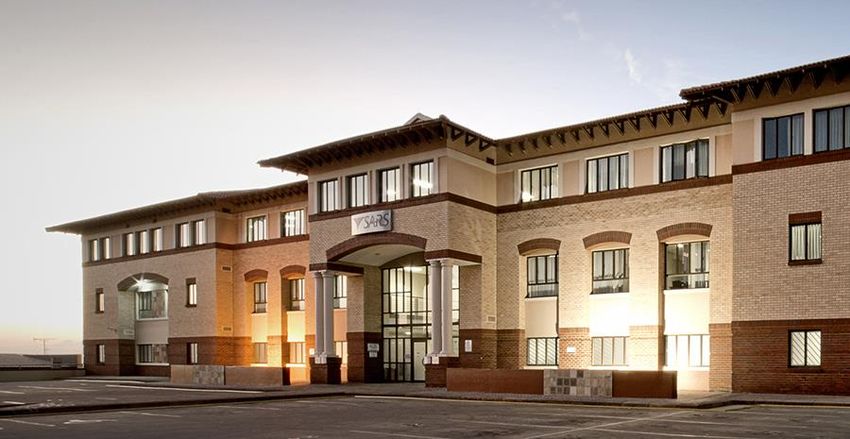
FINANCIAL PERFORMANCE 2019
Loan to
Extended Fixed
value of facilities totalling debt of
45.1% R2.1billion 59.8%
(Feb 2018 : 41.3%) (Feb 2018 : R941 million) (Feb 2018 : 85.4%)
Debtors outstanding Property Interest
at operating margin at cover ratio
31 days 67.8% 2.1
(Feb 2018 : 18.5 days) (Feb 2018 : 73.5%) (Feb 2018 : 2.4)
RESULTS PRESENTATION FOR THE YEAR ENDED 28 FEBRUARY 2019
8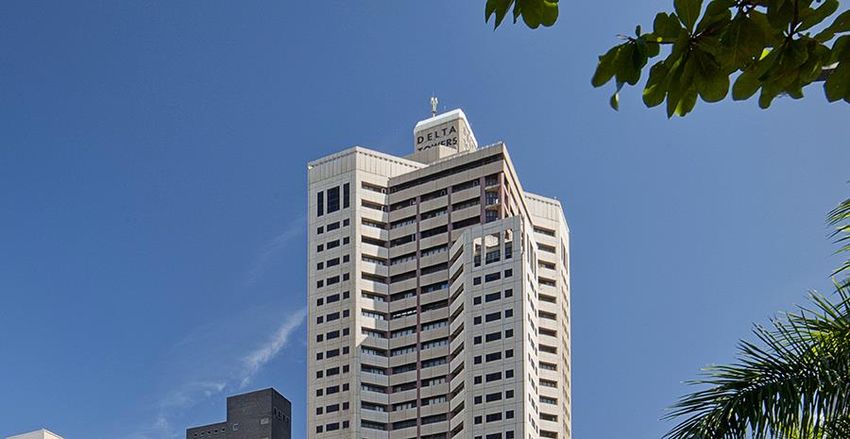
FIVE YEAR REVIEW

                                                              2019         2018         2017         2016        2015
Revenue (R’000)                                             1 547 365    1 564 053    1 617 344    1 247 582   1 009 207
Net property income (R’000)                                 1 037 786    1 149 885    1 153 341     925 531     764 884
Finance costs (R’000)                                        537 281      482 179      470 580      412 713     316 380
Cost to income ratio - gross method                            32.2%        26.5%        28.8%        26.4%       26.0%
Cost to income ratio - net method                              18.3%        12.1%        12.4%        12.2%       10.2%
Investment property (R’000)                                11 350 331   11 507 600   11 381 421   10 095 181   8 420 400
Investment in listed securities (R’000)                      461 822      381 868      429 588      472 546     502 986
Borrowings (R’000)                                          5 258 471    4 952 690    5 099 227    5 094 310   4 508 565
Loan to value (LTV)                                            45.1%        41.3%        41.5%        47.2%       49.9%
Weighted average interest rate                                 10.2%         9.2%         9.2%         8.8%        8.1%
Average debt expiry period (years)                                0.8          1.5          1.9          2.3         2.4
Average debt fix expiry period (years)                            2.1          1.5          2.2          2.1         2.4
Fixed: floating debt (excluding revolvers)                     59.8%        85.4%        85.1%        83.5%       78.0%
Net asset value per share (exclusive of deferred tax)          R9.30       R10.06        R9.91       R10.61      R10.02

RESULTS PRESENTATION FOR THE YEAR ENDED 28 FEBRUARY 2019
                                                                                                                           9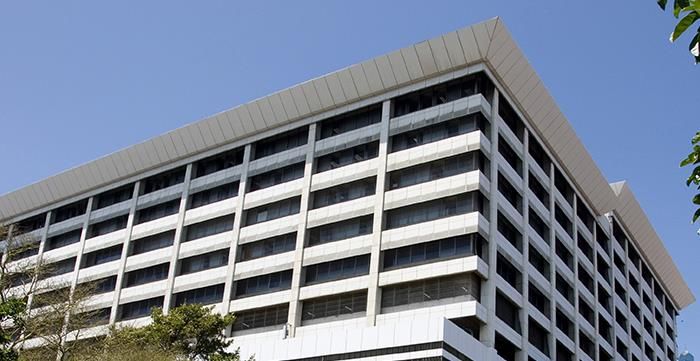
DISTRIBUTABLE INCOME STATEMENT

                                                           Feb 2019       Feb 2018
Net property income (excl. straight line accrual)            1 072 090      1 147 865
Administration expenses                                       (79 727)       (53 329)
Net finance costs                                            (511 249)      (462 483)
Dividend income - GRIT                                         39 187         35 666
Other income                                                     6 356        20 287
Antecedent interest                                               569            257
Prior year retained earnings distributed                              -         3 378
Distributable income for the period                           527 226        691 641
Number of shares in issue                                  714 229 718    711 844 486
Full year distributable earnings per share (cents)              73.84          97.24
Distribution per share declared for the year (cents)            55.39          97.24

RESULTS PRESENTATION FOR THE YEAR ENDED 28 FEBRUARY 2019
                                                                                        10
ANALYSIS OF DISTRIBUTIONS DECLARED
HISTORIC DISTRIBUTION PER SHARE (CENTS/SHARE)
H1 – Interim 23.1% 9.6% 15.6% 7.2% 8.7% 8.0% 7.1% 7.1% 7.1% 1.0% (1.0)% 0% (15.1)% (68.5)% (43,0)%
H2 – Final
Total – Full year
97,24 97,24
90,8
84,1
72,7
55,39
51,3 50,8
47,9 45,9 46,4
44,1 42,9
40,2 40,0 39,4
32,5
23,7
16,0
FY2013 H1 Aug- H2 Feb- FY2014 H1 Aug- H2 Feb- FY2015 H1 Aug- H2 Feb- FY2016 H1 Aug- H2 Feb- FY2017 H1 Aug- H2 Feb- FY2018 H1 Aug- H2 Feb- FY2019
13 14 14 15 15 16 16 17 17 18 18 19
RESULTS PRESENTATION FOR THE YEAR ENDED 28 FEBRUARY 2019
11DISTRIBUTABLE EARNINGS BRIDGE
R’000
5 196 3 521 312 (3 378) (13 931)
691 641 6 466 (19 953)
(36 642)
(48 767)
(57 240)
527 224
H2 Feb 2018 Net property Admin Dividend Antecedent Prior year Other income Vacancies Disposals Net finance Provisions H2 Feb 2019
income expenses income (Grit) dividend retained costs raised
earnings
distributed
RESULTS PRESENTATION FOR THE YEAR ENDED 28 FEBRUARY 2019
12LIKE-FOR-LIKE NET PROPERTY INCOME ANALYSIS
Amount
Description %
(R’000)
Net property income (NPI) Feb 2018 1 147 865
Increased NPI from base portfolio held at 28 Feb 2018 (36 353) (3.2)%
NPI attributable to disposals and non-core assets FY18 (39 422) (3.4)%
NPI Feb 2019 (excl. straight line accrual) 1 072 090 (6.6)%
Increased NPI from base portfolio held at 28 Feb 2018 (36 353)
NPI attributable to Disposals and non-core assets FY19 690
Like-for-like increase in NPI Feb 2019 (35 663) (3.1)%
RESULTS PRESENTATION FOR THE YEAR ENDED 28 FEBRUARY 2019
13STATEMENT OF FINANCIAL POSITION
R’000 Feb 2019 Feb 2018 Change %
ASSETS
Non-Current assets 10 377 347 10 919 425 (4.96%)
Investment property 9 913 811 10 535 000 (5,96%)
Fair value of property portfolio 9 755 209 10 342 418 (5.68%)
Straight line rental income accrual 158 602 192 582 (17.64%)
Investment in other assets 461 822 381 868 20.94%
Other non-current assets 1 714 2 557 (32.97%)
Current assets 453 205 543 256 (16.58%)
Non-current assets held-for-sale 1 436 520 972 600 47.70%)
Total assets 12 267 072 12 435 281 (1.35%)
EQUITY AND LIABILITIES
Total equity 6 641 445 7 158 592 (7.22%)
Liabilities 5 625 627 5 276 689 6.61%
Non-current liabilities 1 470 696 2 720 230 (45.93%)
Current liabilities 4 154 931 2 556 459 62.53%
Total equity and liabilities 12 267 072 12 435 281 (1.35%)
RESULTS PRESENTATION FOR THE YEAR ENDED 28 FEBRUARY 2019
14NAV BRIDGE
Rands
0.11 0.02
0.62
10,06
-0.93
-0.32
9.30
-0.20 -0.02
-0.02 -0.01 -0.01
28 Feb 2018 Contribution Fair value of Dividend Dividend paid Fair value of Deferred Fair value of Debt facilities Disposals FCTR recognised 28 Feb 2019
from operations listed reinvestment investment consideration financial raised in profit and loss
investments property settled instruments &
forex losses
RESULTS PRESENTATION FOR THE YEAR ENDED 28 FEBRUARY 2019
15DEBT SUMMARY
As at 28 February 2019
Facility Type R’ m Weighted Ave. Rate
Floating bank facilities 4 339 11.0%
Fixed bank facilities 212 9.5%
Revolving bank facilities 706 9.7%
Total borrowings, net of accrued interest 5 257 10.2%
Accrued interest 17
Debt Structuring fees (16)
TOTAL 5 258
Total fixed bank facilities 212 9.5%
Interest rate swap contracts 2 020 7.9%
Cross currency swaps 139 Libor + 2.9%
Total fixed 2 371
Fixed % (excluding revolvers) 59.8% 10.2%
RESULTS PRESENTATION FOR THE YEAR ENDED 28 FEBRUARY 2019
16DEBT COMMENTARY
Extended R2.1billion in expiring debt facilities during the year
59.8% (2018: 85.4%) of borrowings are fixed for an average period of 0.8 years (2018: 1.5) using a
combination of interest rate swaps, cross currency swaps and fixed facilities. The deterioration in fix % was
due to fixed facilities being converted into floating facilities when extended
The weighted average cost of debt increased to 10.2% (2018: 9.2%) primarily due to higher interest rates
on facilities extended
Loan to value ratio increased to 45.1% (2018: 41.3%),impacted by the negative fair value adjustment on
investment properties of R227 million coupled with increased borrowings. We expect an improvement in
the LTV once leases are concluded and the portfolio is revalued
Interest cover ratio at 2.1 (2018: 2.4), impacted by higher interest costs and vacancies
RESULTS PRESENTATION FOR THE YEAR ENDED 28 FEBRUARY 2019
17P RO P ERT Y F U N D
www.deltafund.co.za
PORTFOLIO REVIEW
Otis TshabalalaOPERATIONAL PERFORMANCE 2019
Total lease
A distinct focus on
Capital
renewals in a
sovereign tenants expenditure
challenging environment
73.6% R115 million 151 018m 2
Gross lettable area (GLA) (Feb 2018 : R185.4 million (Feb 2019 : 46 833m2)
Bulk lease renewal
Vacancies Total new leases
proposal to DPW
of concluded
(PMTE)
10.8% 12 537m 2 227 550m2
14.4% including assets held for sale
Retail and office other Renewed 88 185m2 (37 leases) post Feb 19
(SAPOA average 11.0%)
RESULTS PRESENTATION FOR THE YEAR ENDED 28 FEBRUARY 2019
19REPRESENTATION BY PROVINCE AND MAJOR TENANTS
BUILDINGS REPRESENTED BY PROVINCE REPRESENTATIVE TENANTS
No of Buildings GLA (m2)
Gauteng 35 402 382
KwaZulu-Natal 17 278 264
Free State 17 85 980
Mpumalanga 11 30 251
Limpopo 7 44 885
Northern Cape 7 37 275
Western Cape 5 41 889
Eastern Cape 3 23 717
North West 2 5 780
Total 104 950 422 Limpopo
Mpumalanga
Gauteng
North West
Free KwaZulu
State Natal
Northern
Cape
Eastern
Cape
Western
Cape
RESULTS PRESENTATION FOR THE YEAR ENDED 28 FEBRUARY 2019
20PORTFOLIO BREAKDOWN
Office -
Office - Other Industrial Retail Total
Sovereign 1
Number of properties 81 16 4 3 104
Gross lettable area (m2) by building type 4 693 737 192 711 40 258 23716 950 422
Vacancy (%) 10.9% 24.3% 33.1% 5.7% 14.4%
Value R8.8bn R2.1bn R0.2bn R0.3bn R11.4bn
Average rental (R/m2) 2 128.43 87.6 60.3 127.5 119.5
Weighted ave. escalation (%) 2 6.5% 6.5% 7.4% 7.3% 6.6%
Weighted ave. lease expiry
2.1 years 1.8 years 0.7 years 5.2 years 2.1 years
(by revenue) - by building type 3
Weighted ave. lease expiry
2.1 years 1.7 years 0.7 years 2.8 years 2.1 years
(by revenue) - tenant specific 2
Cost to income ratio (net) 12.7% 25.1% 7.1% 30.8% 18.3%
Cost to income ratio (gross) 24.4% 42.1% 29.7% 39.9% 32.2%
1 Multi tenant buildings are classified according to majority tenant type. Office – Other buildings therefore contain a minority element of sovereign tenants
2 This classification looks specifically at the tenant type within each building
3 Renewals in effect. Sovereign rentals & portfolio weighted average leaves expiry at year end were respectively R128.2 and 1.2 years
4 The GLA is classified by the majority of the tenants in the buildings and includes vacancy. Sovereign tenanted GLA is 598 661 m2 with total tenanted GLA of 813 436 m 2
RESULTS PRESENTATION FOR THE YEAR ENDED 28 FEBRUARY 2019
21DETAILED TENANT BREAKDOWN
TENANT PROFILE BY GLA TENANT PROFILE BY RENTAL
1,7%
7,4%1,7%
3,3%
7,4%
6,9%
Office - Sovereign National Government 11,9%
11,9%
38,6%
16,2% 38,7% Office - Other Provincial
Government 7,2%
Retail Local Government
6,8%
11,9%
73,6% Industrial State-Owned 79,0%
12,4%
Enterprise
21,3%
15,7%
2
Excludes vacancies. Total occupied GLA = 813 426m
RESULTS PRESENTATION FOR THE YEAR ENDED 28 FEBRUARY 2019
22UPDATE ON DPW
New cabinet trimmed from 36 to 28 ministers
• is in line with first world countries
• 6 departments have been merged
DPW has been expanded to include Infrastructure & Development and is now known as
the Department of Public Works & Infrastructure Development
Minister De Lille appointed as Minister of Public Works & Infrastructure Development
• widely known as a woman of action and integrity and is generally held in high esteem
RESULTS PRESENTATION FOR THE YEAR ENDED 28 FEBRUARY 2019
23UPDATE ON DPW cont…
Impact on Delta
We believe there will be minimal impact on space requirement from the
departments that have been merged
• The staff component at operational level is expected to largely remain the same
given that
• Government is on a drive to create employment, which has culminated in the Department of
Labour being renamed Department of Labour & Employment
• Organised labour is vocal and active on job creation & job losses
We believe with Minister De Lille at the helm, there will be an impetus to
transacting with DPW
RESULTS PRESENTATION FOR THE YEAR ENDED 28 FEBRUARY 2019
24DPW LEASING UPDATE
Since the interim period, DPW has implemented Supply Chain Management (SCM)
Circular 48 which governs the terms with which DPW transacts with landlords:
The bulk lease renewal process is currently in its final stages
Delta currently qualifies for a maximum of 5 years with DPW
Delta has managed to secure a mixed bag of 3 to 5 year terms on the leases signed
There are ongoing discussions regarding the maximum tenures for REITS
RESULTS PRESENTATION FOR THE YEAR ENDED 28 FEBRUARY 2019
25DPW LEASING UPDATE cont…
At present the final tenure is largely driven by the the user departments’ requirements
Where the user department requires a short-term lease, for reasons such as the
individual space requirements not meeting their needs, DPW is compelled to comply
with the user’s request
Where the user department requests a longer lease term than 5 years, DPW has
proposed an additional 4 year 11 month term as an option to meet the user’s request.
• We have, however, advised DPW that we do not consider this as a 9 years & 11 month lease and
view it as a 5 year lease
Where the user department has not reverted back to DPW with its requirements
• DPW is confirming 3 year tenures with a 3 month notice period at prevailing rentals as stipulated in
Circular 48
• We continue to negotiate around these lease clauses
RESULTS PRESENTATION FOR THE YEAR ENDED 28 FEBRUARY 2019
26UPDATE ON SOVEREIGN TENANTS
Bulk renewal progress
• Stage 1 (DPW) and Stage 2 (user department) are 100% complete
• Stage 3 status: 37 leases totalling 88 185m² have been signed to date
• The remaining 139 365 m2 anticipated to be signed between June & July
Number
Status GLA
of Leases
Lease agreements concluded and signed 37 88 185 m²
Under negotiation 22 139 365m²
TOTAL 59 227 550 m²
RESULTS PRESENTATION FOR THE YEAR ENDED 28 FEBRUARY 2019
27LEASING UPDATE
Major leases concluded
151 018m2 were renewed of which 46 833m2 to the value of R113 million were renewed as at Feb 2019
The most notable renewals are:
Building Tenant GLA
In 2 Fruit Building In 2 Food 11 177 m²
Unisa House UNISA 9 068 m²
101 De Korte MMI 6 610 m²
5 Simba Road ESKOM 5 253 m²
Auditor General Auditor General of SA 2 130 m²
Domus National Heritage Council SA 1 127 m²
Du Toitspan Dept. of Correctional Services 1 090 m²
Total 36 455 m²
RESULTS PRESENTATION FOR THE YEAR ENDED 28 FEBRUARY 2019 28
28LEASING UPDATE cont….
Several new leases were concluded measuring 12 537m2 to the value of R71.6 million
The most notable new deals are:
Building Tenant GLA
Liberty Towers Mr Price 3 833 m²
5 Walnut Merchants SA 1 524 m²
TOTAL 5 357 m²
Tenant Retention
Tenant retention remains a significant focus for Delta
RESULTS PRESENTATION FOR THE YEAR ENDED 28 FEBRUARY 2019 29
29GEOGRAPHICAL AND GRADE SPLIT
GLA - BY BUILDING RENTAL - BY BUILDING
Gauteng (42.3%) Gauteng (44.7%)
KwaZulu-Natal (29.3%) KwaZulu-Natal (24.4%)
Free State (9.1%) Limpopo (9.3%)
Limpopo (4.7%) Free State (6.3%)
Western Cape (4.4%) Western Cape (5.5%)
Northern Cape (3.9%) Northern Cape (3.7%)
Mpumalanga (3.2%) Eastern Cape (3.1%)
Eastern Cape (2.5%) Mpumalanga (2.8%)
North West (0.6%) North West (0.5%)
OFFICE GRADE - BY GLA OFFICE GRADE - BY RENTAL
A (15.5%) A (21.4%)
B (84.2%) B (78.5%)
C (0.3%) C (0.1%)
RESULTS PRESENTATION FOR THE YEAR ENDED 28 FEBRUARY 2019
30VALUATIONS
The portfolio including non-current assets held for sale decreased by 1.96% to R10.4 billion
Value Feb 2019 Value Feb 2019
Number of Properties Growth/(Loss) Percentage
Pre Valuation Post Valuation
104 properties R11 577 330 103 R11 350 330 000 (R227 000 103) (1.96%)
94 properties* R10 608 346 640 R10 397 230 000 (R211 116 640) (1.99%)
*Post transfer of 10 Bloemfontein properties to non-current assets held for sale
Marginal decrease in value, in the context of an incredibly difficult trading year not only for Delta but for most listed
REITs in general
Reversions in light of recent renewals with DPW
Average cap rates of between 10% to 12% and the average portfolio value of R11 942 per m 2
Valuers factored prevailing market conditions, rentals and tenures into their valuations
We intend to revalue the portfolio once all bulk renewals are completed
RESULTS PRESENTATION FOR THE YEAR ENDED 28 FEBRUARY 2019
31DISPOSAL OF NON-CURRENT ASSETS
During the 2019 financial year, Delta sold one building, 12 New Street, for a total of R15.8 million. Subsequently Top Trailers site 1
transferred post year end, for R45 million
Property Building Classification Location GLA (m2) Sales price (R) Transfer Date
12 New Street Office - Sovereign Johannesburg CBD 2 368 15 750 000 27-Nov-18
Transferred FY2019 2 368 15 750 000
As at Feb 2019, Delta had approximately R1.4 billion on the disposal list at book value, of which 4 assets were concluded for
R311.8 million
Property Building Classification Location GLA (m2) Sales price (R) Expected transfer Date
Top Trailers site 1 Industrial Wadeville, Johannesburg 15 741 45 000 000 9-May-19
Broadcast House Office - Sovereign Mthatha, Eastern Cape 4 934 33 000 000 End June 2019
Protea Coin Cape Town Office - Other Saxenberg Park, Cape Town 5 700 10 000 000 End July 2019
Block G Office - Sovereign Pretoria CBD 7 991 230 000 000 End August 2019
Sale agreements concluded 34 366 318 000 000
6 other non-current assets held for sale 53 396 635 100 000
10 other non-current assets transferred
Office - Sovereign Bloemfontein Portfolio 59 427 483 420 000
from Investment Property
TOTAL NON-CURRENT ASSETS HELD FOR SALE 147 189 1 436 520 000
An additional 10 buildings from the Bloemfontein portfolio to the value of R483.4m were added onto the disposal list
• Negotiations on these buildings are well advanced
RESULTS PRESENTATION FOR THE YEAR ENDED 28 FEBRUARY 2019
32CAPEX | EXISTING PORTFOLIO
Budget Tenant FY 2020 FY 2021 FY 2022 Total Capex
Installation
FY2020
Bulk Renewals 70 000 000 98 300 000 117 500 000 68 800 000 354 600 000
Balance of properties 95 000 000 113 000 000 77 900 000 284 900 000
Total Portfolio 70 000 000 193 300 000 230 500 000 146 700 000 639 500 000
Commission Poyntons Fire
Property Embassy Building Beacon Hill 17 Harrison Street
House Project
Approved budget 16 000 000 28 000 000 40 000 000 32 500 000 4 500 000
Remaining budget Completed Completed 26 065 031 5 666 507 Completed
Description Tenant installation to Façade Upgrade, Internal Creating fire lobbies, Tenant installation
all floors for new Lifts and Tenant refurbishment of sprinklers, hydrant and replacement of
tenant secured Installation. Complex tenant space system and smoke escalators
project. Weather Turnkey contractor detection
dependant appointed compliance
RESULTS PRESENTATION FOR THE YEAR ENDED 28 FEBRUARY 2019
33SUSTAINABILITY & GREENING INITIATIVES
Delta Property Fund is investigating the implementation of a Solar PV solution
This would reduce Delta’s carbon footprint
There is renewed focus on environmentally conscious landlords by tenants and investors
Benefits to Delta would include
Generation of carbon credits due to reduced footprint
Generating non GLA rental which will in turn result in increased valuation of the property
Long-term leases which may positively impact the WALE
Opportunity to better manage unforseen percentage increases in the cost of power which
will affect property net income
A pilot project for the installation of the Solar PV systems is being considered on 3 properties
RESULTS PRESENTATION FOR THE YEAR ENDED 28 FEBRUARY 2019
34P RO P ERT Y F U N D
www.deltafund.co.za
CONCLUSION
Sandile NomveteCONCLUSION
The conclusion of South Africa’s sixth democratic election is expected to provide much needed political
stability and improved business confidence within the economy. This transition is expected to materialise
within twelve months, whereby we envisage positive capital inflow and further stability to interest rates
FY 2020 is going to be one of Delta’s most exciting and busiest years:
• Concluding bulk lease renewal
• Formulating, planning and executing capex linked to TI and general building condition
• Refinancing of expiring debt and managing forward looking debt expiry
• Driving significant effort into disposals to reduce debt and generate cash for capex and working capital
• Filling vacancies across the portfolio
Delta’s board and management remain committed to its sovereign strategy
RESULTS PRESENTATION FOR THE YEAR ENDED 28 FEBRUARY 2019
36P RO P ERT Y F U N D
www.deltafund.co.za
THANK YOU
Questions & AnswersANNEXURES P RO P ERT Y F U N D
01 Government Precinct Pretoria
02 Top 10 properties by value
03 Lease Expiry Profile
04 Sectorial Split
05 GLA and vacancy reconciliation
06 Leasing Outlook
07 Growth / ReversionGOVERNMENT PRECINCT | PRETORIA
RESULTS PRESENTATION FOR THE YEAR ENDED 28 FEBRUARY 2019
39TOP 10 PROPERTIES
Forum Building Poyntons Liberty Towers Hallmark Building Delta Towers
Location Pretoria Location Pretoria Location Durban Location Pretoria Location Durban
Office - Office - Office -
Sector* Sector* Sector* Office - Other Sector* Sector* Office - Other
Sovereign Sovereign Sovereign
GLA 41 003 m2 GLA 73 396 m2 GLA 40 080 m2 GLA 26 255 m2 GLA 41 677 m2
Valuation R673 mil Valuation R576 mil Valuation R426 mil Valuation R410 mil Valuation R405 mil
* Building sector determined by majority occupation of a tenant type. Some buildings have different types in occupation
RESULTS PRESENTATION FOR THE YEAR ENDED 28 FEBRUARY 2019
40TOP 10 PROPERTIES | CONTINUED
Isivuno House Embassy Building Hensa Towers The Marine NPA Building
Location Pretoria Location Durban Location Polokwane Location Durban Location Cape Town
Office - Office - Office - Office -
Sector* Sector* Sector* Sector* Office - Other Sector*
Sovereign Sovereign Sovereign Sovereign
GLA 23 694 m2 GLA 32 829 m2 GLA 13 675 m2 GLA 24 655 m2 GLA 10 552 m2
Valuation R373 mil Valuation R338 mil Valuation R303 mil Valuation R260 mil Valuation R249 mil
* Building sector determined by majority occupation of a tenant type. Some buildings have different tenant types in occupation
RESULTS PRESENTATION FOR THE YEAR ENDED 28 FEBRUARY 2019
41LEASE EXPIRY PROFILE AT 28 FEBRUARY 2019
TOTAL PORTFOLIO - BY GLA TOTAL PORTFOLIO - BY RENTAL
Vacant (14.4%) Month to Month (38.6%)
2,8%
3,0%
14,4% 6,3% 2,5%
2,4% Month to Month (34.0%) 2,1% 29 Feb 20 (17.8%)
8,3%
29 Feb 20 (15.7%) 9,8%
38,6% 28 Feb 21 (22.9%)
28 Feb 21 (19.4%)
19,4% 28 Feb 22 (9.8%)
29 Feb 22 (8.3%)
34,0% 22,9% 28 Feb 23 (2.1%)
28 Feb 23 (2.4%)
29 Feb 24 (6.3%)
15,7% 29 Feb 24 (3.0%)
17,8%
Beyond 28 Feb 2024 (2.8%) Beyond 29 Feb 2024 (2.5%)
RESULTS PRESENTATION FOR THE YEAR ENDED 28 FEBRUARY 2019
42SECTORAL SPLIT
GLA - BY BUILDING GLA - BY TENANT*
2,5% 4,2% 6,9% 3,3%
Office - Sovereign (73.0%) Office - Sovereign (73.6%)
Office - Other (20.3%) 16,2% Office - Other (16.2%)
20,3%
Retail (2.5%) Retail (6.9%)
73,0% Industrial (4.2%) Industrial (3.3%)
73,6%
RENTAL - BY BUILDING RENTAL - BY TENANT
2,1% 1,7% 1,7%
7,4%
14,9%
Office - Sovereign (81.3%) Office - Sovereign (79.0%)
11,9%
Office - Other (14.9%) Office - Other(11.9%)
Retail (2.1%) Retail (7.4%)
Industrial (1.7%) Industrial (1.7%)
81,3% 79,0%
*
Excludes vacancies. Analysis focuses on what category the specific tenant falls into, rather than the category of the building
RESULTS PRESENTATION FOR THE YEAR ENDED 28 FEBRUARY 2019
43GLA AND VACANCY RECONCILIATION
Properties (No.) Total GLA (m2) Vacant GLA (m2) Vacancy (%)
As at 28 February 2018 105 952 428 112 225 11.8%
Disposals 1 (2 368) -
Leases terminated - - 36 789
New letting of vacant space - - (12 537)
Adjustments - 361 508
As at 28 February 2019 104 950 422 136 986 14.4%
RESULTS PRESENTATION FOR THE YEAR ENDED 28 FEBRUARY 2019
44LEASING | OUTLOOK
Anticipated budgeted sovereign renewals
W.A. Expiry W.A. Proposed Escalation /
Sector No of Leases Total Area
Rate / m2 * Rate / m2 * (Reversion)
Leases on month-to-month or expiring by 31 August 2019
National government 49 198 559 109.87 100.74 (8.31%)
Provincial government 12 53 767 169.38 124.23 (26.65%)
Local government 4 38 650 144.76 103.31 (28.64%)
State-owned enterprise 15 36 752 110.96 107.62 (3.01%)
TOTAL 80 327 728 123.87 105.67 (14.69%)
*
All rentals quoted are gross rentals
RESULTS PRESENTATION FOR THE YEAR ENDED 28 FEBRUARY 2019
45GROWTH / REVERSION
Total leases concluded 1 March 2018 – 28 February 2019
W.A Term W.A. Expiry W.A. Achieved Growth / W.A. Esc.
No of Leases Total Area (m2)
(months) Rate (R / m2) * Rate (R / m2) * (Reversion) achieved
Renewed leases 50 46 833 19.12 112.22 107.93 (3.82%) 7.04%
Renewals by Sector
W.A. Term W.A. Expiry W.A. Achieved Escalation / W.A. Esc.
Sector No of Leases Total Area
(months) Rate / m2 * Rate / m2 * (Reversion) Achieved
National Government 1 1 090 36.00 100.26 112.36 12.07% 6.00%
State-owned enterprise 3 7 603 23.72 148.25 115.82 (21.87%) 6.32%
Industrial 4 11 177 6.00 77.17 83.34 8.00 0.00%
Office – other 21 23 593 20.05 105.90 103.84 (1.95%) 6.76%
Retail 21 3 370 40.48 191.42 196.78 2.80% 7.91%
Total 50 46 833 19.12 112.22 107.93 (3.82%) 7.04%
*All rentals quoted are gross rentals
RESULTS PRESENTATION FOR THE YEAR ENDED 28 FEBRUARY 2019
46NOTES
RESULTS PRESENTATION FOR THE YEAR ENDED 28 FEBRUARY 2019
47NOTES
RESULTS PRESENTATION FOR THE YEAR ENDED 28 FEBRUARY 2019
48You can also read