PLACES PEOPLE LOVE Countryside Properties PLC - Full Year Results 2020
←
→
Page content transcription
If your browser does not render page correctly, please read the page content below
PLACES
        PEOPLE
         LOVE
Countryside Properties PLC
   Full Year Results 2020

Abbotsfield, St Helens, Merseyside
GROUP PERFORMANCE

  • Significant impact from COVID-19
       – Housing market closure impacted results
       – Production returned to normal levels
       – Focus on employees, partners and customers
       – Established communities fund to support vulnerable people
           through pandemic
  • Strong visibility of future earnings
       – Strong, secured order book up 23% to £1,432m
       – Growing Partnerships bid pipeline of 102,734 plots
       – Key framework agreements signed in the year
       – Trading at upper end of 2021 consensus expectations
  • Equity issue to fund our growth strategy
       – Strong balance sheet
       – New regions taking shape already
       – Second modular panel factory under construction
2 FULL YEAR RESULTS DECEMBER 2020
STRATEGY TO DELIVER
  ENHANCED GROWTH AND VALUE
                                    • Accelerated, sector-leading growth
                                        – Resilience from mixed tenure delivery
                                        – Superior returns through the cycle
                                        – Redefined purpose and values
                                    • Improving our focus on Sustainability
                                         – Experienced team appointed
                                         – Launch of new Sustainability approach in 2021
                                    • We will manage our growth in a controlled way
                                        – Strengthened oversight of key disciplines
                                        – Continue to recruit and develop the best people
                                        – Focus on delivering for all our stakeholders
                                    • Focused on maximising long-term value for shareholders

3 FULL YEAR RESULTS DECEMBER 2020
ENHANCED PARTNERSHIPS GROWTH STRATEGY
ON TRACK
10,000 homes p.a. from Partnerships, driven by three new regions Partnerships Revenue £m
in South and Midlands £629m
Management teams in place in South West and South London FY2015-2019
CAGR
Office locations identified 34%
837
Underpinned by new framework opportunities 635 629
Delivery period
477 of enhanced
We will deliver our second modular panel factory in 2021 285
350 growth plan
FY15 FY16 FY17 FY18 FY19 FY20 FY23 FY24
We will accelerate eight Partnerships South developments from
the pipeline
Discussions with partners ongoing
Partnerships EBIT £m
Detailed re-programming of all eight schemes underway £33m
Confident accelerated planning consents will be achieved 128
111
Delivers £130m to £150m of cumulative, incremental profit
across FY22 to FY24 79
Delivery period
57 33 of enhanced
40 growth plan
FY15 FY16 FY17 FY18 FY19 FY20 FY23 FY24
4 FULL YEAR RESULTS DECEMBER 2020
ADVISORS APPOINTED TO FACILITATE SEPARATION

  • Divisions have operated together since                                       NEW 2023 TARGETS
    IPO, benefitting from:
      – Shared stakeholders
      – Strong balance sheet                      Partnerships                                     Housebuilding
      – Shared land bank                          •   Long term structural growth                  • South East footprint
                                                  •   Lower risk mixed tenure model                • High quality ‘controlled’ strategic
  • Differentiated business models now:                                                              land bank
                                                  •   Lower capital, driving high returns
      – Operate largely independently             •   Clear visibility and resilience of           • Larger development sites, driving margin
      – Have differing capital structures             order book                                   • Standardised product type, improving
                                                                                                     returns
  • Appointed advisors to facilitate separation                          2020               2023                        2020             2023
                                                  Completions       3,213              c.8,000     Completions           840        c.1,500
                                                  Operating Margin 5.2%                   15%      Operating Margin     7.0%           18%
                                                  Return on Capital 13.0%                >40%      Return on Capital    4.9%          >25%

5 FULL YEAR RESULTS DECEMBER 2020
Financials
Mike Scott, Group CFO

                        Hilbourne, Arbourfield Green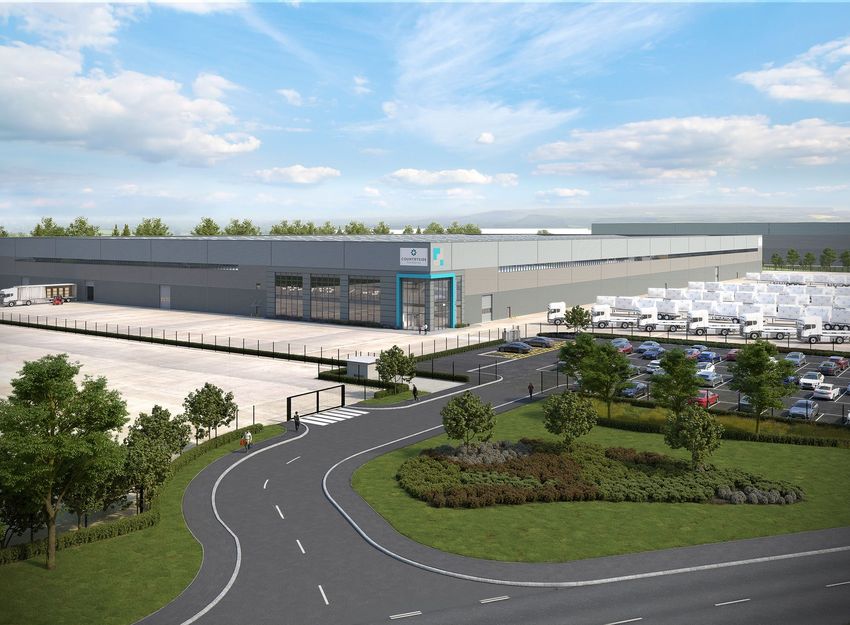
Group                  Partnerships               Housebuilding

  GROUP FINANCIAL HIGHLIGHTS

  • Short-term COVID-19 impact from reduced completions                                               Units                   Operating profit £m
    and land sales                                                                                    4,053                   £54.2m
  • No final dividend declared                                                                                5,733                   234.4
                                                                                                                              211.4
  • Strong forward sales position of £1.4bn                                                           4,295
                                                                                                                      4,053
       – Partnerships: £949m (5,179 homes)
                                                                                                                                              54.2
       – Housebuilding: £483m (1,660 homes)
                                                                                                      FY18    FY19    FY20    FY18    FY19    FY20
  • We are managing our growth in a controlled way
  • Mixed tenure provides resilience and lowers risk against                                          Operating margin %      ROCE %
    uncertain backdrop                                                                                5.5%                    7.1%
  • Margin recovers towards target levels by 2023                                                      17.2
                                                                                                                               37.4
                                                                                                                                      37.8
                                                                                                              16.5

                                                                                                                      [X]
                                                                                                                                              [X]
                                                                                                                       5.5                    7.1

  Note: Group financials are shown on an adjusted basis to include the proportional contribution of   FY18    FY19    FY20    FY18    FY19    FY20
  the joint ventures and associate and exclude non-underlying items

7 FULL YEAR RESULTS DECEMBER 2020
Group                   Partnerships          Housebuilding

  STRONG PRIVATE SALES PERFORMANCE
  DESPITE LOCKDOWN
                                                              FY 2020      FY 2019          Net Reservation Rate over time
                                                                                     1.60
  Units                                                          4,053       5,733
                                                                                                       FY20
  Active sites1                                                    124        137    1.20
                                                                                                                             FY19
  Average open sales outlets                                         63        56
                                                                                     0.80
  Cancellation rate                 2
                                                                 23.4%       17.1%
                                                                                     0.40
  Net reservation rate2                                            0.78       0.84
  Private ASP3                                                   £390k      £380k    0.00
                                                                                             October                         September
  • 20% Help to Buy of total completions 2
  • 1% use of part-exchange

  1   As at 30 September 2020
  2   Based on total for the period excluding bulk sales
  3   Based on reservations in the year

8 FULL YEAR RESULTS DECEMBER 2020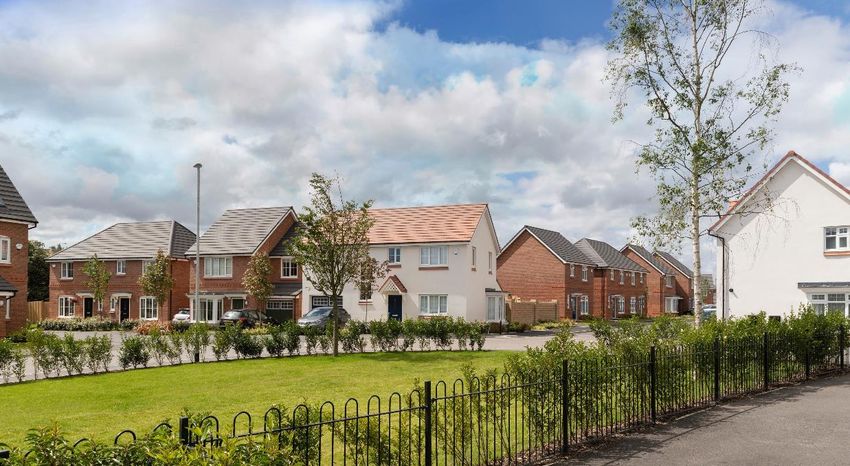
Group                  Partnerships               Housebuilding

  SUMMARY OF GROUP INCOME

                                                         Adjusted measures £m                         FY 2020    FY 2019     change
                                                         Revenue                                        988.8    1,422.8        -31%
                                                         Operating profit                                54.2      234.4        -77%
                                                         Operating margin                                5.5%      16.5%    -1,100bps
                                                         Net interest                                   (13.5)     (10.9)      +24%
                                                         Profit before tax                               40.7      223.5        -82%
                                                         Tax                                             (7.0)     (41.3)       -83%
                                                         Non controlling interest                         0.3       (0.7)     +143%
                                                         Profit after tax                                34.0      181.5        -81%

                                                         EPS (pence per share)                           7.4p      40.8p        -82%
                                                         DPS (pence per share)                              -      16.3p       -100%

  Note: Group financials are shown on an adjusted basis to include the proportional contribution of
  the joint ventures and associate and exclude non-underlying items

9 FULL YEAR RESULTS DECEMBER 2020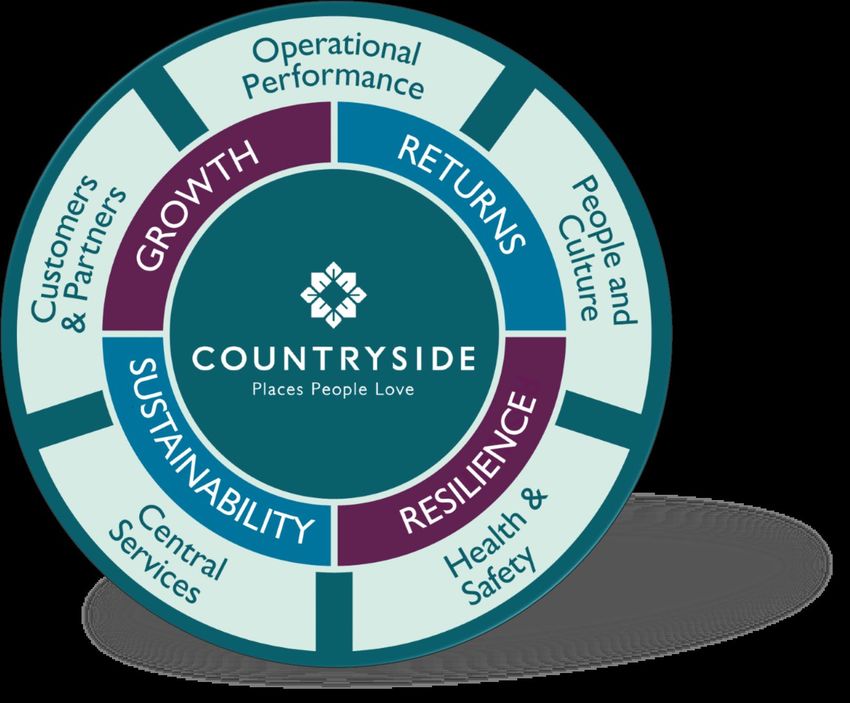
Group                    Partnerships                Housebuilding

   SUMMARY BALANCE SHEET

                                                      £m                                                 FY 2020     FY 2019    change
                                                      Intangibles                                          143.1       170.9      -16%
                                                      Investment in JVs and associate1                     111.3       115.0      -3%
                                                      Stock and WIP                                       1,059.1      808.6     +31%
                                                      Land debtors                                           13.5       15.7      -14%
                                                      Land creditors                                       (192.8)    (158.3)    +22%
                                                      Overage                                               (31.3)     (33.9)     -8%
                                                      Other                                                (115.1)     (92.3)    +25%
                                                      Net cash / (debt)                                      98.2       73.4     +34%
                                                      Net assets                                          1,086.0      899.1     +21%
                                                                   2
                                                      TNAV                                                 951.7       737.8     +29%

   1   Includes loans to joint ventures
   2   Tangible net asset value is calculated as net assets less intangible assets net of deferred tax

10 FULL YEAR RESULTS DECEMBER 2020
Group Partnerships Housebuilding
NET CASH £98.2M AT 30 SEPTEMBER 2020
• Further working capital investment into Partnerships
• Significant impact from COVID-19 with £225m of 37 £m
98
inventory at 30 September due to delayed £m Cash from
operating
construction programme (Housebuilding: £150m, 73 profit1
(124)
Partnerships: £75m)
• Equity placing in Q4 to strengthen balance sheet and FY19 Partnerships 243
FY20
fund Partnerships growth closing working (46)
closing
capital increase2
• Gearing of (9.0)% Housebuilding
working (34)
• Adjusted gearing4 of 8.7% capital increase2
Tax and
net interest (51)
Dividends3 Net proceeds from
equity placing
1 Represents Group statutory EBITDA excluding share based payments and profit / loss on disposal of property, plant and equipment
2 Net impact of changes in working capital and dividends received, changes in loans to joint ventures and associate
3 Includes dividends paid to non-controlling interests
4 Adjusted gearing includes land creditors within net debt
11 FULL YEAR RESULTS DECEMBER 2020Group Partnerships Housebuilding
PARTNERSHIPS FINANCIALS
FY 2020 FY 2019 change
939 £302k
Total completions 3,213 4,425 -27%
Private completions Private ASP
Revenue £629.4m £837.1m -25%
FY 2019: 1,336 FY 2019: £283k
Operating profit £32.8m £127.8m -74%
1,390 £145k Operating margin 5.2% 15.3% -1,010bps
Affordable completions Affordable ASP 1
TNAV £288.1m £114.2m +152%
FY 2019: 1,760 FY 2019: £144k
ROCE 13.0% 78.3% -6,530bps
884 £139k 1 Excludes intra Group cash funding
PRS completions PRS ASP
FY 2019: 1,329 FY 2019: £132k
Note: Group financials are shown on an adjusted basis to include the proportional contribution of
the joint ventures and associate and exclude non-underlying items
12 FULL YEAR RESULTS DECEMBER 2020Group Partnerships Housebuilding
PARTNERSHIPS OPERATING MARGIN
COVID -19 impact (6.0)%
15.3% (2.6)%
COVID
compliance
(3.4)%
Operational
gearing (2.5)%
Prior year (1.8)% 0.2%
non-recurring
benefits Impact of Mix and 5.2%
legacy Westleigh other
sites
FY19 FY20
13 FULL YEAR RESULTS DECEMBER 2020Group Partnerships Housebuilding
HOUSEBUILDING FINANCIALS
FY 2020 FY 2019 change
515 £477k
Private completions Private ASP Total completions 840 1,308 -36%
Revenue £359.4m £585.7m -39%
FY 2019: 841 FY 2019: £500k
Operating profit £25.0m £114.8m -78%
301 £180k Operating margin 7.0% 19.6% -1,260bps
Affordable completions Affordable ASP 1
TNAV £663.6m £623.6m +6%
FY 2019: 419 FY 2019: £191k
ROCE 4.9% 25.1% -2,020bps
24 £301k 1 Excludes intra Group cash funding
PRS completions PRS ASP
FY 2019: 48 FY 2019: £321k
Note: Group financials are shown on an adjusted basis to include the proportional contribution of
the joint ventures and associate and exclude non-underlying items
14 FULL YEAR RESULTS DECEMBER 2020Group Partnerships Housebuilding
HOUSEBUILDING OPERATING MARGIN
COVID -19 impact (7.0)%
(2.5)%
19.6%
COVID (4.5)%
compliance
Operational (2.9)%
gearing (0.5)%
Prior year
Lower-margin (2.2)%
non-recurring
land sales
benefits HPI impact 7.0%
FY19 FY20
15 FULL YEAR RESULTS DECEMBER 2020Group Partnerships Housebuilding
LAND & COMMERCIAL SALES
• Remain a normal part of managing our land bank Profit from Land & Commercial sales
• Help manage balance sheet / geographical exposure £15-£20m range
£14m
• Target £15m to £20m per annum £12m
£11m
• Land sales delayed at H1 FY20 now complete or £8m
terms agreed for FY21
£6m
£6m £6m £6m
£5m
£2m
FY17 FY18 FY19 FY20 FY21F
Land Commercial
16 FULL YEAR RESULTS DECEMBER 2020Guidance
Group        Partnerships    Housebuilding

   SHORT-TERM FOCUS ON AFFORDABLE AND PRS

                                                                PRS                                 PRS
   • Agile business model allows us to manage tenure mix        19%                                21%
                                                                                     Private                       Private
   • Lockdown decisions made to move towards                                         33%                           33%
     non-private tenures                                                FY21                                FY22
   • Tenure mix for FY21 expected to include one third
     private homes                                         Affordable                          Affordable
        – Net reservation rate to be lower in H1 FY21           48%                                 46%
        – Significant visibility through forward sales
                                                                               PRS
   • Re-evaluating tenure mix for FY22                                         21%
                                                                                                      Private
   • Medium term increase to 40% private drives margin                                                40%
                                                                                        FY23

                                                                          Affordable
                                                                               39%

18 FULL YEAR RESULTS DECEMBER 2020
Group Partnerships Housebuilding
STRONG BALANCE SHEET SUPPORTS GROWTH
Forecast land payment profile £m
50
• £98m of available cash at 30 September FY21 FY22 FY23 FY
40 23
– £300m facility undrawn +
30
– CCFF eligible, also undrawn
20
• £250m raised in H2, of which £100m used to strengthen
the Group balance sheet 10
• Housebuilding cash generation helps fund Partnerships 0 Q1 Q2 Q3 Q4 H1 H2 H1 H2
growth Land payments to private vendor Land payments to local authority/
registered provider
Overage payments to private vendors
Overage payments to local authority/
• No dividend declared for FY20 registered providers
– Return to paying dividend in 2021 Divisional cash profile £m
Net 450
– Level of cover to be balanced against market cash /(debt) Housebuilding
growth opportunities 300
150
0 Group
(150) Partnerships
(300)
Sept 20 Sept 21 Sept 22 Sept 23
19 FULL YEAR RESULTS DECEMBER 2020Group Partnerships Housebuilding
2021 FINANCIAL GUIDANCE
Partnerships Housebuilding Group
Volume (homes) c.5,000 c.1,000 c.6,000
Private ASP c.£325k c.£480k c.£360k
Operating margin1 10-11% 12-14% c.10%
Net interest c.£15m
Adjusted tax rate c.19.0%
Closing net debt £0m-£(50)m
Land creditors £300m - £350m
1 Group operating margin is presented after the deduction of central costs
20 FULL YEAR RESULTS DECEMBER 2020Operational highlights Iain McPherson Group Chief Executive
Group        Partnerships    Housebuilding

   WELL POSITIONED FOR RECOVERY IN 2021

   • Delivery de-risked through affordable and PRS
       – Two thirds forward sold for 2021
   • Construction programmes on track for delivery
       – Some planning risks remain
       – Sites operating at normal levels
   • Low exposure to build cost inflation
       – c.70% of 2021 construction spend procured
       – Inflation currently less than 1%
       – Impact of no-deal Brexit estimated at
Group Partnerships Housebuilding
CONTINUED INVESTMENT IN MODULAR PANEL
• 709 homes delivered from Warrington factory in 2020
• Second factory under construction in Bardon,
Leicestershire
– Production expected to commence in summer 2021
• Total capacity of up to 5,000 modular panel homes
per year from 2022
• Increases speed of build, improves return on capital
• Further opportunities in other parts of the Group
• New manufacturing division in 2021
Modular Factory, Bardon (CGI image)
23 FULL YEAR RESULTS DECEMBER 2020Group Partnerships Housebuilding
STRONG VISIBILITY THROUGH THE ORDER BOOK
AND LAND BANK Forward order book £m
• Strong forward order book of £949m with 5,179 units 120 FY21 FY22 FY23 FY24 FY
– Private: £266m (+109%), ASP £314k 100 24+
– Affordable: £559m (+19%), ASP £194k 80
– PRS: £124m (-44%), ASP £141k 60
40
• c.65% of FY21 revenue secured
20
• Significant land bank with 42,442 plots, up 22% on FY19 0 Q1 Q2 Q3 Q4 Q1 Q2 Q3 Q4 H1 H2 H1 H2
– Represents >9 years supply at 2019 volumes Affordable PRS Private reservations
– 11,374 plots won during the year including c.5,000 in Land Bank (inc. Pref Bidder) Land Bank (inc. Pref Bidder)
our expanding Midlands regions By Region By Tenure
– Continue to be highly selective of opportunities
• Broader bid pipeline includes further c.102,000 plots Plots Plots
42,442 42,442
1 1
at 30 Sept 20 at 30 Sept 20
39% North 51% Private
21% Midlands 35% Affordable
40% South 14% PRS
1 Land bank, including preferred bidder
24 FULL YEAR RESULTS DECEMBER 2020Group Partnerships Housebuilding
CASE STUDY–GROWTH OF WEST MIDLANDS REGION
Demonstrates ability to execute organic expansion
• West Midlands region grown organically since 2017 Unit delivery
1,000
• Mixed tenure delivery accelerates growth 800 Private
Affordable / PRS
• Margin takes time to target as private homes reach around 35% 600
400
• Region at 800 units and c£20m EBIT
200
0
FY FY FY FY Maturity
2017 2018 2019 2020
(pre-COVID Plan)
EBIT delivery
25
Margin
20 grows to
£20m
15% £17m
15
£13m
10
5
£5m
£1m
0
FY FY FY FY Maturity
2017 2018 2019 2020
(pre-COVID Plan)
25 FULL YEAR RESULTS DECEMBER 2020Group Partnerships Housebuilding
HOUSEBUILDING ON TRACK TO RETURN TO SCALE
• Strategy focused on efficiency, margin and ROCE improvement Operating margin performance
7.0%
• Rebalancing delivery to include Western Home Counties
19.6% 18%
18.4%
• Strategic land underpins future gross margin improvement 15.9% 16.6%
• Operational efficiencies and cost savings
– Increased standardisation 7.0%
– Potential for increased timber frame utilisation FY16 FY17 FY18 FY19 FY20 FY23
• Sales recovered strongly in the South East, supported in part by
Government policy Medium term targets (FY23)
• Land sales of £15m to £20m per year VOLUME
c.1,500 homes
OPERATING
ROCE
MARGIN
18% >25%
26 FULL YEAR RESULTS DECEMBER 2020Group Partnerships Housebuilding
STRATEGIC LAND BANK
• Strategic land bank underpins margin improvement and cash generation Land bank by ownership status
• Over 19 years of supply at 2019 volumes Controlled 8%
1,878 plots
• Owned and controlled: 7,917 plots Option 68%
17,125 plots
• Under option: 17,125 plots Owned 24% 25,042
– GDV of £4,192m, embedded gross margin of £993m 6,039 plots plots
• Balance of strategic and short-term land provides visibility and flexibility
– 67% of next 3 years planned completions are owned/controlled
– 73% of next 3 years planned completions have planning 24,303 25,042
• Land bank length and quality reduces cash investment required to grow 19,778 14,153 15,741 Without
Planning
and improve margins 10,337
9,441 10,150 9,301 With
Planning
FY FY FY
2018 2019 2020
27 FULL YEAR RESULTS DECEMBER 2020Group Partnerships Housebuilding
INCREASED FOCUS ON SUSTAINABILITY
• Our purpose is to create places where people love to live, Sustainability is embedded
with sustainable communities built to last throughout our organisation
– We invest in developing resilient mixed-tenure communities The Board of Directors
– We have a role in creating a more sustainable built
environment Executive Committee
– We deliver high quality homes through experienced and
passionate people Risk Health, Safety Social Value and
Divisional
Management Environment and Sustainability
Boards
• Sustainability strategy focused on social and environmental impact Committee Quality Committee Committee
• Recognised with over 381 awards for our sustainability and
design practices Sustainability credentials validated by third parties
• Investment made in 2020 to strengthen our sustainability and
operating capabilities as we accelerate growth
28 FULL YEAR RESULTS DECEMBER 2020Closing remarks
Group        Partnerships    Housebuilding

   CURRENT TRADING AND OUTLOOK

   9-week trading                       FY 2021      FY 2020
   Open sales outlets                       59         61
   Visitors per outlet per week             4.3        5.2
   Net reservation rate                    0.50       0.85
   Private ASP                            £402k       £401k

   • Strong forward order book
   • Positive HPI to date
   • Limited build cost increase exposure
   • Trading at upper end of 2021 consensus operating profit expectations

30 FULL YEAR RESULTS DECEMBER 2020
Group        Partnerships    Housebuilding

   CLEAR STRATEGY TO DELIVER ENHANCED GROWTH

                                                     Our priorities are clear:
 Our strategy has evolved                            • Operate as a sustainable business
 to bring more focus to
                                                     • Execute delivery of our growth strategy
 how we work as well as
 highlighting our                                    • Deliver sector leading volume growth and high returns
 Sustainability credentials                            in Partnerships
                                                     • Optimise Housebuilding operating performance
                                                     • Continue to unlock value from strategic landbank
                                                     • Reorganise Group to facilitate separation

31 FULL YEAR RESULTS DECEMBER 2020
Q&A
Appendix
Group             Partnerships             Housebuilding

   CONTINUED FOCUS ON MAINTAINING QUALITY

   Total completions                                                Health & Safety                            Build quality                 Customer satisfaction
   4,053                                                            224 (Accident Injury Incident Rate)1       0.22 (NHBC RIs per home)2     90.6% (NHBC RAF)3
                          5,733                                                                                        0.22           0.22
                                                                      220                    227         224    0.21           0.21                          92.5%
                                                                                                                                                                     90.6%
                                                                                                                                             88.6%
                4,295                 4,053                                       162                                                                84.6%
   3,389

       FY17     FY18       FY19       FY20                            FY17        FY18       FY19       FY20   FY17    FY18    FY19   FY20   FY17    FY18    FY19    FY20

   1 The number of reportable incidents per 100,000 people at risk
   2 Defects reported per plot at NHBC inspections at key build stages
   3 The percentage of customers returning an NHBC post-completion survey who would recommend us to a friend

34 FULL YEAR RESULTS DECEMBER 2020
Group Partnerships Housebuilding
RECONCILIATION OF REPORTED TO
ADJUSTED MEASURES
£m FY 2020 FY 2019
Revenue 892.0 1,237.1
Add: share of revenue from associate and joint ventures 96.8 185.7
Adjusted revenue 988.8 1,422.8
Operating (loss)/profit (5.4) 170.4
Add: non-underlying items 42.4 17.2
Add: share of operating profit from
associate and joint ventures 17.2 46.8
Adjusted operating profit 54.2 234.4
Adjusted operating profit margin 5.5% 16.5%
35 FULL YEAR RESULTS DECEMBER 2020Group Partnerships Housebuilding
NON-UNDERLYING ITEMS
£m Total
Impairment of goodwill (18.5)
Restructuring costs (3.5)
Ground rent assistance scheme (10.0)
Amortisation of acquisition related intangibles (10.2)
Deferred consideration relating to Westleigh (0.2)
FY 2020 (42.4)
36 FULL YEAR RESULTS DECEMBER 2020Group Partnerships Housebuilding
JOINT VENTURES AND ASSOCIATE
Our share of results
£m Partnerships Housebuilding Group
Revenue 44.1 52.7 96.8
Expenses (35.8) (43.8) (79.6)
Operating profit 8.3 8.9 17.2
Finance income/(costs) (0.3) 0.3 -
Income tax expense - (0.2) (0.2)
Profit for the period 8.0 9.0 17.0
37 FULL YEAR RESULTS DECEMBER 2020Group Partnerships Housebuilding
ADJUSTED NET FINANCE COSTS BREAKDOWN
£m FY 2020 FY 2019 change
Cash items
Interest on bank debt 5.4 3.4 +59%
Interest receivable (0.2) (0.6) (67)%
5.2 2.8 +86%
Non-cash items
Net unwind of discount 6.5 7.5 (13)%
Amortisation of debt finance fees 0.7 0.6 +17%
Unwind of lease liabilities 1.1 - +100%
8.3 8.1 +2%
Associate and JV interest - - -
Adjusted net finance costs 13.5 10.9 +24%
38 FULL YEAR RESULTS DECEMBER 2020Group Partnerships Housebuilding
IFRS 16 “LEASES”
• IFRS 16 “Leases” adopted for first time in FY20 £m FY 2020
• Recognition of all leases on balance sheet Right of use assets 26.3
Lease liabilities (30.5)
– Main leases relate to offices, factories and company cars
Other working capital 2.7
• Small impact on TNAV at 30 September 2020 Impact on TNAV (1.5)
• Lease expense replaced with depreciation and interest £m FY 2020
• Lease liabilities are not included in Group net debt Reduced operating lease expenditure 7.6
Increased depreciation (7.8)
Impact on operating profit (0.2)
Increased finance costs (1.1)
Impact on profit before tax¹ (1.3)
1 PBT includes (-£0.7m) impact of non-underlying costs, primarily driven by restructuring costs relating to the Millgate and London offices
39 FULL YEAR RESULTS DECEMBER 2020Group Partnerships Housebuilding
HOUSE PRICE INFLATION
• ASP of £364k driven by negative HPI in Housebuilding, offset by Underlying house price inflation by price band
geographic mix and moderate inflation in Partnerships (2019: £367k)
(0.5%)
• Continued focus on first-time buyers 1,454
• 91% of homes under £600k
(0.6%)
• +1.3% HPI in Partnerships
• -2.5% HPI in Housebuilding 5.3%
(4.4%)
(6.4%)Group Partnerships Housebuilding
GROWTH DRIVES MARGIN AND ROCE IMPROVEMENT
• Investments from placing are delivering by 2023 Partnerships 2020 2023
• Partnerships Completions 3,213 c.8,000
– Significant growth through new regions Operating Margin 5.2% 15%
– Change in tenure mix improves operating margin Return on Capital 13.0% >40%
– ROCE recovers as investments reach maturity
• Housebuilding Housebuilding 2020 2023
– Back to operating scale of c.1,500 homes
Completions 840 c.1,500
– Operating margin and ROCE back to target levels
Operating Margin 7.0% 18%
• Group Return on Capital 4.9% >25%
– Delivery up 66% on 2019 levels
– Significant improvement in operating margin and ROCE GROUP 2020 2023
– Cash generation from 2022 onwards
Completions 4,053 c.9,500
Operating Margin 5.5% 15-16%
Return on Capital 7.1% >30%
41 FULL YEAR RESULTS DECEMBER 2020DISCLAIMER
Cautionary statement regarding forward-looking statements
Some of the information in this document may contain projections or other forward-looking statements regarding
future events or the future financial performance of Countryside Properties PLC and its subsidiaries (the Group).
You can identify forward-looking statements by terms such as “expect”, “believe”, “anticipate”, “estimate”, “intend”,
“will”, “could”, “may” or “might”, the negative of such terms or other similar expressions. Countryside Properties
PLC (the Company) wishes to caution you that these statements are only predictions and that actual events or
results may differ materially and as such undue reliance should not be placed on these statements. The Company
does not intend to update these statements to reflect events and circumstances occurring after the date hereof or
to reflect the occurrence of unanticipated events. Many factors could cause the actual results to differ materially
from those contained in projections or forward-looking statements of the Group, including among others, general
economic conditions, the competitive environment as well as many other risks specifically related to the Group and
its operations. Past performance of the Group cannot be relied on as a guide to future performance.
42 FULL YEAR RESULTS DECEMBER 2020You can also read