BTIG INVESTOR PRESENTATION - SEPTEMBER 23, 2021
←
→
Page content transcription
If your browser does not render page correctly, please read the page content below
BTIG INVESTOR PRESENTATION – SEPTEMBER 23, 2021

C O N F I D E N T I AL : M a y o n l y b e u s e d w i t h c o n s e n t . / © 2 0 2 1 D r i v e S h a c k I n c .

PAGE 2

          Cautionary Note on Forward-Looking Statements
This disclaimer applies to this document and the verbal or written comments of any person presenting it. This document, taken together with any such
                                        verbal or written comments, is referred to herein as the “Presentation.”

This presentation contains forward-looking statements, within the meaning of the Private Securities Litigation Reform Act of 1995, which are subject to known and
unknown risks, uncertainties and other important factors that may cause actual results to be materially different.
All statements other than statements of historical fact included in this presentation are forward-looking statements, including, but not limited to, timing of new
venue openings, expected financial outlook for fiscal 2021, expected operating performance, time of construction start dates and milestones, expected sales and
trends in Drive Shack Inc.’s (the "Company's") operations including statements relating to the effects of COVID-19 and the Company’s mitigationefforts and our
ability to achieve our growth plans and goals.
Forward-looking statements discuss the Company's current expectations and projections relating to its financial position, results of operations, plans, objectives,
future performance and business. You can identify forward-looking statements by the fact that they do not relate strictly to historical or current facts. These
statements may include words such as "aim," "anticipate," "believe," "estimate," "expect," "forecast," "outlook," "potential," "project," "projection," "plan," "intend,"
"seek," "may," "could," "would," "will," "should," "can," "can have," "likely," the negatives thereof and other similar expressions.
Without limiting the generality of the foregoing, targeted returns and growth, including with respect to the number and timing of new venue openings, are forward-
looking statements, represent management’s view and are estimated based on current and projected future operating performance of our locations, comparable
companies in our industry and a variety of other assumptions, many of which are beyond our control, that could prove incorrect. As a result, actual results may vary
materially with changes in our liquidity or ability to obtain financing, changes in market conditions and additional factors described in our reports filed with the
Securities and Exchange Commission (“SEC”), which we encourage you to review. We undertake no obligation to update these estimates.
For a discussion of some of the risks and important factors that could cause actual results to differ materially from such forward-looking statements, see the sections
entitled “Risk Factors” and “Management’s Discussion and Analysis of Financial Condition and Results of Operations” in the Company’s periodic reports filed with
the SEC, which are available on the Company’s website (www.http://ir.driveshack.com). Forward-looking statements speak only as of August 9, 2021. We expressly
disclaim any obligation to release publicly any updates or revisions to any forward-looking statements contained herein to reflect any change in expectations with
regard thereto or change in events, conditions or circumstances on which any statement is based.
This Presentation includes forward-looking financial measures that are not recognized under generally accepted accounting principles (“GAAP”), including
Adjusted EBITDA and SG&A excluding certain compensation expenses. This non-GAAP financial information does not speak to historical financial results and is an
estimate of what could occur in the future and is not an alternative to financial information prepared in accordance with GAAP, which is included in the
Company’s filings with the SEC. The Company has not reconciled its Adjusted EBITDA expectations set forth in this presentation, as items that impact such
expectations are out of the Company’s control and/or cannot be reasonably predicted. Accordingly, a reconciliation is not available without unreasonable effort.

                                                                                                       C O N F I D E N T I AL : M a y o n l y b e u s e d w i t h c o n s e n t . / © 2 0 2 1 D r i v e S h a c k I n c .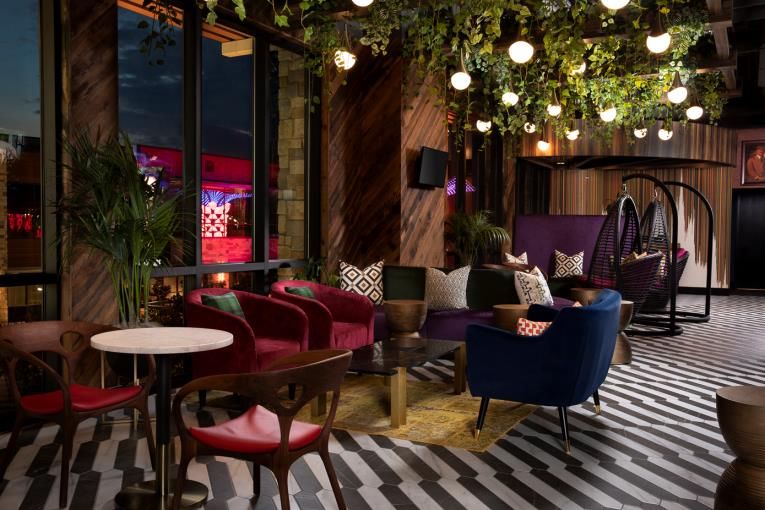
1. Executive Summary
2. Our Business
3. Historical Financials
PAGE 4

About Drive Shack Inc.                 Our Mission
Drive Shack Inc. is a leading owner    To become the largest venue-
and operator of golf-related leisure   based competitive socializing
and entertainment businesses focused   and entertainment platform in
on bringing people together through
                                       the country.
competitive socializing. Today, our
portfolio consists of American Golf,
Drive Shack and Puttery.

                                         C O N F I D E N T I AL : M a y o n l y b e u s e d w i t h c o n s e n t . / © 2 0 2 1 D r i v e S h a c k I n c .
PAGE 5
                                                                               Executive Summary
  We Provide a New Type of Leisure – Entertainment Golf
                                        Our Portfolio Of Entertainment Venues Directly Addresses Consumers’ Changing Preferences

                 Consumers are choosing to                                                  Drive Shack Inc. combines 3 experiences
                 spend more on experiences:(1)                                              under one roof:

                                                                                                 ▪ Entertainment
                                                       of millennials would rather           1
                    78%
                                                                                                      Guests interact, play and socialize in a
                                                       spend money on an                              sophisticated, fun setting
                                                       experience vs. buying
                                                                                                      Sports
                                                       something(2)                           2▪      Anchored on driving range and putting
                                                                                                      featuring robust gaming platform
                                                       of consumers prefer to dine
                   70%                                 at entertainment formats vs.
                                                       typical casual restaurants for
                                                                                              3▪      Food & Beverage
                                                                                                      Elevated Food & Beverage with focus on
                                                       group occasions(3)                             “sharable” options

                                                                                                      = Competitive Socializing

1) Source: Pew Research Center (April 2018); Forbes (June 2014).
2) Source: USA Today (June 2017).
3) Source: Technomic Research (2019)

                                                                                                   C O N F I D E N T I AL : M a y o n l y b e u s e d w i t h c o n s e n t . / © 2 0 2 1 D r i v e S h a c k I n c .
PAGE 6
                                                                                                                    Executive Summary
                                            Our Transformation…How We Got Here
                                          We’ve transformed from a traditional golf business into an entertainment operating company

                                                                                                                                                            Entertainment Golf: Drive Shack and Puttery

          Traditional Golf Roots: AGC                                                                                                         Drive Shack Venues
                                                                                                                                                 Opened first Drive Shack in Orlando – April 2018

                                                                                                                                                 − Used as beta site to test enhancements for next generation of venues
American Golf Corp.                                                                                       Transformed
                                                                                                           Traditional
  As a traditional golf company, we own, lease                                                            Golf Business                          Opened 3 Gen 2.0 venues across 2H 2019
  and manage courses                                                                                        into an                                 − Raleigh, Richmond and West Palm
                                                                                                         Entertainment
   − Sold majority of owned course portfolio,                                                                                                       − Significantly outperformed expectations in 2019; beat internal
                                                                                                           Operating
        continue to lease and manage courses                                                                                                             revenue plan by +14%
                                                                                                           Company

                                                                                                                                              Puttery Venues
                                                                                                                                                 Developed new entertainment golf experience – indoor, tech-enabled
                                                                                                                                                 putting within an immersive experience

                                                                                                                                                 Opened first Puttery in The Colony, Texas – September 2021

Based on management’s current views and estimates. See “Disclaimers” at the beginning of this Presentation for more information on forward-looking statements.

                                                                                                                                                                  C O N F I D E N T I AL : M a y o n l y b e u s e d w i t h c o n s e n t . / © 2 0 2 1 D r i v e S h a c k I n c .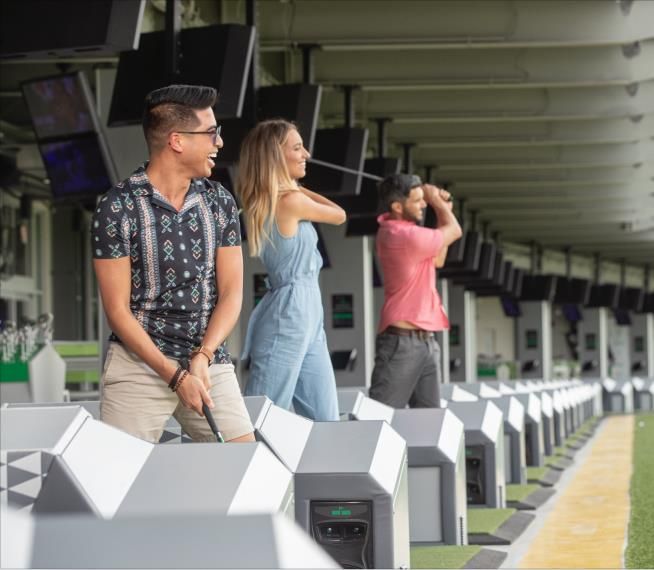
PAGE 7
                                                                                                                   Executive Summary
                                                                             Our Courses and Venues                                                                                                          (1)

                       AGC                                        OWNED                                     LEASED                                      MANAGED
                      GOLF                                       1 Course                                 33 Courses                                    22 Courses
                    COURSES
                                                                          CURRENT VENUES                                                                                            COMMITTED VENUES

                                                                             Orlando, FL                             Raleigh, NC                                         New Orleans, LA
                          DRIVE                                              Opened Q2                               Opened Q3                                           On Hold (2)
                                                                                                                                                                                                                           Manhattan, NY
                                                                                                                                                                                                                           (Randall's Island)
                         SHACK                                               (Beta Site)                             Richmond, VA
                                                                                                                     Opened Q3
                         VENUES                                                                                      West Palm, FL
                                                                                                                     Opened Q4

                                                                   2018                                   2019                                                2021                                    2022 – 2024
                         PUTTERY                                                                                                                                                                                            Robust Pipeline in 26
                                                                                                                                                                         Dallas, TX
                         VENUES                                                                                                                                          Charlotte, NC                                      Prioritized Markets for
                                                                                                                                                                         Washington DC                                      Opening 2022 – 2024
                                                                                                                                                                         Miami, FL
                                                                                                                                                                         Houston, TX
                                                                                                                                                                         +2 Additional Targets
                                                                                                                                                                         (in or near lease execution)
1) As of 6/30/2021.
2) Drive Shack is committed to leases in New Orleans and Randall’s Island. New Orleans development remains “on hold” and Randall’s Island is expected to open by the end of 2023.
Based on management’s current views and estimates. See “Disclaimers” at the beginning of this Presentation for more information on forward-looking statements.

                                                                                                                                                                            C O N F I D E N T I AL : M a y o n l y b e u s e d w i t h c o n s e n t . / © 2 0 2 1 D r i v e S h a c k I n c .
PAGE 8
STRATEGIC PARTNERSHIP Executed agreement with
Rory McIlroy and his partner
WITH RORY MCILROY group, Symphony Ventures
Rory and team investing in future of Puttery
Transaction details:
‒ Symphony Ventures to invest at least $10M through 2023
‒ Acquires 10% equity ownership in each Puttery opened through 2023
(until $10M commitment met)
‒ Purchase price equal to 10% of each Puttery’s net cost-to-build
(1)
‒ Symphony may invest on proposed terms through 2023
(once $10M commitment met)
‒ Option to upsize ownership to 20% within first year of initial investment
‒ Symphony receives quarterly pro-rata cash distribution of each
venue’s net cash flows
‒ In 2024, Symphony has option to convert all or a portion of their
interests into common equity of Drive Shack Inc.(2)
1) Net cost-to-build is gross development costs less landlord tenant Improvement contributions.
2) If option exercised on or after 1/1/2024, conversion terms/price will be mutually agreed at a fair value price.
C O N F I D E N T I AL : M a y o n l y b e u s e d w i t h c o n s e n t . / © 2 0 2 1 D r i v e S h a c k I n c .1. Executive Summary 2. Our Business 3. Historical Financials
DRIVE SHACK
Entertainment Golf
PAGE 11
                                        Our Business
       Drive Shack… The New Way to Golf
 Our Venues Are Designed To Solve Issues Preventing Growth Across The Traditional Golf Industry

More affordable                Indoor/outdoor                Less time                                          All skill level
no equipment                   all-weather                   required                                           players can play
purchase required              games

The shift to               ✓   Higher growth trajectory
entertainment golf         ✓   Lower cyclicality
from traditional           ✓   Increased margins
golf provides us           ✓   Improved capital efficiency
with:                      ✓   Enhanced shareholder value creation

                                                            C O N F I D E N T I AL : M a y o n l y b e u s e d w i t h c o n s e n t . / © 2 0 2 1 D r i v e S h a c k I n c .
PAGE 12
Our Business
DS Venues Surpass Their Pre-Pandemic EBITDA Levels (1)
Continue to gain momentum, delivered better than expected results in Q2-21
Q2-21 venue EBITDA(1)
was $4.6M vs. $(1.1M) a DS Venue Revenue and EBITDA (1) ($M)
year ago
2019 2020 2021
Q2-21 Revenue was Q4 Q1 Q2 Q3 Q4 FY Q1 Q2
$11.6M, with record high
walk-in revenue in each Revenue $12.9 $10.1 $1.8 $6.2 $7.2 $25.2 $8.2 $11.6
venue
Venue EBITDA (1) $1.4 $0.3 ($1.1) $1.1 $1.7 $2.0 $2.0 $4.6
Our venues have largely
returned to pre-COVID
levels, with the exception
of events
1) Venue EBITDA is a Non-GAAP financial metrics. See Adjusted EBITDA and Venue EBITDA Non-GAAP Reconciliations on page 29 and Non-GAAP Reconciliation to Venue EBITDA from Operating Income for Entertainment Golf on page 30.
C O N F I D E N T I AL : M a y o n l y b e u s e d w i t h c o n s e n t . / © 2 0 2 1 D r i v e S h a c k I n c .PAGE 13
Our Business
DS Venues Deliver All-Time High Walk-In Revenue in Q2-21
Q2 2021 Total Revenue of $11.6M – Walk-in Revenue of $10.1M | Events Revenue of $1.5M
− Walk-in business is returning to normalized, pre-COVID levels
− Q2-21 walk-in revenue was up +26% to Q4-19 levels of $8.0M
− Delivered record high walk-in revenue(1) in Q2-21 in all venues
Drive Shack Venues: Revenue by Quarter
($ in 000's)
Walk-In Event $4,971
$4,302
$4,034
$3,751
$3,560 $3,541
$3,310
$3,165
$2,751
$2,591
$2,375
$2,192 $2,183 $2,111
$1,860 $1,877
$1,679 $1,515
$1,175 $1,202 $1,022 $1,353
$550 $724
$63 $0 $0 $144
Q4- Q1- Q2- Q3- Q4- Q1- Q2- Q4- Q1- Q2- Q3- Q4- Q1- Q2- Q4- Q1- Q2- Q3- Q4- Q1- Q2- Q4- Q1- Q2- Q3- Q4- Q1- Q2-
19 20 20 20 20 21 21 19 20 20 20 20 21 21 19 20 20 20 20 21 21 19 20 20 20 20 21 21
West Palm Richmond Raleigh Orlando
1) Excludes Orlando’s grand opening quarter in Q2-18 of $1.8M in total revenue, with $1.4M in walk-in revenue and $0.4M in event revenue.
C O N F I D E N T I AL : M a y o n l y b e u s e d w i t h c o n s e n t . / © 2 0 2 1 D r i v e S h a c k I n c .PUTTERY Entertainment Golf
Our Business PAGE 15
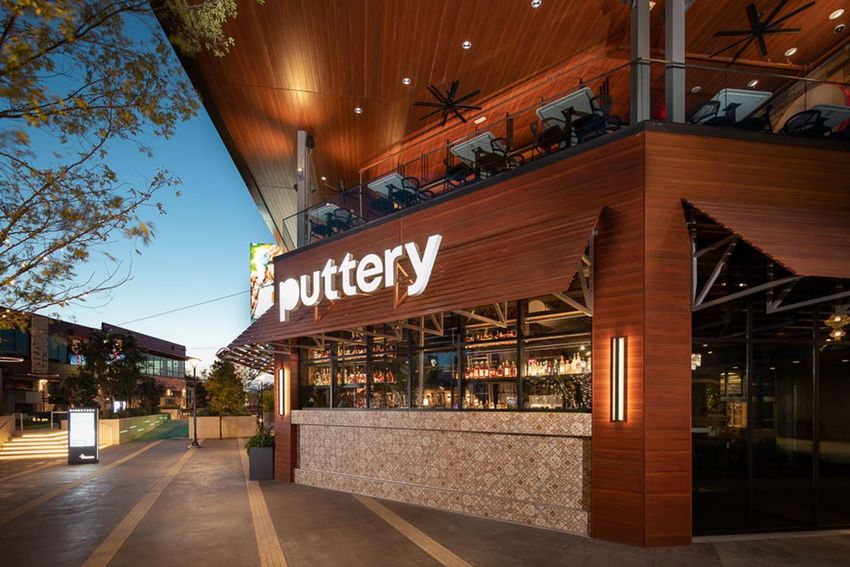
What is The Puttery Experience
Puttery?
Puttery is an adult-focused, modern spin on
putting, re-defining the game within an
immersive experience and innovative
technology focused on competitive
socializing.
With a high-energy atmosphere that
combines plentiful curated culinary offerings
and inventive craft cocktails centered around
a lively bar area with great music, guests can
relax and enjoy their evening before, during
and after their tee time.
C O N F I D E N T I AL : M a y o n l y b e u s e d w i t h c o n s e n t . / © 2 0 2 1 D r i v e S h a c k I n c .PAGE 16
Our Business
The Colony (Dallas) – Opened September 3rd
Early results for The Colony:
− Walk-in traffic on pace with
expectations
− Over 60% of walk-in guests
plan their visit in advance
(i.e., gameplay reservations)
− Spend for walk-in guests is
currently trending 60% F&B
and 40% gameplay
− Alcohol/liquor is averaging
~45% of total revenue
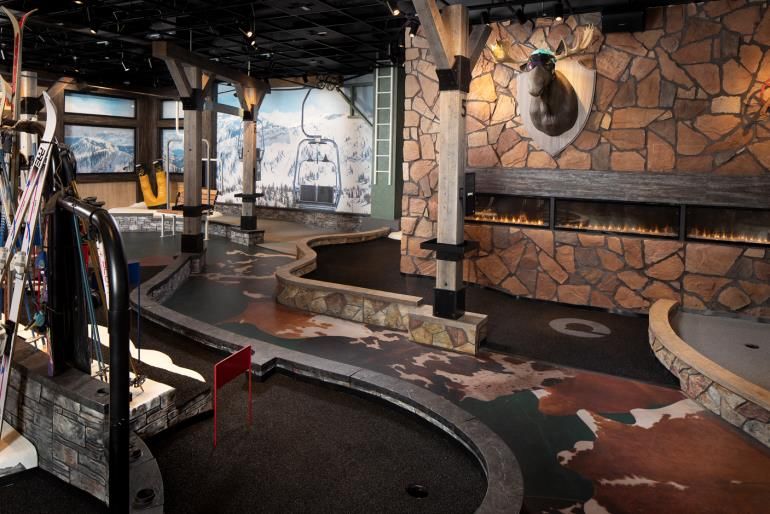
Our Puttery in The Colony, Texas has 20,700 sq. ft.
spanning two floors with four, nine-hole uniquely
themed golf courses – Rooftop, Lodge, Library
and Illusion. We have three bars, a patio terrace,
multiple lounges, and seating areas throughout.
C O N F I D E N T I AL : M a y o n l y b e u s e d w i t h c o n s e n t . / © 2 0 2 1 D r i v e S h a c k I n c .Our Business PAGE 17
Prioritized and Development Update
Committed to 7 Puttery venues in 2021
Future Markets − 5 sites currently in development
− 2 additional sites are in or nearing lease execution
Believe current market allows for numerous
Applying learnings to future venues, including Charlotte
Puttery locations across the U.S.
Additional 10 Puttery venues in 2022 expected to be open,
under development or in lease
MANHATTAN, NY
Projected Opening Dates
WASHINGTON D.C. The Colony, TX – Opened 9/3/2021
RICHMOND, VA
RALEIGH, NC
Charlotte, NC – Q4 2021
CHARLOTTE, NC
Washington DC – Q1 2022
Drive Shack
ORLANDO, FL
Miami, FL – Q3 2022
(Open venues in black) NEW ORLEANS, LA WEST PALM BEACH, FL
(On Hold)
Houston, TX – Q3 2022
HOUSTON, TX
Puttery MIAMI, FL
DALLAS, TX
Prioritized & Future Markets
Manhattan (Randall’s Island) – 2023
Based on management’s current views and estimates. See “Disclaimers” at the beginning of this Presentation for more information on forward-looking statements.
C O N F I D E N T I AL : M a y o n l y b e u s e d w i t h c o n s e n t . / © 2 0 2 1 D r i v e S h a c k I n c .PAGE 18
Our Business
Attractive Unit Economics
Puttery presents the best path forward for near-term growth; it’s an adjacency to our
current business and gives us the ability to grow quickly with less capital risk
Illustrative Venue-Level Economics(1)
$M DS Venues Puttery Venues
72 to 90+ Bays Indoor Putting
– Plan to build 50 Puttery venues and DS Size (sq. ft.) 50K - 60K+ 15K - 20K
Manhattan by the end of 2024
Development Time 18 - 24 mo. 6 - 9 mo.
– Puttery venue EBITDA is expected to be
$2 to $3 million Development Cost(2) $25 - $40 $7 - $11
– Drive Shack venue EBITDA is approx. $4
Total Revenue $15 - $25 $7 - $11
to $6 million
Venue EBITDA $4 - $6 $2 - $3
As we continue to open
Development Yields 10 – 20% 25 – 40% Puttery venues, yields
may be even higher
1) Represents illustrative economics of Puttery and Drive Shack venues, including Total Revenue and Venue EBITDA, without restrictions or impact due to COVID-19.
2) Development cost target is inclusive of all construction costs, soft costs, and pre-opening expenses..
Based on management’s current views and estimates. See “Disclaimers” at the beginning of this Presentation for more information on forward-looking statements.
C O N F I D E N T I AL : M a y o n l y b e u s e d w i t h c o n s e n t . / © 2 0 2 1 D r i v e S h a c k I n c .PAGE 19
Our Goals are
Simple… 17
Puttery
$2 - $3M = ~$47M
RR Contribution per venue Total Puttery
RR Contribution
1 17 Puttery Venues(1)
by 2022
5 $4 - $6M = ~$21M
2 5 DS Venues(2)
by 2023
Drive Shack RR Contribution per venue Total Drive Shack
RR Contribution
1) Venues open, under development or in lease
2) Drive Shack venues include Raleigh, Richmond, West Palm Beach and Orlando, as well as Manhattan (Randall’s Island) which is expected to open in 2023.
Based on management’s current views and estimates. See “Disclaimers” at the beginning of this Presentation for more information on forward-looking statements
There can be no assurance that we will achieve Run Rate EBITDA and Enterprise Valuation projections and actual results may differ materially
C O N F I D E N T I AL : M a y o n l y b e u s e d w i t h c o n s e n t . / © 2 0 2 1 D r i v e S h a c k I n c .AMERICAN GOLF CORP Traditional Golf
PAGE 21
                              Our Business

American Golf Corp.                                      One of the largest operators
                                                         of golf properties in the U.S.
         1
                                                         AGC operates 56 traditional courses(1) nationwide serving
     1
                                                         over 3 million visitors per year
                      1                              5

                                                         Municipality partnerships account for ~85% of AGC’s leased
44                                                       properties; most relationships have lasted 3+ decades
                                                            − Able to leverage these strong relationships as we
                          1                                    build out entertainment venues
                                             1
                                 1
                                                         AGC serves as a consistent and stable business
                                                 1

      AGC courses

1) As of 6/30/2021.

                                                                 C O N F I D E N T I AL : M a y o n l y b e u s e d w i t h c o n s e n t . / © 2 0 2 1 D r i v e S h a c k I n c .
PAGE 22
Our Business
Strong Demand Continues for Traditional Golf (1)
− American Golf’s exceptional results highlight the unwavering demand for traditional golf
− As of Q2-21, private course membership levels are near max capacity at 99%, leaving ~1% availability for new member sales
Public Courses Private Courses
+126% +106% at 99% +61%
Revenue from green & Daily fee rounds of Member level max Total rounds
cart fees vs. Q2 2020 capacity vs. Q2 2020
641K
vs. Q2 2020
608K
$21.4M 2,750 2,748
$20.5M
2,706
2,673 100K
506K
2,620 2,612
$16.7M 89K
455K
79K 80K
$14.3M 77K
342K
296K 56K
$9.8M
$9.5M
Q1-20 Q2-20 Q3-20 Q4-20 Q1-21 Q2-21 Q1-20 Q2-20 Q3-20 Q4-20 Q1-21 Q2-21 Q1-20 Q2-20 Q3-20 Q4-20 Q1-21 Q2-22 Q1-20 Q2-20 Q3-20 Q4-20 Q1-21 Q2-21
Full Golf Member Levels vs. Max Avail Total rounds
Revenue from green/cart fees Daily Fee Rounds
Current Golf Member Levels
1) Comparisons are based on our 30 public and 4 private owned and leased properties as of 6/30/2021. Max Golf Member Levels
C O N F I D E N T I AL : M a y o n l y b e u s e d w i t h c o n s e n t . / © 2 0 2 1 D r i v e S h a c k I n c .1. Executive Summary 2. Our Business 3. Historical Financials
PAGE 24
                                                                                                 Historical Financials
                                             American Golf Historical Performance
                                           − Closed nearly every traditional golf course by end of Q1 2020 due to COVID
                                           − By June 2020, all AGC properties had reopened and were met with significant demand
                                           − Delivering strong results despite limitations on large group gatherings; event revenue remain challenging

                                                                             AGC Revenue by Quarter: Q1 – Q4 (2018 – 2021)
                                                               Non-Event                                                                                                                                    ($ in M’s)

                                                               Event
                                                                                                $18                              $15

                                                                                                       $13                              $11
                                                             $8                                                           $2                         $0         $13
                                                                                         $0                                                                                              $0
                                                                                                                                                                            $10
                                                                       $6         $5

                                                                                                $71                $0            $71
                                                             $58                                       $57                $60           $60         $60
                                                                                         $53                                                                    $55                     $53
                                                                       $46        $46                                                                                       $49

                                                                                                                   $30

                                                             2018   2019          2020   2021   2018   2019        2020   2021   2018   2019        2020        2018       2019        2020
                                                                             Q1                               Q2                         Q3                                  Q4

                                                                     The 2020 vs. 2019 decrease is primarily driven by course closures (Q2) and events (Q2/Q3)
                                                                    The 2019 vs. 2018 decrease is largely due to fewer golf courses owned or operated in 2019 (1)

1) Began 2018 with 75 courses, ended 2019 with 59 courses.

                                                                                                                                        C O N F I D E N T I AL : M a y o n l y b e u s e d w i t h c o n s e n t . / © 2 0 2 1 D r i v e S h a c k I n c .
PAGE 25
Historical Financials
Financial Performance
Operating income of $1.1M and Adjusted EBITDA(1) of $7.7M in Q2-2021
Q2-21 vs
Total Company Results Q2 2020 Q1 2021 Q2 2021 Q1-21
Change
Operating Results Highlights
Revenue $32.1 $61.1 $73.9 $12.8
DS Revenue $1.8 $8.2 $11.6 $3.4
AGC Revenue $30.3 $52.9 $62.3 $9.4 − DS venues delivered all-time high walk-in
revenue(4) in Q2-21
Total Operating Costs $44.2 $69.0 $72.8 $3.9
− Reported first quarterly Operating Income
Operating Income (Loss) ($12.1) ($7.9) $1.1 $8.9
since Q2-2018
Net Loss ($39.5) ($10.9) ($2.0) $8.9
− Adjusted EBITDA(1) of $7.7M (Q2-21) –
Net Loss Applicable to Common our 4th consecutive quarter of positive
Stock, per share(2) ($0.61) ($0.15) ($0.04) $0.11 Adjusted EBITDA
Adjusted EBITDA(1) ($7.0) $2.7 $7.7 $5.0 − Unrestricted cash of $81M at end of Q2-21,
ample liquidity to fund first 7 Puttery venues
Total Debt and Preferred Stock(3) $112.8 $112.8 $112.8 ($0.0)
Unrestricted Cash on Hand $12.6 $85.9 $81.4 ($4.5)
1) Adjusted EBITDA is a Non-GAAP financial metric. See Adjusted EBITDA Non-GAAP Reconciliation on page 29
2) Amounts shown are for both Basic and Diluted per share results for all periods presented.
3) Total debt includes Jr. Subordinated Notes and Preferred Stock
4) Excludes Orlando’s grand opening quarter in Q2-18 of $1.4M in walk-in revenue
Based on management’s current views and estimates. See “Disclaimers” at the beginning of this Presentation for more information on forward-looking statements.
C O N F I D E N T I AL : M a y o n l y b e u s e d w i t h c o n s e n t . / © 2 0 2 1 D r i v e S h a c k I n c .Historical Financials PAGE 26
2021 Summary $ in millions, except per share data
Three Months Ended June 30,
2021 2020 $ Variance % Variance
Financial Results
Drive Shack Revenue $11.6 $1.8 $9.8 548%
American Golf Revenue $62.3 $30.3 $32.0 106%
Total Company Revenue $73.9 $32.1 $41.8 130%
(Q2 & 1H) Operating Income (Loss) $1.1 ($12.1) $13.2 109%
Net Loss ($2.0) ($39.5) $37.5 95%
Adjusted EBITDA(1) $7.7 ($7.0) $14.8 210%
Net Loss Applicable to Common Stock, ($0.04) ($0.61) $0.57 93%
per share(2)
Six Months Ended June 30,
2021 2020 $ Variance % Variance
Drive Shack Revenue $19.8 $11.9 $7.9 66%
American Golf Revenue $115.2 $81.3 $33.8 42%
Total Company Revenue $135.0 $93.2 $41.7 45%
Operating Loss ($6.8) ($27.0) $20.2 75%
Net Loss ($12.9) ($56.9) $44.0 77%
Adjusted EBITDA(1) $10.5 ($11.7) $22.2 189%
Net Loss Applicable to Common Stock, ($0.18) ($0.89) $0.71 80%
per share(2)
1) Adjusted EBITDA is a Non-GAAP financial metric. See Adjusted EBITDA and Venue EBITDA Non-GAAP Reconciliation on page 29.
2) Amounts shown are for both Basic and Diluted per share results for the periods ended June 30, 2021 and June 30, 2020.
C O N F I D E N T I AL : M a y o n l y b e u s e d w i t h c o n s e n t . / © 2 0 2 1 D r i v e S h a c k I n c .Historical Financials PAGE 27
Consolidated
CONSOLIDATED STATEMENTS OF OPERATIONS (unaudited)
(dollars in thousands, except share data)
Three Months Ended June 30, Six Months Ended June 30,
Statements of
2021 2020 2021 2020
Revenues
Golf operations $61,750 $29,675 $114,912 $78,300
Operations
Sales of food and beverages 12,129 2,425 20,059 14,935
Total revenues 73,879 32,100 134,971 93,235
Operating costs
(unaudited) Operating expenses
Cost of sales – food and beverages
55,635
3,151
33,224
829
104,504
5,255
87,591
4,484
General and administrative expense 8,028 6,368 16,012 16,186
Depreciation and amortization 5,784 6,682 12,029 13,476
Pre-opening costs 789 270 1,345 822
(Gain) Loss on lease terms/impairment (561) (3,125) 2,648 (2,333)
Total operating costs 72,826 44,248 141,793 120,226
Operating incomne (loss) 1,053 (12,148) (6,822) (26,991)
Other income (expenses)
Interest and investment income 159 135 312 265
Interest expense, net (2,713) (2,591) (5,339) (5,336)
Other income (loss) (18) (24,422) (79) (24,055)
Total other income (expenses) (2,572) (26,878) (5,106) (29,126)
Loss before income tax (1,519) (39,026) (11,928) (56,117)
Income tax expense 450 500 945 771
Net loss (1,969) (39,526) (12,873) (56,888)
Preferred dividends (1,395) (1,395) (2,790) (2,790)
Loss Applicable to Common Stockholders ($3,364) ($40,921) ($15,663) ($59,678)
Weighted Average per Share ($0.04) ($0.61) ($0.18) ($0.89)
C O N F I D E N T I AL : M a y o n l y b e u s e d w i t h c o n s e n t . / © 2 0 2 1 D r i v e S h a c k I n c .Historical Financials PAGE 28
CONSOLIDATED BALANCE SHEETS
(dollars in thousands, except share data)
Consolidated
(unaudited)
June 30, 2021 December 31, 2020
Assets
Current Assets:
Balance Sheets
Cash and cash equivalents $81,428 $47,786
Restricted cash 2,990 2,252
Accounts receivable, net 4,577 4,446
Real estate securities, available-for-sale 3,341 3,223
(condensed and unaudited) Other current assets 22,879 14,410
Total Current Assets 115,215 72,117
Restricted cash, noncurrent 1,027 795
Property and equipment, net of acc. depreciation 171,126 169,425
Operating lease right-of-use assets 187,870 192,828
Intangibles, net of accumulated amortization 14,181 15,124
Other assets 6,420 6,765
Total Assets $495,839 $457,054
Liabilities
Current Liabilities:
Obligations under finance leases $5,794 $6,470
Membership deposit liabilities 14,748 14,692
Accounts payable and accrued expenses 32,752 29,596
Deferred revenue 16,529 23,010
Other current liabilities 24,775 28,217
Total Current Liabilities 94,598 101,985
Credit facilities & obligations under finance leases - noncurrent 10,402 12,751
Operating lease liabilities - noncurrent 172,372 167,837
Junior subordinated notes payable 51,179 51,182
Membership deposit liabilities, noncurrent 103,859 99,862
Deferred revenue, noncurrent 10,224 9,953
Other liabilities 3,695 3,447
Total Liabilities 446,329 447,017
Stockholders' Equity
Preferred Stock 61,583 61,583
Common Equity (12,073) (51,546)
Total Stockholders' Equity 49,510 10,037
Total Liabilities & Stockholders' Equity $495,839 $457,054
C O N F I D E N T I AL : M a y o n l y b e u s e d w i t h c o n s e n t . / © 2 0 2 1 D r i v e S h a c k I n c .Historical Financials PAGE 29
Adjusted EBITDA and Venue EBITDA Non-GAAP Reconciliations
Adjusted EBITDA
(dollars in thousands)
Adjustments to Operating Income Adjustments to Adjusted EBITDA Add Back
(Gain) Loss on
Net Income Other Net Operating
and Venue EBITDA
Deprec. & Lease Pre-opening (1) Adjusted Core Venue
Income Tax (Income) Interest Income Other Items (2)
Amort. Terminations & Costs EBITDA SG&A EBITDA
(Loss) Expense Loss, net Expense (Loss)
Impairment
Q2 2021
Non-GAAP Total Company
Drive Shack
($1,969)
($1,669)
$450
$0
$18
-
$2,554
$77
$1,053
($1,592)
$5,784
$2,952
($561)
$0
$789
$788
$654
$184
$7,719
$2,332
$7,376
$2,267
$15,095
$4,599
Reconciliations
AGC 3,188 0 62 2,333 5,583 2,782 (561) 0 32 7,836 2,662 10,498
Corporate (3,488) 450 (44) 144 (2,938) 50 0 1 438 (2,449) 2,446 (3)
Q2 2020
Total Company ($39,526) $500 $24,422 $2,456 ($12,149) $6,682 ($3,125) $270 $1,272 ($7,050) $5,096 ($1,953)
Drive Shack ($6,697) $0 - $102 ($6,596) $3,001 $0 $270 $946 ($2,379) $1,245 ($1,133)
AGC (5,707) 0 119 2,062 (3,526) 3,608 (3,125) 0 41 (3,002) 2,181 (821)
Corporate (27,122) 500 24,302 292 (2,028) 73 0 0 285 (1,670) 1,671 1
Q2 2021 (YTD)
Total Company ($12,873) $945 $79 $5,027 ($6,822) $12,029 $2,648 $1,345 $1,250 $10,450 $14,761 $25,211
Non-GAAP Financial Measure
Drive Shack ($5,666) $0 - $159 ($5,507) $5,904 $22 $1,344 $525 $2,288 $4,316 $6,603
Adjusted EBITDA is not a measurement of financial performance under generally accepted accounting principles in the AGC 3,364 0 176 4,556 8,096 6,003 (561) 0 43 13,581 5,029 18,611
United States ("GAAP") and should not be considered in isolation or as an alternative to GAAP financial measures. We Corporate (10,571) 945 (97) 312 (9,411) 122 3,187 1 682 (5,418) 5,417 (2)
believe this non-GAAP financial measure, as we have defined it, provides a supplemental measure of financial
performance of our current operations at our entertainment and traditional golf venues. This measure excludes items
that we believe are unrelated to the day-to-day performance of our current golf entertainment or traditional golf venues, Q2 2020 (YTD)
including one-time pre-opening costs associated with new venue openings, corporate severance payments, (gain) loss on
lease terminations and impairment, stock-based compensation, depreciation and amortization and other income (which Total Company ($56,888) $771 $24,055 $5,071 ($26,991) $13,476 ($2,333) $822 $3,280 ($11,747) $12,907 $1,160
does not include revenue from golf entertainment or traditional golf venues). This non-GAAP financial measure is
presented so that investors have the same type of financial data that management uses in evaluating the financial Drive Shack ($13,241) $0 - $206 ($13,035) $6,021 $0 $822 $1,164 ($5,028) $4,231 ($798)
performance of the Company.
AGC (12,808) 0 165 4,185 (8,457) 7,311 (2,333) 0 408 (3,070) 5,029 1,958
The principal limitation of this non-GAAP measure is that it excludes significant expenses and income that are required by Corporate (30,839) 771 23,889 680 (5,499) 144 0 0 1,708 (3,647) 3,648 1
GAAP to be recorded in our financial statements. A reconciliation is provided for the non-GAAP financial measure to our
GAAP net income/(loss). Investors are encouraged to review the related GAAP financial measures and the reconciliation
of the non-GAAP financial measure to our GAAP net income/(loss), and not to rely on any single financial measure to
evaluate our business.
Adjusted EBITDA. We define Adjusted EBITDA as GAAP net income (loss), adjusted for income tax expenses, other income
(loss), interest expenses, interest and investment income, depreciation and amortization, gain (loss) on lease (1) For the three months ended June 30, 2021 and 2020, other items include (i)corporate severance of $0 and $0, respectively; (ii) transactional G&A of $176 and $836, respectively; and (iii) stock-based
terminations, impairment and other losses, pre-opening costs and certain other non-recurring items (including corporate compensation of $478 and $436, respectively. For the six months ended June 30, 2021 and 2020, other items include (i)corporate severance of $130 and $693, respectively; (ii) transactional G&A of
severance payments, transactional G&A and stock-based compensation). $372 and $2,014, respectively; and (iii) stock-based compensation of $748 and $572, respectively.
(2) Core SG&A represents Total G&A less transactional G&A, employee stock-based compensation, and severance
C O N F I D E N T I AL : M a y o n l y b e u s e d w i t h c o n s e n t . / © 2 0 2 1 D r i v e S h a c k I n c .Historical Financials PAGE 30
Non-GAAP Non-GAAP Reconciliation to Venue EBITDA from Operating Income for Entertainment Golf ("EG")
(dollars in thousands)
Reconciliation to Qtr2-21 Qtr1-21 Qtr4-20 Qtr3-20 Qtr2-20 Qtr1-20 Qtr4-19
Venue EBITDA
Non-GAAP Reconciliation to Venue EBITDA for EG
Operating Income (Loss) for EG ($1,592) ($3,915) ($2,182) ($4,886) ($6,595) ($6,440) ($16,264)
Depreciation and amortization for EG $2,952 $2,952 $2,948 $2,991 $3,001 $3,020 $2,816
from Operating
(Gain) Loss on lease termination & impairment for EG - 22 (1,977) 16 - - 8,927
Pre-opening costs for EG 788 556 280 227 270 552 1,811
Total general & administration expenses for EG 2,451 2,390 2,615 2,745 2,191 3,203 4,128
Income for Venue EBITDA for Entertainment Golf $4,599 $2,004 $1,685 $1,094 ($1,133) $335 $1,418
Entertainment Golf
C O N F I D E N T I AL : M a y o n l y b e u s e d w i t h c o n s e n t . / © 2 0 2 1 D r i v e S h a c k I n c .You can also read