Second Quarter 2021 Highlights
←
→
Page content transcription
If your browser does not render page correctly, please read the page content below

Second Quarter 2021 Highlights

Disclaimer
    We are not making any representations or warranties, express or implied, with respect to the information (financial, business, legal or otherwise) contained in this presentation. No person has been authorized to give any information other than that contained in this
    presentation.

    Forward-Looking Statements
    This presentation, as well as other written or oral communications made from time to time by us, may contain certain forward-looking statements. Forward-looking statements refer to our current expectations and projections relating to our financial condition, results
    of operations, plans, objectives, strategies, future performance, and business. You can identify forward-looking statements by the fact that they do not relate strictly to historical or current facts. Forward-looking statements include statements containing words such
    as ‘‘anticipate,’’ ‘‘assume,’’ ‘‘believe,’’ ‘‘can,’’ have,’’ ‘‘contemplate,’’ ‘‘continue,’’ ‘‘could,’’ ‘‘design,’’ ‘‘due,’’ ‘‘estimate,’’ ‘‘expect,’’ ‘‘forecast,’’ ‘‘goal,’’ ‘‘intend,’’ ‘‘likely,’’ ‘‘may,’’ ‘‘might,’’ ‘‘objective,’’ ‘‘plan,’’ ‘‘predict,’’ ‘‘project,’’ ‘‘potential,’’ ‘‘seek,’’ ‘‘should,’’ ‘‘target,’’
    “will,’’ ‘‘would,’’ and other words and terms of similar meaning in connection with any discussion of the timing or nature of future operational performance or other events. For example, all statements made relating to growth strategies, estimated and projected costs,
    expenditures, and growth rates, plans and objectives for future operations, growth, or initiatives, or strategies are forward-looking statements.

    All forward-looking statements are subject to risks and uncertainties that may cause actual results to differ materially from those that are expected. The risks and uncertainties that could cause actual results to differ materially from those expressed or implied by
    these forward-looking statements include but are not limited to: (i) uncertainty regarding global economic conditions, particularly the uncertainty related to the duration and impact of the rapidly evolving COVID-19 pandemic, including its impact on global economic
    conditions; (ii) our ability to maintain and strengthen our brand and generate and maintain ongoing demand for our products; (iii) our ability to successfully design, develop and market new products; (iv) our ability to effectively manage our growth; (v) our ability to
    expand into additional consumer markets, and our success in doing so; (vi) the success of our international expansion plans; (vii) our ability to compete effectively in the outdoor and recreation market and protect our brand; (viii) the level of customer spending for
    our products, which is sensitive to general economic conditions and other factors; (ix) problems with, or loss of, our third-party contract manufacturers and suppliers, or an inability to obtain raw materials; (x) fluctuations in the cost and availability of raw materials,
    equipment, labor, and transportation and subsequent manufacturing delays or increased costs; (xi) our ability to accurately forecast demand for our products and our results of operations; (xii)our relationships with our national, regional, and independent retail
    partners, who account for a significant portion of our sales; (xiii) the impact of natural disasters and failures of our information technology on our operations and the operations of our manufacturing partners; (xiv) our ability to attract and retain skilled personnel and
    senior management and to maintain the continued efforts of our management and key employees; (xv) the impact of our indebtedness on our ability to invest in the ongoing needs of our business; and (xvi) the other risk factors detailed in our most recent Form 10-Q
    and Form 8-K filed with the Securities and Exchange Commission (the “SEC”), along with the associated press release.

    These forward-looking statements are made based upon detailed assumptions and reflect management’s current expectations and beliefs as of the date hereof. While we believe that these assumptions underlying the forward-looking statements are reasonable, we
    caution that it is very difficult to predict the impact of known factors, and it is impossible for us to anticipate all factors that could affect actual results. Readers of this presentation should consider these factors in evaluating, and are cautioned not to place undue
    reliance on, the forward-looking statements contained therein. YETI undertakes no obligation to publicly update or revise any forward-looking statements, whether as a result of new information, future events, or otherwise, except as required by law.

    Non-GAAP Financial Measures
    In addition to our results determined in accordance with GAAP, we supplement our results with non-GAAP financial measures, including Adjusted Selling, General and Administrative (“SG&A”) Expenses, Adjusted Operating Income, Adjusted Net Income and
    Adjusted Net Income per Diluted Share (“Adjusted EPS”). Our management uses these non-GAAP financial measures in conjunction with GAAP financial measures to measure our profitability and to evaluate our financial performance. We believe that these
    measures are useful to investors as they are widely used measures of performance and to facilitate comparisons to other companies. These non-GAAP financial measures have limitations as analytical tools in that they do not reflect all of the amounts associated
    with our results of operations as determined in accordance with GAAP. Because of these limitations, these non-GAAP financial measures should be considered along with GAAP financial performance measures. The presentation of these non-GAAP financial
    measures is not intended to be considered in isolation or as a substitute for, or superior to, financial information prepared and presented in accordance with GAAP. Investors are encouraged to review the reconciliation of these non-GAAP financial measures to their
    most directly comparable GAAP financial measures. See Appendix for reconciliation of GAAP to Non-GAAP financial measures and see investors.yeti.com for recast 2019 Non-GAAP financial results, as discussed below.

    Free cash flow represents cash flow from operating activities less capital expenditures.

    Revised Non-GAAP Financial Measures Beginning in Fiscal 2020
    As previously disclosed, following YETI’s initial full year as a public company and beginning with the first quarter of Fiscal 2020, YETI revised its definitions of certain non-GAAP financial measures by eliminating various adjustments. These revisions are intended to
    align with how management will evaluate the performance of the business going forward. Specifically, YETI no longer includes adjustments for investments in new retail locations and international market expansion, transition to the ongoing senior management
    team, and transition to a public company.

    YETI has recast its historical 2019 non-GAAP financial measures to conform to the revised definitions on its investor relations website at investors.yeti.com.

2
1
        EXPANDING OUR CUSTOMER BASE
        Ongoing execution of Crossroads® bags go-to-market strategy

        Kickoff of Austin FC’s inaugural MLS season as official jersey sponsor and sustainability partner

    2   INTRODUCE NEW PRODUCTS
        Strong Q2 2021 YoY growth in Drinkware (+69%) and Coolers & Equipment (+23%)

        Announced fall colors, YETI Thin Ice, Rambler® 64 bottle, updated Camino and Travel Mug in two sizes

    3   ACCELERATE DTC
        Total DTC grew +48% YoY during Q2 2021 to reach 55% channel mix

        YETI.com showing positive trends in retention, average order value, and customer lifetime value

    4   EXPAND INTERNATIONALLY
        International grew +237% YoY during Q2 2021 to match a YETI-high of 9% of net sales

        Europe/UK wholesale door expansion up nearly 3x YTD at over 370 total doors

3
KEY LTM Q2 2021
                           LTM Q2 2021 Net Sales                                                             FINANCIAL METRICS

                                                                                                     $1.28BNet Sales
                                                                                                                                      +35%
                                                                                                                                        Net Sales

    Coolers &                                                                                           +31%                          +36%
    Equipment                                                                                         Coolers & Equipment               Drinkware
       40%                                      $1.28B
                                                                                        Drinkware
                                                                                           58%
                                                                                                       +52%                           +18%Wholesale
                                                                                                             DTC
                              Other1
                               2%
                                                                                                     $278MM
                                                                                                    Adjusted Operating Income2
                                                                                                                                     21.8%
                                                                                                                                 Adjusted Operating Margin

    1 Other includes apparel, bottle openers, ice substitutes, and other accessories.
    2 Please refer to Appendix for reconciliation of GAAP to non-GAAP measures.

4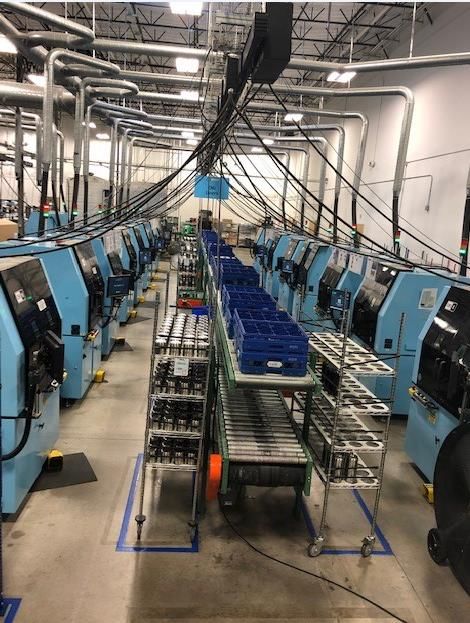
5

2006 Community Reach

                                            FISHING              HUNTING

                                         2021 Community Reach

    FISHING       HUNTING           BEER & BBQ        CULINARY      SKI/SNOWBOARD   SKATEBOARD   SURF/PADDLE

        CLIMB/ALPINE        RODEO            RANCH          WELLNESS           MUSIC        SPORTS

                            Relevance Through Breadth & Depth

                                            13
                                         Communities
                                                             142
                                                            Ambassadors
6
LARGE AND GROWING
                   SOCIAL MEDIA PRESENCE                                                      EARNED MEDIA AWARDS
                                                    Followers1

                                                                          4.8MM

                                                                         4.6MM

                                                                 3.7MM

                                                        1.7MM

                                                 994K

                                             760K

                                            603K

                                            601K

                                          488K
                                                                                  YETI - BRANDING   CROSSROADS DUFFEL   TUNDRA HAUL

                                                                     BROAD EARNED MEDIA COVERAGE

    1 Instagram followers as of July 30, 2021.

7
DOMESTIC UNAIDED BRAND AWARENESS BY REGION1

                                                                  2018              2019        2020              2021
                  26%
                                      24%
                                                     22%
          20%                       20%
            19%                                                      19%
                                                18%18%                                18%
                                                                                                     17%                                                                 17%
      16%                                                        16%                                                 16%
                                              15%                                                                  15%
                                                                                14%              14%                                                                   14%
                                13%                        13%                    13%                                           13%
                                                                                                                                                                   12%
                                                              11%             11%                             11%                  11%
                           10%                                                                                               10%                                 10%
                                                                                                                                                  9%        9%
                                                                                            8% 8%            8%
                                                                                                                                                       7%
                                                                                                                                             5%
                                                                                                                           4%

                                                                                                                     3                   3
        East South          West North        West South   South Atlantic 2    East North   Mid Atlantic 3    Pacific      New England        Mountain3           Total U.S.
         Central 2           Central 3         Central 2                        Central 3

    1 Per YETI’s 2021 Brand Tracking Study.
    2 Heritage market region.
    3 Non-heritage market region.

8
1H                  2H                 1H                     2H                   1H                        2H                         1H                      2H                     1H
                                            2017                2017               2018                   2018                 2019                      2019                       2020                    2020                   2021

                            Hard
                           Cooler                                                                                                              River           YETI          Roadie®                                             King Crab
                                          Limited Edition   Limited Edition    Limited Edition         Haul™      Silo®       Reef Blue                                                    Navy       Sagebrush   Ice Pink
                                                                                                                                               Green        V Series™          24                                                 Orange

                            Soft
                           Cooler                                                                                                              Daytrip® Hopper®                    Daytrip®
                                                            Hopper Flip® 8
                                          Hopper® Two                         Hopper BackFlip™                                 Charcoal       Lunch Bag  M30                      Lunch Box
                                                              & Flip® 18
Coolers & Equipment

                            Bags
                                                                              Camino®      Panga®        Tocayo™                              Crossroads™ Crossroads™
                                                             Panga® Duffel    Carryalla   Backpack       Backpack                               Backpack    Tote Bag                                                         Crossroads™ Collection

                            Cargo
                                                            LoadOut® Bucket                                                LoadOut GoBox™

                          Outdoor
                           Living                                               Hondo® Base          Boomer™ Lowlands™                        Trailhead™                           Trailhead™
                                                                                                                                                                Boomer™
                                                                                 Camp Chair             8      Blanket                          Dog Bed            4               Camp Chair
Drinkware

                          Rambler ®
                                         Colored                                                               Stackable   24 Oz.   Canyon    Jr. Kids   12 Oz. Stackable   Elements 26 Oz. New Colster      10 Oz.               46 Oz.
                                                    Jug          Mug           Wine Tumbler            Navy                 Mug                                    Mug
                                        Drinkware                                                                 Pint               Red       Bottle    Bottle             Collection Stackable Sizes      Rambler               Bottle
Other

                                                                                                        Cooler Cuts          Bait Shop                                  Spring Badge Fishing Club          Steer Hat and        Women’s
                                                             Howler Bros.                              Women’s Tank           T-Shirt                                      T-Shirt     Rope Hat               T-Shirts          Apparel

                                      INNOVATION CREATES REASON TO BUY                                                                       CUSTOMIZATION, COLORWAYS, AND LIMITED
                                         AND INCREASES ADDRESSABLE                                                                           EDITION OFFERINGS ENCOURAGE NEW AND
                                                  MARKETS                                                                                              REPEAT PURCHASES
                      9
10
HIGHLIGHTS                                                           STRATEGIC CHANNEL MIX CREATES STABLE, HIGH MARGIN PROFILE

     •    Diverse omni-channel business
                                                                                                      2015                      LTM Q2 2021
     •    Faster growing DTC business                                                   Wholesale2
                                                                                          92%
                                                                                                                         Wholesale
                                                                                                                           46%

     •    Diverse group of U.S. wholesale partners with
                                                                                                     $469MM                          $1.28B
          nationwide coverage; no account exceeds 10% of
          gross sales1                                                                                                                           DTC
                                                                                                                                                 54%
     •    Successful international entries into Canada,                                                DTC
          Australia, Japan, Europe, U.K., and New Zealand                                              8%
                                                                                                              NET SALES BY CHANNEL

           NATIONAL AND                                                INDEPENDENT
             REGIONAL                                                    SPECIALTY                   DIRECT-TO-CONSUMER              INTERNATIONAL
                                                                     ~4,500 ACCOUNTS3

                                                                                                                                       Entered     Entered
                                                                                                                                        2017        2017

                                                                                                                                       Entered     Entered
                                                                                                                                        2018        2019

                                                                                                                                       Entered     Entered
                                                                                                                                        2019        2019

         1 As a percent of Q2 2021 YTD gross sales.
         2 Wholesale includes $8.3 million of sales to Rambler On.

11       3 As of January 2, 2021.
YETI.COM RETAIL
CORPORATE SALES YETI AUTHORIZED
12GROWING GLOBAL SALES EXPANSION STRATEGY
• Capitalize on global digital, e-commerce, and mobile trends
DTC & Wholesale DTC & Wholesale
• Enter international markets via DTC and select wholesale
• Push global brand via Ambassador, influencer, and event
marketing
59%
50%
29% 31%
Wholesale DTC & Wholesale
8%
13 1 Represents last fiscal year percentage of sales from international markets per public company filings as of July 30, 2021. YETI international represents percentage of LTM Q2 2021 net sales.GLOBAL INFRASTRUCTURE GLOBAL FOOTPRINT
• Leading third-party manufacturing and logistics partners
l
• Focused on optimizing quality, delivery and best cost
l l
ll
l
l l
lll
l
ll l
l
•
l ll
Completed “should cost” analysis and supplier negotiations
• Soft coolers and bag supply chain transitioned out of China
• 3PL facilities in Dallas, Salt Lake City, Australia, New Zealand, l Coolers & Equipment l Drinkware Distribution Centers
Canada, and the Netherlands; strategic transition from Dallas to
Memphis in 2021
• Opened additional customization facilities (third-party manufacturing
partnerships)
1415
NET SALES

                                                                 $358

                                         $247

                                        Q2 2020              Q2 2021

     CATEGORY NET SALES GROWTH

            Coolers &
                                                     Drinkware                  $193
            Equipment                  $158

                             $129                                       $114

                            Q2 2020   Q2 2021                       Q2 2020    Q2 2021

     CHANNEL NET SALES GROWTH

          Wholesale                               Direct-to-Consumer
                                                                                $197
                                       $161

                                                                        $133
                             $114

                            Q2 2020   Q2 2021                       Q2 2020    Q2 2021
     Note: $ in millions.
16
GROSS PROFIT ADJUSTED SG&A1
Gross Profit $ / % Margin Adjusted SG&A1 $ / % Margin
$209 / 58.5% $132 / 36.8%
$138 / 55.7% $88 / 35.7%
Q2 2020 Q2 2021 Q2 2020 Q2 2021
ADJUSTED OPERATING INCOME1 ADJUSTED EPS1
Adjusted Operating Income1 $ / % Margin
$77 / 21.6% $0.68
$49 / 20.0%
$0.41
Q2 2020 Q2 2021 Q2 2020 Q2 2021
Note: $ in millions, except per share amounts.
1. Please refer to Appendix for reconciliation of GAAP to non-GAAP measures.
17NET SALES GROSS PROFIT
Gross Profit % Margin
$1,092
$629
$914
$475
$779 $383
58%
52%
49%
2018 2019 2020 2018 2019 2020
ADJUSTED OPERATING INCOME1 ADJUSTED NET INCOME PER DILUTED SHARE1
Adjusted Operating Income1 % Margin $1.87
$224
$143 $1.06
$124
$0.91
21%
16% 16%
2018 2019 2020 2018 2019 2020
Note: $ in millions, except per share amounts.
1. Please refer to Appendix for reconciliation of GAAP to non-GAAP measures.
18CASH FREE CASH FLOW1
$253 $351
$155
$80 $73
$55
2018 2019 2020 2018 2019 2020
CAPITAL EXPENDITUTRES TOTAL DEBT2
$333
Capital Expenditures % of Net Sales
$300
$32
$21
$16 $135
4%
2% 2%
2018 2019 2020 2018 2019 2020
Note: $ in millions.
1 Operating cash flow less capital expenditures
2 Excludes finance leases and unamortized deferred financing fees.
1920
2018                          2019(1)                         2020
     Operating income                                                                                                           $              102.2            $              89.8            $             214.2
     Non-cash stock-based compensation expense(2)(3)                                                                                             13.2                          52.3                             9.0
     Long-lived asset impairment(2)                                                                                                               1.2                             0.6                           1.1
     Investments in new retail locations and international market expansion(2)(4)                                                                 0.8                             —                              —
     Transition to Cortec majority ownership(2)(5)                                                                                                0.8                             —                              —
     Transition to the ongoing senior management team(2)(6)                                                                                       1.8                             —                              —
     Transition to a public company(2)(7)                                                                                                         4.2                             —                              —
     Adjusted operating income                                                                                                  $              124.2            $             142.7            $             224.3

     Net income                                                                                                                 $                57.8           $              50.4            $             155.8
     Non-cash stock-based compensation expense(2)(3)                                                                                             13.2                          52.3                             9.0
     Long-lived asset impairment                                                                                                                  1.2                             0.6                           1.1
     Loss on prepayment, modification, and extinguishment of debt(8)                                                                              1.3                             0.6                           1.1
     Investments in new retail locations and international market expansion(2)(4)                                                                 0.8                             —                              —
     Transition to Cortec majority ownership(2)(5)                                                                                                0.8                             —                              —
     Transition to the ongoing senior management team(2)(6)                                                                                       1.8                             —                              —
     Transition to a public company(2)(7)                                                                                                         4.2                             —                              —
     Tax impact of adjusting items(9)                                                                                                            (5.5)                        (12.3)                           (2.7)
     Adjusted net income                                                                                                        $                75.7           $              91.8            $             164.2

     Adjusted net income per diluted share                                                                                      $                0.91           $              1.06            $               1.87
     Weighted average common shares outstanding - diluted                                                                                        83.5                          86.3                            87.8

      1.  Beginning with the first quarter of Fiscal 2020, YETI revised its definitions of certain non-GAAP financial measures by eliminating various adjustments, specifically investments in new retail locations and
          international market expansion, transition to the ongoing senior management team, and transition to a public company. The Fiscal 2019 non GAAP financial results have been recast to conform to these
          revised definitions.
      2. These costs are reported in SG&A expenses.
      3. Includes $40.7 million of one-time non-cash stock-based compensation expense related to pre-IPO restricted stock units (“PRSUs”) that vested and were fully recognized during the fourth quarter of Fiscal
          2019.. The vesting of the PRSUs was triggered when Cortec, our majority stockholder at the time, ceased to own more than 35% of the voting power of our outstanding common stock following the closing of
          our November 2019 secondary offering.
      4. Represents retail store pre-opening expenses and costs for expansion into new international markets.
      5. Represents management service fees paid to Cortec, our majority stockholder at the time. The management services agreement with Cortec was terminated immediately following the completion of our initial
          public offering in October 2018.
      6. Represents severance, recruiting, and relocation costs related to the transition to our ongoing senior management team.
      7. Represents fees and expenses in connection with our transition to a public company, including consulting fees, recruiting fees, salaries, and travel costs related to members of our Board of Directors, fees
          associated with Sarbanes-Oxley Act compliance, incremental audit and legal fees associated with being a public company.
      8. Represents the accelerated amortization of deferred financing fees resulting from the voluntary prepayments of our term loan in Fiscal 2020 and the loss on modification and extinguishment related to the
          amendment of our credit facility in Fiscal 2019.
      9. Represents the tax impact of adjustments calculated at an expected statutory tax rate of 24.5%, 22.9%, and 23.3% for Fiscal 2020, Fiscal 2019, and Fiscal 2018, respectively. For Fiscal 2019, the tax impact of
          adjustments is net of a $0.9 million discrete income tax expense related to the recognition of $40.7 million one-time non-cash stock-based compensation expense associated with pre-IPO PRSUs that vested
          and were fully recognized during the fourth quarter of Fiscal 2019.
      10. Depreciation and amortization expenses are reported in SG&A expenses and cost of goods sold.

      Note: In millions, except per share amounts. Amounts may not recalculate due to rounding.

21
Q2 2020 Q2 2021
Selling, General, and Administrative $ 91.0 $ 136.7
Non-cash stock-based compensation expense(1) (2.2) (4.1)
Long-lived asset impairment(1) (0.6) (0.9)
Adjusted Selling, General, and Administrative $ 88.2 $ 131.7
Operating income $ 46.5 $ 72.4
Non-cash stock-based compensation expense(1) 2.2 4.1
Long-lived asset impairment(1) 0.6 0.9
Adjusted operating income $ 49.3 $ 77.4
Net income 33.5 56.2
Non-cash stock-based compensation expense(1) 2.2 4.1
Long-lived asset impairment(1) 0.6 0.9
Tax impact of adjusting items(2) (0.7) (1.2)
Adjusted net income $ 35.6 $ 60.0
Adjusted net income per diluted share $ 0.41 $ 0.68
Weighted average common shares outstanding - diluted 87.5 88.7
1. These costs are reported in SG&A expenses.
2. Represents the tax impact of adjustments calculated at an expected statutory tax rate of 24.5% for both the second quarter of Fiscal 2020 and Fiscal 2021.
Note: In millions, except per share amounts. Amounts may not recalculate due to rounding.
22You can also read