Africa's natural resources endowment positions it to be the next global economic engine - Mine Africa March 2021

Page created by Glen Hubbard
 
CONTINUE READING
Africa's natural resources endowment positions it to be the next global economic engine - Mine Africa March 2021
Africa’s natural resources endowment positions
it to be the next global economic engine…

Mine Africa March 2021
Africa's natural resources endowment positions it to be the next global economic engine - Mine Africa March 2021
Cautionary statement…
Certain information contained or incorporated by reference in this presentation, including any information as to our strategy, projects, plans or future financial or operating performance, constitutes “forward-looking statements”. All statements,
other than statements of historical fact, are forward-looking statements. The words “expect”, “target”, “plan”, “opportunities”, “pursuit”, “assume”, “project”, “continue”, “budget”, “estimate”, “potential”, “strategy”, “prospective”, “following”, “future”,
“aim”, “may”, “will”, “can”, “could”, “would” and similar expressions identify forward-looking statements. In particular, this presentation contains forward-looking statements including, without limitation, with respect to: Barrick’s strategic focus on
natural resources endowment positions in Africa and the potential for Africa to be the next global economic engine; potential mineralization and metal or mineral recoveries; our ability to identify, invest in and develop potential Tier One, Tier Two
and Strategic Assets; our strategies and plans with respect to environmental matters, including climate change; greenhouse gas emissions reduction targets; our future plans, growth potential, financial strength, investments and overall strategy,
including with respect to dispositions of non-core assets, and our participation in future consolidation of the gold industry; our ability to convert resources into reserves; our economic and social development priorities within our host communities,
including local hiring, procurement, training and community development initiatives; and expectations regarding future price assumptions, financial performance and other outlook or guidance.

Forward-looking statements are necessarily based upon a number of estimates and assumptions including material estimates and assumptions related to the factors set forth below that, while considered reasonable by the Company as at the
date of this presentation in light of management’s experience and perception of current conditions and expected developments, are inherently subject to significant business, economic and competitive uncertainties and contingencies. Known
and unknown factors could cause actual results to differ materially from those projected in the forward-looking statements and undue reliance should not be placed on such statements and information. Such factors include, but are not limited to:
fluctuations in the spot and forward price of gold, copper or certain other commodities (such as silver, diesel fuel, natural gas and electricity); the speculative nature of mineral exploration and development; changes in mineral production
performance, exploitation and exploration successes; diminishing quantities or grades of reserves; increased costs, delays, suspensions and technical challenges associated with the construction of capital projects; operating or technical
difficulties in connection with mining or development activities, including geotechnical challenges and disruptions in the maintenance or provision of required infrastructure and information technology systems; failure to comply with environmental
and health and safety laws and regulations; changes in national and local government legislation, taxation, controls or regulations and/or changes in the administration of laws, policies and practices; expropriation or nationalization of property
and political or economic developments in African jurisdictions in which the Company or its affiliates do or may carry on business in the future; lack of certainty with respect to foreign legal systems, corruption and other factors that are
inconsistent with the rule of law; risks associated with illegal and artisanal mining; risks associated with new diseases, epidemics and pandemics, including the effects and potential effects of the global Covid-19 pandemic; damage to the
Company’s reputation due to the actual or perceived occurrence of any number of events, including negative publicity with respect to the Company’s handling of environmental matters or dealings with community groups, whether true or not; the
possibility that future exploration results will not be consistent with the Company’s expectations; risks that exploration data may be incomplete and considerable additional work may be required to complete further evaluation, including but not
limited to drilling, engineering and socioeconomic studies and investment; risk of loss due to acts of war, terrorism, sabotage and civil disturbances; litigation; business opportunities that may be presented to, or pursued by, the Company; and
risks associated with working with partners in jointly controlled asset. In addition, there are risks and hazards associated with the business of mineral exploration, development and mining, including environmental hazards, industrial accidents,
unusual or unexpected formations, pressures, cave-ins, flooding and gold bullion, copper cathode or gold or copper concentrate losses (and the risk of inadequate insurance, or inability to obtain insurance, to cover these risks).

Many of these uncertainties and contingencies can affect our actual results and could cause actual results to differ materially from those expressed or implied in any forward-looking statements made by, or on behalf of, us. Readers are
cautioned that forward-looking statements are not guarantees of future performance. All of the forward-looking statements made in this presentation are qualified by these cautionary statements. Specific reference is made to the most recent
Form 40-F/Annual Information Form on file with the SEC and Canadian provincial securities regulatory authorities for a more detailed discussion of some of the factors underlying forward-looking statements and the risks that may affect Barrick’s
ability to achieve the expectations set forth in the forward-looking statements contained in this presentation. We disclaim any intention or obligation to update or revise any forward-looking statements whether as a result of new information, future
events or otherwise, except as required by applicable law.
Africa's natural resources endowment positions it to be the next global economic engine - Mine Africa March 2021
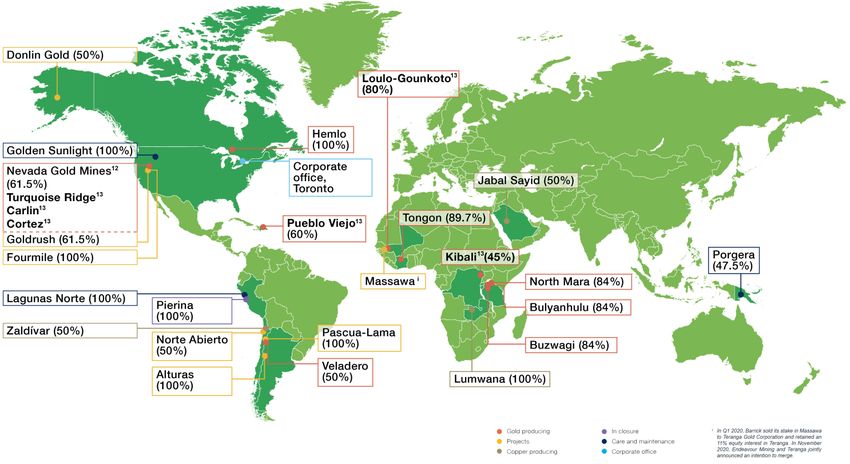
To be world class, we need to be global…

                                                          ii

i   In Q1 2020, Barrick sold its stake in Massawa to Teranga Gold (“Teranga”) and retained an 11% equity interest in Teranga. In February 2021, Endeavour Mining and Teranga merged.   ii   In Q1 2021, Barrick announced the sale of Lagunas Norte to Boroo Pte Ltd (Singapore).
Africa's natural resources endowment positions it to be the next global economic engine - Mine Africa March 2021
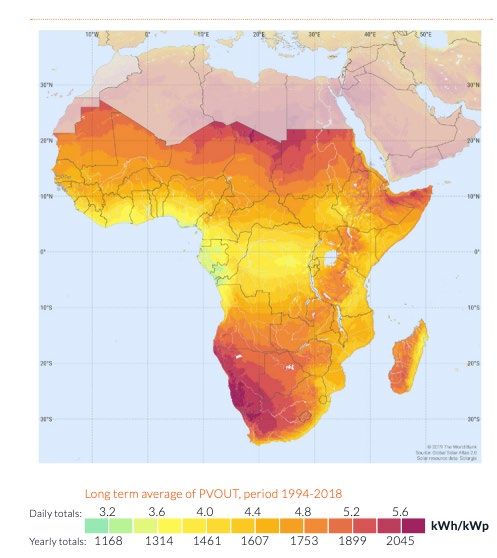
Africa’s Mineral Endowment…
        Africa is a massive contributor to the global mining industry, supplying over 25 million ounces of gold and 1.1 million tonnes of copper in
        2020 in addition to significant production of numerous other critical mineral commodities
  Map of Major African Natural Resource Production and Potential                                  Africa’s Critical Share of Mineral Production and Reserves

                                                                                                                                             2020e Production                     Reserves
                                                                            Aluminium / Bauxite

                                                                                                                           DRC
                    Petroleum                                               Cobalt
                                        Petroleum      Gold &                                             Cobalt           Other African             68%         3% 29%          51%        2%         47%
                                                      Petroleum
                                                                                                                           Other Countries
                                                                            Copper
      Gold &
     Iron Ore      Gold     Uranium
                                        Petroleum      Gold &                                                              South Africa
                                                      Petroleum
                                                                            Diamonds
                                                                                                        2E PGMs            Zimbabwe                50%     7%        43%               91%               2% 7%
                            Petroleum
                                                      Petroleum      Gold   Gold                                           Other Countries
            Gold                          Diamonds

                                                                  Gold      Graphite                                       South Africa
                                              Copper,
                                             Cobalt, &                                                  Chromium                               40%               60%        35%                   65%

                                             Diamonds                                                                      Other Countries
                                                              Gold          Iron Ore

                                                                                                                           South Africa
                                      Diamonds                              Petroleum
                                                    Copper                                                                 Gabon
                                                                                                        Manganese                            28%     15% 10%         47%    40%        5%          54%
                                                                                                                           Other African
                                   Diamonds                                 Phosphates
                                                                                                                           Other Countries
                                           Diamonds

                                                                            PGMs
                                                                                                                           Guinea
                                               Gold &
                                               PGMs                                                       Bauxite                            22%               78%         25%                   75%

                                                                            Uranium                                        Other Countries

Source: USGS, AME Group. S&P Global Intelligence                                                  Source: USGS
Africa's natural resources endowment positions it to be the next global economic engine - Mine Africa March 2021
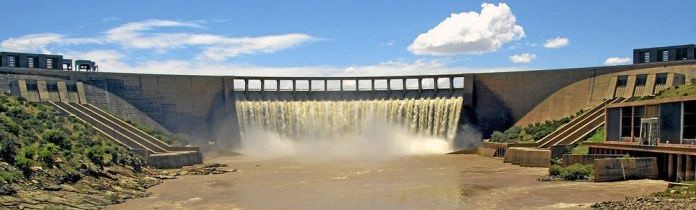
Africa is Underexplored and
Highly-Prospective…
Gold Reserves By Regioni                                                               Copper Reserves By Regioni                                                      Total 2020 Exploration Budget Allocationi
                           Contained Au (Moz)              Au Grade (g/t))                                   Contained Cu (Mt)             Cu Grade (%)

                                                                                                                                                                                        Europe, 6%
                                                                 1.26
                                                                               1.03
          0.88                                                                                              0.76%                               0.78%                                     Africa &
                            0.65                                                                                                                              0.60%
                                                                                            0.46%                                                                                       Middle East,
                                              0.26
                                                                                                                             0.30%                                                         13%
           589
                                                                                             379
                            356
                                              315                301
                                                                               191                            178                                                                      Latin America
                                                                                                                                                                                       & Caribbean,
                                                                                                                                 82               76
                                                                                                                                                               46                           25%

       Asia-Pacific    United States &   Latin America &    Africa & Middle   Europe    Latin America &   Asia-Pacific   United States &    Africa & Middle   Europe
                           Canada          Caribbean              East                    Caribbean                          Canada               East

Gold Resources By Regioni                                                              Copper Resources By Regioni                                                                     United States
                                                                                                                                                                                        & Canada,
                                                                                                                                                                                           27%
                                              1.61
                                                                                                                                                0.92%
          0.59              0.51                                               0.59
                                                                 0.27                       0.48%           0.55%
                                                                                                                                                              0.40%
                                                                                                                             0.31%
          2,107
                                                                                            1,439
                           1,407             1,366
                                                                 1,228
                                                                                                                                                                                        Asia-Pacific,
                                                                                                              674                                                                           30%
                                                                               529                                            357                253           199

       Asia-Pacific    United States &   Africa & Middle    Latin America &   Europe    Latin America &   Asia-Pacific   United States &    Africa & Middle   Europe
                           Canada              East           Caribbean                   Caribbean                          Canada               East

i   Russia is included within Asia-Pacific. Source: S&P Global Intelligence
Africa's natural resources endowment positions it to be the next global economic engine - Mine Africa March 2021
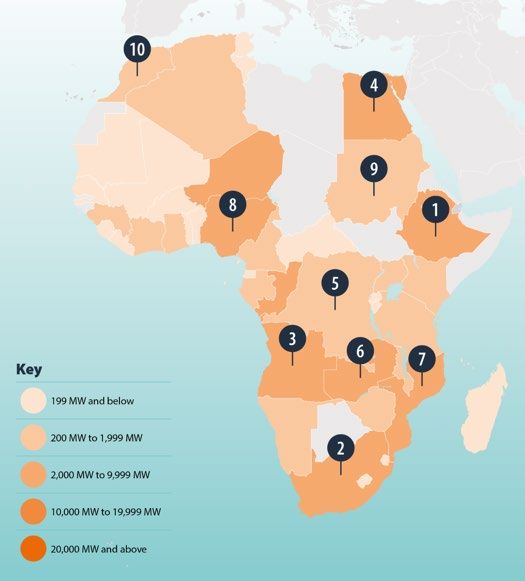
Mega gas fields…a prospect of stronger,
      cleaner energy supply
                                                 Oil
                                                 Natural Gas
                                                Resource rich

                                                Resource poor
                                                No recorded natural
                                                gas reserves

Source: PwC Africa Oil & Gas Review 2019
Africa's natural resources endowment positions it to be the next global economic engine - Mine Africa March 2021
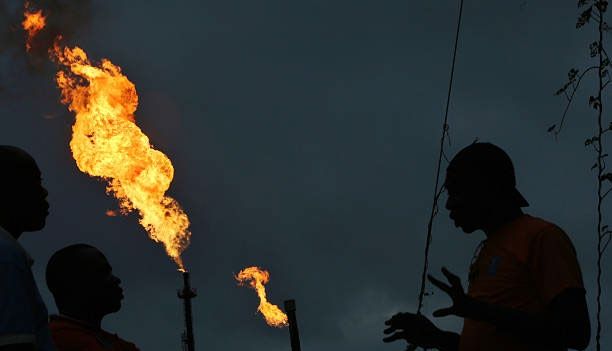
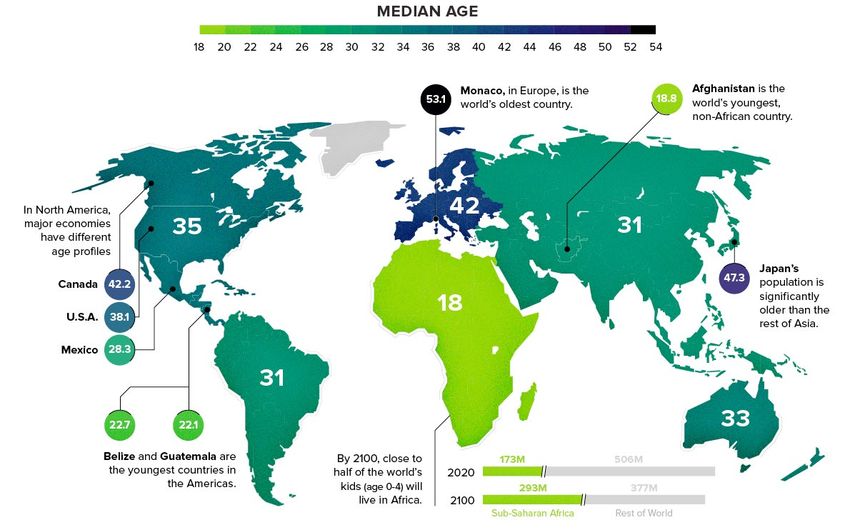
Africa has the world’s youngest population…

                                                                 Select Age Groups
                                                          45           by continent

                                                          40
                                                               Under 15 Years     Over 65 Years
                                                          35

                                                          30

                                                          25

                                                          20

                                                          15

                                                          10

                                                           5

                                                           0

Source: CIA World Factbook, Gates Notes, Statista, 2018
Africa's natural resources endowment positions it to be the next global economic engine - Mine Africa March 2021
Infrastructure Can Unlock the Full
Potential of Africa…
                                                                 Access to Key Infrastructure in Sub-Saharan Africa
Africa’s infrastructure severely lags behind the rest of the
                                                                                         Sub-Saharan Africa          North America           European Union
world, including in key areas such as energy,
communications, transportation, and water infrastructure                     Individuals using the Internet                            Electric power consumption
                                                                 100%
                                                                                   (% of population)                     16,000
                                                                                                                                             (kWh per capita)
According to the World Bank, Sub-Saharan Africa ranks at          90%                                          88%       14,000
                                                                                                               84%
the bottom of all developing regions in virtually all             80%
                                                                                                                         12,000
dimensions of infrastructure performance
                                                                  70%
                                                                  60%                                                    10,000

                                                                  50%                                                     8,000
Despite historical challenges, infrastructure investment in       40%                                                     6,000
Africa has been increasing steadily in recent years               30%
                                                                                                               25%        4,000
                                                                  20%
Closing the infrastructure gap with the rest of the world         10%                                                     2,000

presents a tremendous opportunity to unlock the full potential     0%                                                        0

of the African continent and its immense mineral endowment
                                                                        People using safely managed drinking                      Access to electricity (% of population)
DRC Case Study                                                   100%
                                                                          water services (% of population)
                                                                                                                         100%
                                                                  90%                                                     90%
                                                                  80%                                                     80%
Of 153,497km of roads, only                                       70%                                                     70%
2,794km are paved. There are                                      60%                                                     60%
around 4,000 km of railways but                                   50%                                                     50%                                               48%
much is narrow-gauge track and                                    40%                                                     40%

in poor condition. Waterways are                                  30%                                          27%        30%
                                                                  20%                                                     20%
vital to transport goods but                                      10%                                                     10%
journeys can take months to                                        0%                                                      0%
complete. Overcrowded boats
frequently capsize.
                                                                 Source: World Bank
Africa's natural resources endowment positions it to be the next global economic engine - Mine Africa March 2021
Potential to generate masses of
renewable energy…
                                                                                                         Africa’s solar power potential
Close correlation between energy consumption and economic
development, Africa’s population of more than 1.3 billion people renders   Only 48% of the
an immense and mounting need for reliable energy
                                                                           African population
DRC boasts the largest and most cost-effective hydropower potential on
the continent and could produce up to 100,000MW of power - the entire
                                                                           has access to
installed capacity of Sub-Saharan Africa is only 37,000MW and the DRC      electricity
has the potential to become Africa’s largest power exporter
Africa’s abundant clean energy resources, coupled with new investments
in renewable energy technologies, have spearheaded Africa into a clean
energy revolution - renewable energy is believed to constitute             Hydroelectric generation in
                                                                           Sub-Saharan Africa
approximately 50% of sub-Saharan Africa’s power generation
growth by 2040, consequently accelerating Africa’s novice economies

                                                                                                         In terms of generation,
                                                                                                         countries such as
                                                                                                         Mozambique, Zambia,
                                                                                                         Ethiopia, Egypt, the
                                                                                                         Democratic Republic of
                                                                                                         Congo and Angola
                                                                                                         generated more than 9TWh
                                                                                                         each in 2019
 Source: Africa Energy Indaba, Solutions for Africa
Africa's natural resources endowment positions it to be the next global economic engine - Mine Africa March 2021
What does Africa need to succeed?...
        Natural Resources…
        primary driver of economic activity                                                                                      Mining’s contribution to GDP and Exports
           Macro-level contributions of mining in low and middle income countries
                                                                                                                                                                          Metallic mineral, metals & coal
                                        Foreign Direct Investment                                                                                                                  Production value as % of GDP - 2018
                                                                                                           60–90%               100%
                                Mining FDI often dominates the total flow of FDI into low
                                                                                                           of total FDI
                                                                                                                                                                                   Export contribution - 2018
                                income economies that have limited other attractions for
                                                  international capital                                                           90%

                                                      Exports                                                                     80%
                                                                                                      30-40%
                               Mineral exports can often rise to be a major share of total            of total                    70%
                             exports in low income agrarian ecomomies even when starting
                                                    from a low base                                   exports
                                                                                                                                  60%
                                           Government Revenue                                   3-10%                             50%
                                 Mineral taxation has become a very significant source          of government
                                 of total tax revenues in many low income economies                                               40%
                                             with limited tax raising capacity                  revenues
                                                                                                                                  30%
                                     National Income (GDP & GNI)
                                            Modern day mineral processing                3-20%                                    20%
                                            technology is sophisticated and
                                             highly capital intensive – takes
                                                                                         of total
                                                                                                                                  10%
                                               place outside host country                national income
                                                  Employment                                                                       0%

                                                                                                                                         DRC

                                                                                                                                                                     Zimbabwe

                                                                                                                                                                                                                                                           Nozambique
                                                                                                                                                                                                                                                                        South Africa
                                                                                                                                               Zambia

                                                                                                                                                                                               Mali
                                                                                                                                                        Mauritania

                                                                                                                                                                                                               Liberia

                                                                                                                                                                                                                                                                                               Namibia

                                                                                                                                                                                                                                                                                                                                                                                         Morocco
                                                                                                                                                                                                                                                                                       Ghana

                                                                                                                                                                                                                                                                                                                     Tanzania

                                                                                                                                                                                                                                                                                                                                                   Côte d'Ivoire

                                                                                                                                                                                                                                                                                                                                                                                                   Gabon
                                                                                                                                                                                Burkina Faso

                                                                                                                                                                                                      Guinea

                                                                                                                                                                                                                         Botswana

                                                                                                                                                                                                                                                   Sudan

                                                                                                                                                                                                                                                                                                                                         Senegal
                                                                                                                                                                                                                                    Sierra Leone

                                                                                                                                                                                                                                                                                                         Congo Rep

                                                                                                                                                                                                                                                                                                                                Malawi

                                                                                                                                                                                                                                                                                                                                                                   Central African Rep
                                                   Mine employment
                                                     on its own is              1-2% of total
                                                     usually small              employment
                                                      relative to
                                                        national
                                                      workforce

Source: ICMM (various years) and OPM (various years)                                                                      Source: ICMM – Mining Contribution Index 5th Edition
Randgold – Barrick merger…
         bringing investment back to Africa

            Our focus on Tier 1 and strategic assets1                                                                                              Loulo-Gounkoto (80%)
            Loulo-Gounkoto in Mali –
                                                                                                                       $7.7 billion paid to                                                        Jabal Sayid (50%)
                  now developing third UG mine at Gounkoto                                                             State of Mali in the form of
            Kibali in DRC – the most automated underground                                                             taxes, royalties, salaries
            mine in the world                                                                                          and payments to local
                                                                                                                       suppliers                                                                              Kibali (45%)
            Tongon in Cote d’Ivoire – life of mine extended to
            2023                                                                                                                                Massawai
                                                                                                                                                                                                           North Mara (84%)
                                                                                                                                                                      Tongon (89.7%)
            North Mara and Bulyanhulu in Tanzania –                                                                                                                                                        Bulyanhulu (84%)
            potential to create another Tier 1 asset as a                                                               $1.62 Billion paid by                                                              Buzwagi (84%)
            combined complex                                                                                            Tongon in Cote d’Ivoire in                         Lumwana (100%)

            Tanzania…Barrick – Acacia buyout – Twiga JV                                                                 the form of taxes,                                                                $250 million
                                                                                                                        infrastructure, salaries and                                                      maiden dividend paid
            delivers 16% equity share to state                                                                          payments to local suppliers                                                       in Tanzania

      Barrick – Randgold merger supports consolidation
        Morila in Mali – sale enabled redeployment of assets                                                                                              Gold production
                                                                                                                                                                                            $3.4 billion paid by
                                                                                                                                                                                            Kibali to DRC in the form
        and infrastructure                                                                                                                                Projects                          of taxes, permits,
        Senegal…Sale of Massawa to Teranga and                                                                                                            Copper production                 infrastructure, salaries
        subsequent merger with Endeavour delivers a top 10                                                                                                                                  and payments to local
        producer                                                                                                                                                                            suppliers

i   In Q1 2020, Barrick sold its stake in Massawa to Teranga and retained an 11% equity interest in Teranga. In February 2021, Endeavour Mining and Teranga merged.
Our past, present and future is built on
partnerships and responsible mining …

  As a modern mining company, Barrick is
  committed to being a trusted long-term partner
  for our stakeholders in order to be sustainable -
  and to be sustainable, we have to be
  successful
                                                          Environmental
  Our employees, communities and host
  Governments are key stakeholders

  At Barrick, ESG factors are embedded in our
  sustainability vision, mission and principles. It
  helps us to make better decisions, to help de-      Social        Governance
  risk projects, discover new opportunities and
  deliver real value for our business

  Africa needs more responsible miners as real
  partners
Endnotes…
1.   A Tier One Gold Asset is an asset with a reserve potential to deliver a minimum 10-year life, annual production of at least 500,000 ounces of gold and total cash costs per ounce over the mine life that are in
     the lower half of the industry cost curve. A Strategic Asset is an asset which in the opinion of Barrick, has the potential to deliver significant unrealized value in the future.
You can also read