Cerro Blanco 2.0 - Good to Great Q2 2021 - Jack Lundin, President & CEO - Vision - A leading natural resource company driving stakeholder value ...
←
→
Page content transcription
If your browser does not render page correctly, please read the page content below
Cerro Blanco 2.0 – Good to Great
 Q2 2021 – Jack Lundin, President & CEO

Vision – A leading natural resource company driving stakeholder value
    through responsible, sustainable, and innovative development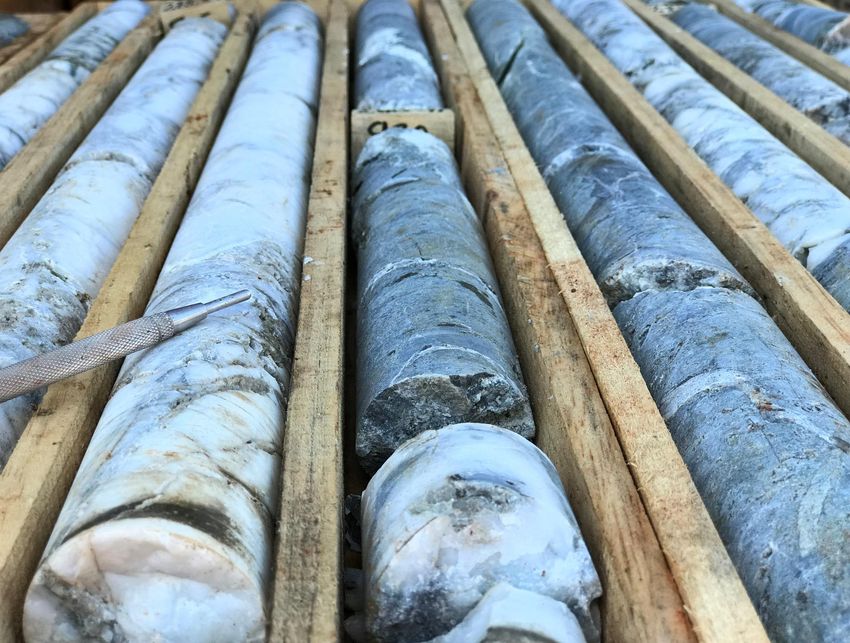
Forward Looking Statements & Risk Factors                                                                                                                                                  TSXV:BSR OTCQB:BBSRF | 2

This presentation contains “forward-looking information” within the meaning of Canadian securities legislation and “forward-looking statements” within the meaning of the United States Private Securities Litigation
Reform Act of 1995 (collectively, “forward-looking statements”). All statements, other than statements of historical fact, that address activities, events, or developments that Bluestone Resources Inc. (“Bluestone” or the
“Company”) believes, expects, or anticipates will or may occur in the future including, without limitation: the estimated value of the Cerro Blanco Project (the “Project”); the planned open pit development scenario for the
Project; the estimated gold production volume per year from the Project; gold and silver price estimates used in the preliminary economic assessment (“PEA”); additional financial estimates of Project economics
resulting from the PEA, including peak and average annual gold productions amounts, average all-in sustaining costs, average annual free cash flow, after-tax net present value (“NPV”), after-tax internal rate of return,
initial capital requirements, life of mine gold and silver production amounts, measured and indicated resources and NPV assuming a higher gold price estimate; the Company’s plan to advance an EIA application in
parallel to completing a bankable Feasibility Study by the end of 2021; the Company’s target to initiate Project development in the second half of 2022; anticipated receipt of an EIA permit in the second half of 2022;
mineral resource estimates; the estimated tonne-per-day recovery volume of the planned open pit operation; the planned conventional process plant and associated processing methods; the Company’s goal to prepare a
coordinated Environmental and Social Impact Assessment document that aligns with the IFC Performance Standards, Equator Principles as well as national requirements; engagement with local communities and
stakeholders to remain on-going through the process; the Company’s plan to advance the development of the EIA document in 2021 for submittal prior to the end of the year; the reasonable prospect of eventual
economic extraction demonstrated by reported mineral resources; gold and silver price estimates and a reasonable contingency factor used as the basis for mineral resource estimate cut-off grades; reasonable
expectation that the majority of Inferred Mineral Resources could be upgraded to Indicated Mineral Resources with continued exploration; results of mineral resource estimate sensitivity analysis; uncertainty that the
PEA will be realized; the potential for subsequent assessment of mining, environmental, processing, permitting, taxation, socio-economic and other factors to affect mineral resources; estimated diluted mill feed to be
processed over the life of mine from the main pit area; planned trucking of mill feed to a primary crushed located to the east of the main pit; amount of waste to be stored in a dump adjacent to the main pit; estimated
open-pit mining dilution; measured and indicated mill feed amounts; estimated process plant capacity in tonnes per day of ore; planned processing rate measured in dry tonnes per year and average feed grade thereof;
details of planned processing, including pre-oxidation, 48-hour leach and carbon-in-pulp absorption circuit elements and expected gold and silver recovery percentage to produce a dore; estimated initial capital required
to fund construction and commissioning; beneficial existence of a significant amount of development already in place, a water treatment plant, maintenance and warehouse facilities, offices and communications;
capital and operating cost estimates; estimated all-in cash costs including sustaining capex; planned installation of a new power transmission line as part of the construction of the Project; the Project’s expected
economic benefits to Guatemala. These forward-looking statements reflect the current expectations or beliefs of the Company based on information currently available to Bluestone and often use words such as
“expects”, “plans”, “anticipates”, “estimates”, “intends”, “may”, or variations thereof or the negative of any of these terms.

All forward-looking statements are made based on Bluestone’s current beliefs as well as various assumptions made by Bluestone and information currently available to Bluestone. Generally, these assumptions include,
among others: the presence of and continuity of metals at the Cerro Blanco Project at estimated grades; the availability of personnel, machinery, and equipment at estimated prices and within estimated delivery times;
currency exchange rates; metals sales prices and exchange rates assumed; appropriate discount rates applied to the cash flows in economic analyses; tax rates and royalty rates applicable to the proposed mining
operations; the availability of acceptable financing; the impact of the novel coronavirus (COVID-19); anticipated mining losses and dilution; success in realizing proposed operations; and anticipated timelines for
community consultations and the impact of those consultations on the regulatory approval process.

Forward-looking statements are subject to a number of risks and uncertainties that may cause the actual results of Bluestone to differ materially from those discussed in the forward-looking statements and, even if such
actual results are realized or substantially realized, there can be no assurance that they will have the expected consequences to, or effects on, Bluestone. Factors that could cause actual results or events to differ
materially from current expectations include, among other things: potential changes to the mining method and the current development strategy; risks and uncertainties related to expected production rates; timing and
amount of production and total costs of production; risks and uncertainties related to the ability to obtain, amend, or maintain necessary licenses, permits, or surface rights; risks associated with technical difficulties in
connection with mining development activities; risks and uncertainties related to the accuracy of mineral resource estimates and estimates of future production, future cash flow, total costs of production, and
diminishing quantities or grades of mineral resources; risks associated with geopolitical uncertainty and political and economic instability in Guatemala; risks related to global epidemics or pandemics and other health
crises, including the impact of the novel coronavirus (COVID-19); risks and uncertainties related to interruptions in production; the possibility that future exploration, development, or mining results will not be consistent
with Bluestone’s expectations; uncertain political and economic environments and relationships with local communities and governmental authorities; risks relating to variations in the mineral content within the mineral
identified as mineral resources from that predicted; variations in rates of recovery and extraction; developments in world metals markets; and risks related to fluctuations in currency exchange rates. For a further
discussion of risks relevant to Bluestone, see “Risk Factors” in the Company’s annual information form for the year ended December 31, 2019, available on the Company’s SEDAR profile at www.sedar.com.

Any forward-looking statement speaks only as of the date on which it was made, and except as may be required by applicable securities laws, Bluestone disclaims any intent or obligation to update any forward-looking
statement, whether as a result of new information, future events or results, or otherwise. Although Bluestone believes that the assumptions inherent in the forward-looking statements are reasonable, forward-looking
statements are not guarantees of future performance, and accordingly, undue reliance should not be put on such statements due to their inherent uncertainty. There can be no assurance that forward-looking
statements will prove to be accurate, and actual results and future events could differ materially from those anticipated in such statements.

Non-IFRS Financial Performance Measures: The Company has included certain non-International Financial Reporting Standards (“IFRS”) measures in this news release. The Company believes that these measures, in
addition to measures prepared in accordance with IFRS, provide investors an improved ability to evaluate the underlying performance of the Company and to compare it to information reported by other companies. The
non-IFRS measures are intended to provide additional information and should not be considered in isolation or as a substitute for measures of performance prepared in accordance with IFRS. These measures do not
have any standardized meaning prescribed under IFRS, and therefore may not be comparable to similar measures presented by other issuers.

All-in sustaining costs: The Company believes that all-in sustaining costs (“AISC”) more fully defines the total costs associated with producing gold.
The Company calculates AISC as the sum of refining costs, third party royalties, site operating costs, sustaining capital costs, and closure capital costs all divided by the gold ounces sold to arrive at a per ounce amount.
Other companies may calculate this measure differently as a result of differences in underlying principles and policies applied. Differences may also arise due to a different definition of sustaining versus non-sustaining
capital.

AISC reconciliation: AISC and costs are calculated based on the definitions published by the World Gold Council (“WGC”) (a market development organization for the gold industry comprised of and funded by 18 gold
mining companies from around the world). The WGC is not a regulatory organization.
Corporate Structure                                                                                                  TSXV:BSR OTCQB:BBSRF | 3

 Capital Structure – April 16, 2021                                                     Analyst Coverage (Avg. target price C$4.30)
  Listing                                            TSXV:BSR | OTCQB:BBSRF             C$4.75   Kevin MacKenzie
  Share Price                                        C$1.55
                                                                                        C$4.50   Nicolas Dion
  Shares Outstanding 150,141,816
                                                                                        C$4.50   Kerry Smith
  Options1                                           7,965,667
  Cash2                                              ~US$47 M                           C$3.50   Under Review

  Market Cap.                                        ~C$235 M
                                                                                        C$4.25   Phil Ker
  Major Shareholders

                                                                   CD Capital 11%
           Insitutions 35%

                                                                        Lundin Family
                                                                            27%

                             Retail                            Mgmt. 4%
                              21%            Newmont 2%

1. Options @ $1,25, $1.50, $1.70 and $1.90 (weighted avg. $1.50)
2. Estimated as of April 1, 2021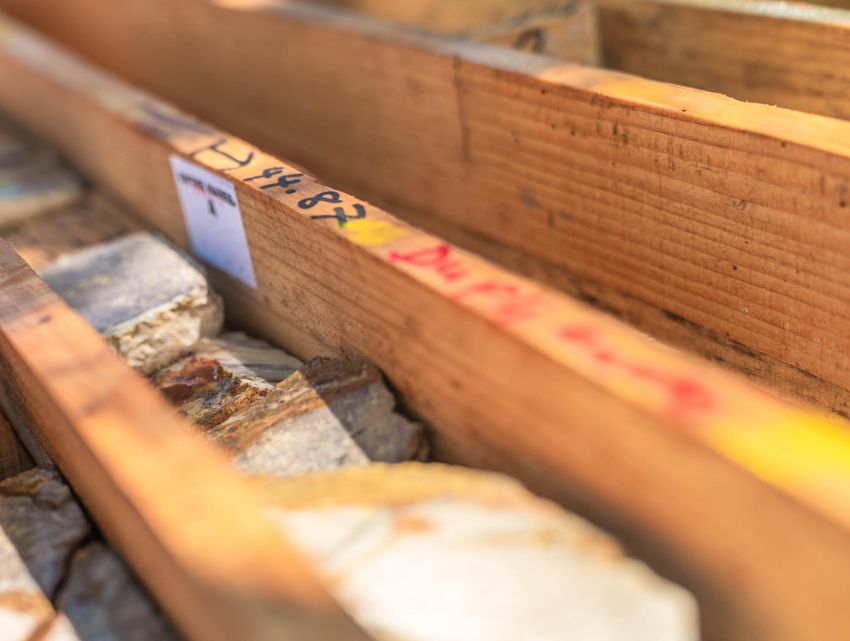
Cerro Blanco 2.0 – Maximizing Value                                         TSXV:BSR OTCQB:BBSRF | 4

Cerro Blanco has always been contemplated as an underground
development – until now
⚫ Goldcorp acquired Glamis in 2006 and permitted the project in
  2007 with 72,000 m drilling
⚫ Interpretation of the deposit has improved considerably with an
  additional 112,000 m of drilling

            17’ – Purchase                       20’ – Enhanced Team

                                                                       21’ – PEA Cerro
                                                                         Blanco 2.0

                             18’ – 21’ Geology                    21’ – New Opportunity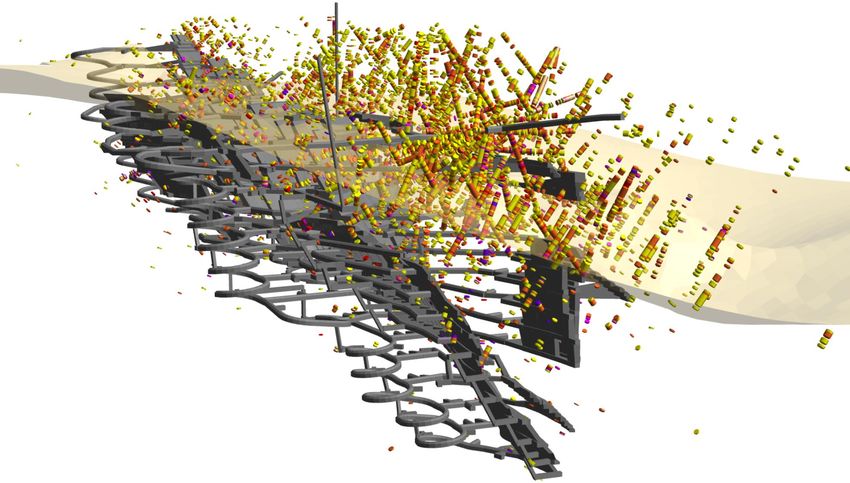
Cerro Blanco 2.0 – Good to Great                                                         TSXV:BSR OTCQB:BBSRF | 5

M&I resources increase to 3.0 Moz gold at a 0.4 g/t cut-off, with a high grade
vein component of 1.4 Moz at 10.3 g/t Au
⚫ Cone-shaped geometry of the deposit results in a very low strip ratio (2.4:1)

  − Upward flaring vein array
⚫ 48% of the resource (M&I) sits above the current underground infrastructure

⚫ Typical low grade mineralized envelope ranges from 0.3 g/t to 1.5 g/t Au

                                                                            Cross Section (looking North)

                                                              N
                                          Grades stacked overtop of each other
                                          to illustrate high-grade core
Our Commitment to Local Communities                               TSXV:BSR OTCQB:BBSRF | 6

Responsible Development – Bluestone believes in creating shared value and
prioritizes sustainable development to benefit local communities
⚫ Focused on building sustainable capacity and economic diversification through
  local training/employment and local procurement
  − Partnered with the Lundin Foundation to support these initiatives
Bluestone is committed to international social and environmental
sustainability standards
Cerro Blanco 2.0 – Good to Great                                                                       TSXV:BSR OTCQB:BBSRF | 7

 The PEA outlines a high-grade superior surface operation capable of producing
 +300 koz Au/yr at first quartile AISC

 Compared to the Underground (LOM)

       Resources (M&I)                                    Production (koz/yr)              Project NPV5%

               2x           more                                2x      more                   3x            Higher

                                                                               $1,000M                            $907M
                               3.0Moz 250koz                              231koz
                                                                                 $800M
                                         200koz
                                                                                 $600M
                                         150koz
        1.4Moz                                             112koz
                                         100koz                                  $400M       $300M

                                           50koz                                 $200M

                                         0koz                                        $0M
     Underground         Surface Operation              Underground   Suface Operation     Underground      Suface Operation

NPV of the underground as previously disclosed (press release
Jan 26, 2021) PEA economics at $1,550/oz and $20.00/oz Ag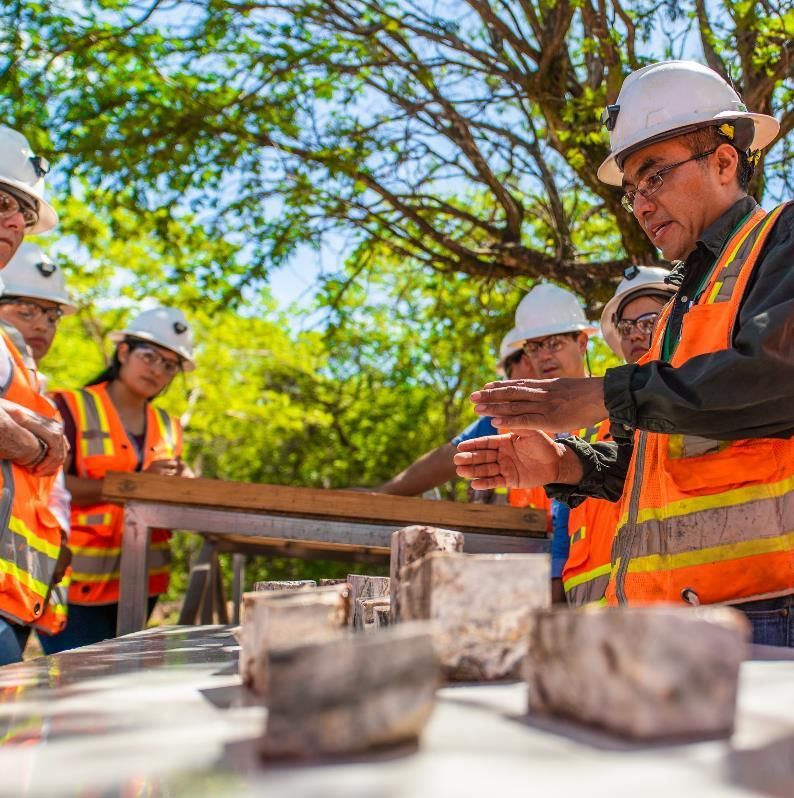
Robust High Margin Economics                                                                        TSXV:BSR OTCQB:BBSRF | 8

 LOM Avg. Annual Au Production                    Avg. Annual Free Cash Flow1        LOM Avg. AISC (net credits)

 231 koz/yr                                        $272 M/yr                         $642/oz
  Production Profile & Free Cash Flow                 Free Cash Flow2 ($M)
                                                      Annual Gold Production (koz)

AISC ($/oz)

1. Based on the first four years of production.
2. Unlevered basis at $1,550/oz Au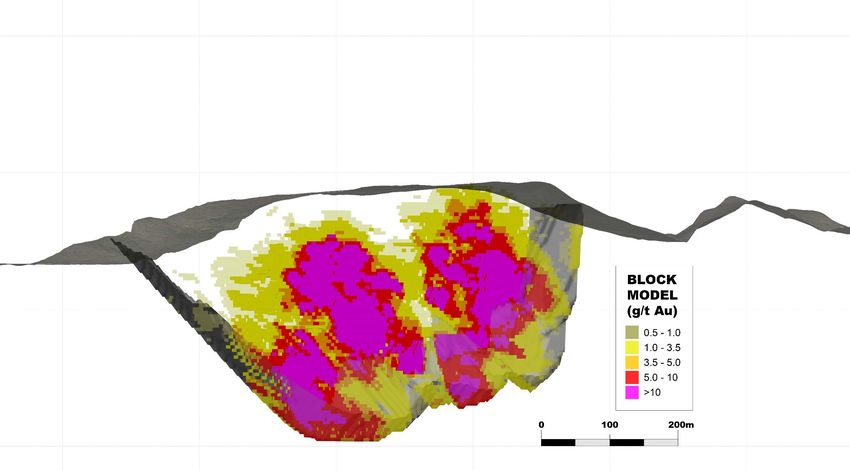
PEA Results                                                                        TSXV:BSR OTCQB:BBSRF | 9

 Revenue                                  Cumulative Free Cash Flow   Contribution to Economy

 $4.0B                                    $2.0B                       $1.8B
 Initial Capex                            Project NPV5%               Payback

 $548M                                    $907M                       2.6 years
 Head Grade – (peak years)                IRR                         Peak Production

 2.2 g/t Au                               28.5%                       334 koz/yr

Economics at $1,550/oz and $20.00/oz Ag
Cumulative free cash flow after tax
Competitively Positioned Amongst Peers                                                                           TSXV:BSR OTCQB:BBSRF | 10

                                                                                                                            10.0      10.0
                              Strip Ratio (w:o)
Head Grade (g/t Au)           Mill Grade (g/t Au)                                                                                     8.0
                                                                               7.6
                                                                                                                 7.2
                                                                                                                                      6.0

                                                                                                                                      4.0
                                                                  3.1                                                        6.0
  0.3      0.4       0.5       0.7                                                         2.5
                                                       2.3                                            2.4
                                           2.0                                                                                        2.0
                                                                                                                 3.2
   1.0     1.1                 0.9
                     0.8                                                       1.4         1.4        1.6
                                           0.8         0.8        0.8
                                                                                                                                      -
 Corvus   Integra    Rio2      Orla      Artemis     Orezone      Gold       Marathon    Midas      Bluestone   Skeena     Sabina
                                                                Standard

                                                    Mkt. Cap (C$M)
LOM Avg. Au Production (koz/yr)                     LOM Avg. Au Production
                                                                                                                                     $1,200
          $1,164

                                                                                                                                     $1,000

                                                                              $800                   $822                            $800
                                                                                                                           $712
                                                                 $615                                                                $600

                                                                                                                $450
                              $374                                                                                                   $400
                                          $345        $313
   85
                                                                                         $235
                    $241
                                                                                                                                     $200
  $153
            94       103       112        115          118        145          223        231         236        301        324
                                                                                                                                     $0
  Rio2     Orla     Integra   Corvus      Gold       Orezone   Marathon       Sabina    Bluestone   Skeena      Midas      Artemis
                                        Standard
Next Steps TSXV:BSR OTCQB:BBSRF | 11
⚫ Continue Local Stakeholder Engagement and Program Development
⚫ Continue drilling to support an updated resource estimate in Q4 2021
⚫ Feasibility Study and submit a new EIA in Q4 2021 – Q1 2022
⚫ Project Finance package in 2022
⚫ Commence early works in late 2022
2021 2022
Feasibility Study
Permitting/Approvals
Project Finance
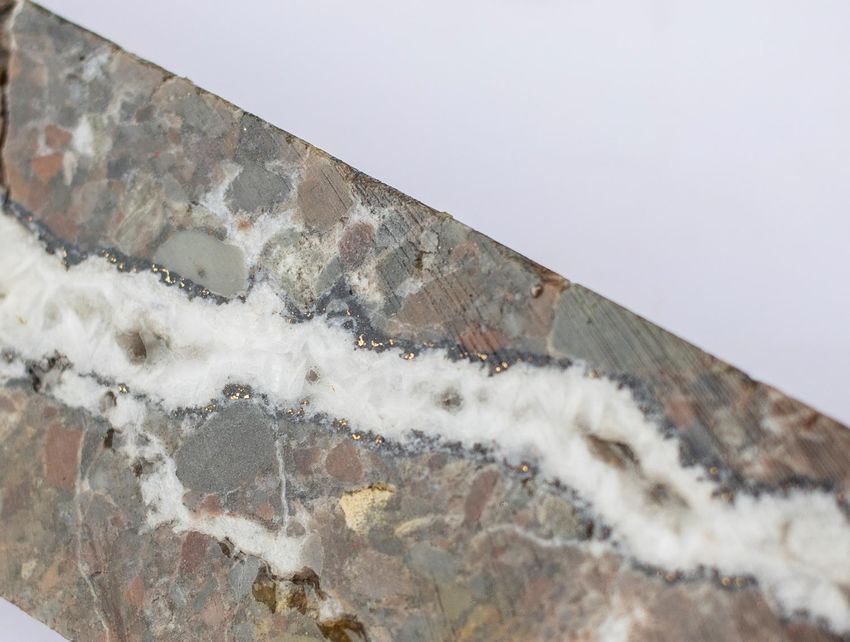
Early WorksCerro Blanco – 1,380 g/t Au and 2,194 g/t Ag over 1.2 meters
Thank You
Contact:
Stephen Williams, P.Eng., MBA
VP Corporate Development & Investor Relations
Email: stephen.williams@bluestoneresources.ca
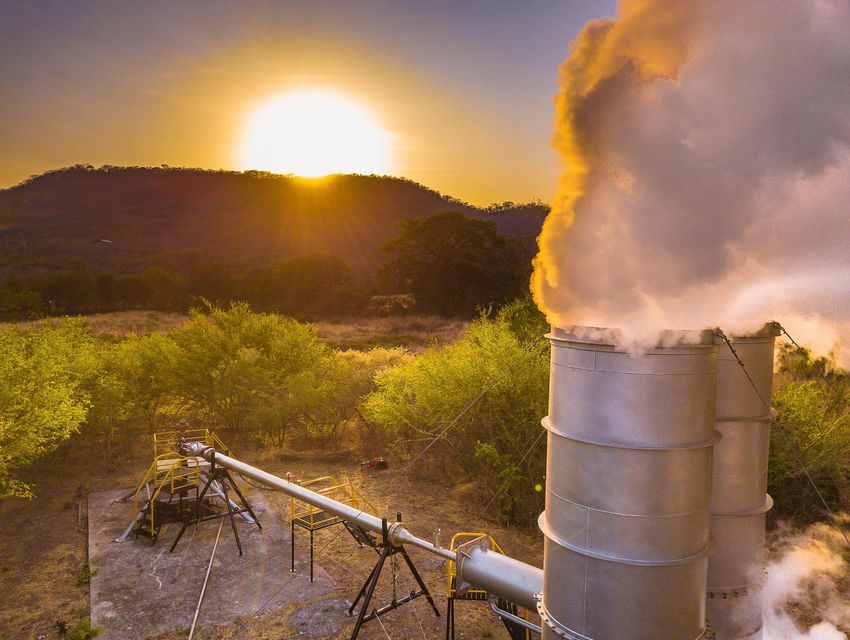
Phone: +1 (604) 757-5559Mita Geothermal TSXV:BSR OTCQB:BBSRF | 13
Economic geothermal resource located east of the Cerro Blanco Gold
project
⚫ Reviewing technical information to evaluate current geothermal reserve in
preparation for 2021 power call
⚫ 50-year license to build and operate a 50 MW geothermal plant granted
⚫ Staged approach - Phase 1 smaller operation that could supplement power
requirements to the mine or be sold into the privatized national grid
⚫ Further studies underway
Mita Geothermal flow testing programPEA Summary TSXV:BSR OTCQB:BBSRF | 14 Simple design with conventional processing leveraging off of the engineering work completed in the last two years will help to fast track the Feasibility Study Operating Summary Operating and Capital Cost Summary Initial Mine Life 11 years Mining Cost ($/t mined) $2.95/t Total Material Mined 175.7 Mt Processing Cost ($/t milled) $13.30/t Ore Processed 52.2 Mt Site Services Cost ($/t milled) $3.98/t Strip Ratio 2.4 w:o G&A Costs ($/t milled) $2.28/t Mill Average Daily Production 15,000 tpd Total Cost ($/t milled) $28.78/t Mill Average Annual Production 5.04 Mt LOM Avg. Cash Costs (net credits) $570/oz Au Average Mill Grade 1.6 g/t Au | 7.3 g/t Ag LOM Avg. AISC (net credits) $642/oz Au Gold Recovery 91% Initial Capex US$548M Silver Recovery 85% Contingency US$76M Gold Recovered 2.4 Moz Sustaining Capex US$173M Silver Recovered 10.4 Moz Peak Gold Production 334 koz/yr Avg. Gold Production Years 1 - 4 277 koz/yr LOM Avg. Gold Production 231 koz/yr Avg. Silver Production Years 1 - 4 1.5 Moz/yr All numbers in US dollars unless otherwise stated
Capital Cost Estimate Breakdown                                            TSXV:BSR OTCQB:BBSRF | 15

The capital cost estimate leveraged off of the basic engineering work
completed in 2020
                                          Initial Capital Sustaining
                                               ($M)       Capital ($M) LOM ($M)
      Infrastructure                          $18.2          -        $18.2
      Power & Electrical                      $37.9          -        $37.9
      Water Management                        $40.2        $56.3      $96.5
      Surface Operations                      $31.9        $19.8      $51.7
      Mining                                  $48.7        $61.8      $110.5
      Process Plant                          $153.8          -        $153.8
      Construction Indirects                  $70.0          -        $70.0
      Owner's Costs                           $46.6          -        $46.6
      Pre-Prod, Start-up, Commissioning       $55.3          -        $55.3
      Contingency                             $76.5          -        $76.5
      Closure                                   -          $35.0      $35.0
      Pre-Prod Revenue                        $31.3          -        $31.3
      Total                                 $547.8        $172.9      $720.7
Leverage to Gold Price TSXV:BSR OTCQB:BBSRF | 16
After-tax NPV5% at various different gold prices
$2,000 $1,633M
$1,800 $1,305M
Gold Price ($/oz)
$1,600 $987M
$1,550 $907M
$1,400 $669M
$0M $200M $400M $600M $800M $1,000M $1,200M $1,400M $1,600M $1,800M
After-tax NPV5%Resource Summary TSXV:BSR OTCQB:BBSRF | 17
Cerro Blanco mineral resource statement, effective December 31, 2021:
Grade Resource
0.5 g/t Au Cut-Off Tonnes Gold Silver Gold Silver
(000s t) (g/t) (g/t) (Moz) (Moz)
Measured 20,388 1.93 9.01 1,266 5,906
Indicated 41,135 1.30 5.54 1,716 7,327
M&I Total 61,523 1.51 6.69 2,982 13,233
Inferred 2,287 0.56 3.41 42 251
Notes on Resource Estimate:
(1) Effective date: December 31, 2020. All mineral resources have been estimated in accordance with Canadian Institute of Mining and Metallurgy and Petroleum (“CIM”)
definitions, as required under NI 43-101.
(2) Cut-off grades are based on a price of US$1,600/oz gold, US$20/oz silver and a number of operating cost and recovery assumptions, including a reasonable contingency
factor.
(3) The PEA is preliminary in nature, it includes inferred mineral resources that are considered too speculative geologically to have the economic considerations applied to them
that would enable them to be categorized as mineral reserves, and there is no certainty that the PEA will be realized. Mineral resources that are not mineral reserves do not
have demonstrated economic viability. The mineral resources may be affected by subsequent assessment of mining, environmental, processing, permitting, taxation, socio-
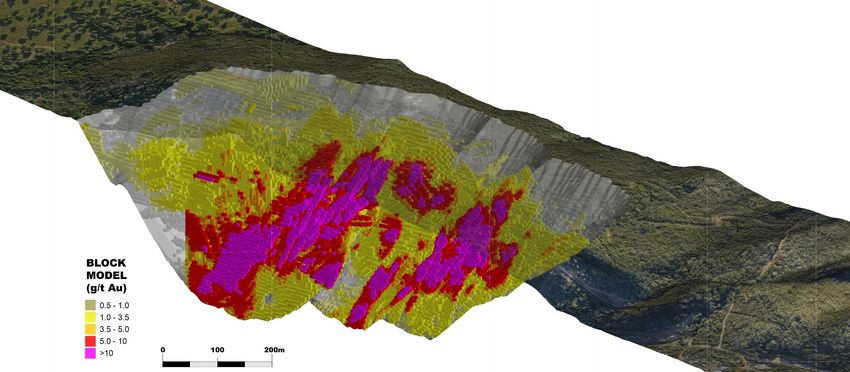
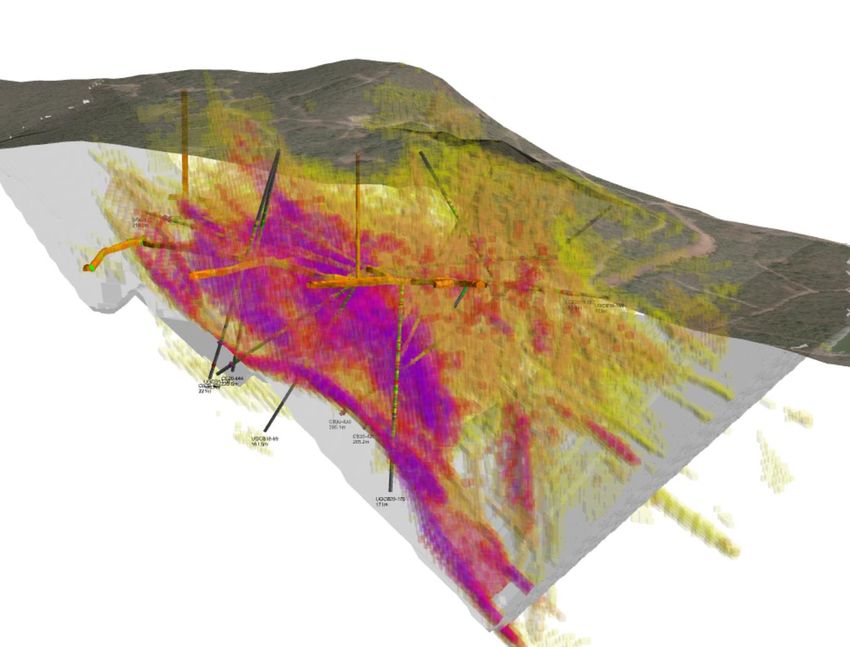
economic and other factors.High-Grade Vein Component TSXV:BSR OTCQB:BBSRF | 18 Average grades mined in the first couple years average ~2.2 g/t Au supporting a production profile of +300 koz/yr ⚫ Longitudinal section through the deposit looking west ⚫ Purple is +10 g/t Au Slice of the deposit N Grades stacked overtop of each other to illustrate high-grade component
High-Grade Vein Component
 Underground stopes/high-grade mineralization with the proposed pit shell and
 mineralized drill intercepts captured by an open pit scenario

                                       Current Surface              South Zone 3D Section
                                                                     Looking North East

West Pit
 Wall

   Drill Intercepts g/t Au
           0.5 - 1 g/t Au
           1 - 3.5 g/t Au
           3.5 – 5 g/t Au
           5 – 10 g/t Au
           >10 g/t Au

                                                                             BASE OF SALINAS UNIT
                                                           South Pit Wall

                                                                                SOUTH ZONE
  PRU Ramp and
  Vein/Stope Plan
South Zone Drill Section TSXV:BSR OTCQB:BBSRF | 20
S S’ Hole
CB002
Interval Au g/t
112.8 1.5
Ag g/t
23.0
From
19.8
To
132.6
111.8m / 2.1 g/t Au, 12.5 g/t Ag 119.2m / 3.8 g/t Au, 19 g/t Ag (UGCB20-179) UGCB12-52 208.0 3.0 18.9 0.0 208.0
(CB20-444)
112.8m / 1.5 g/t Au, 23 g/t Ag (CB002) UGCB12-67 166.7 4.2 26.1 35.7 202.4
166.7m / 4.2 g/t Au, 26.1 g/t Ag
CB20-420 203.8 2.3 4.1 0.0 203.8
(UGCB12-67) 203.8m / 2.3 g/t Au, 4.1 g/t Ag (CB20-420)
CB20-425 215.8 1.5 5.2 0.0 215.8
208m / 3.0 g/t Au, 18.9 g/t Ag 182.9m / 1.1 g/t Au, 8.2 g/t Ag (CB19-159) CB20-430 213.6 2.0 4.9 80.2 293.8
(UGCB12-52)
213.6m / 2.0 g/t Au, 4.9 g/t Ag (CB20-430) CB20-438 76.0 2.2 6.8 63.5 139.5
CB20-444 111.8 2.1 12.5 54.6 166.3
UGCB20-176 153.4 3.1 7.4 0.0 153.4
183.8m / 1.9 g/t Au, 17.2 g/t Ag (UGCB20-157)
UGCB20-179 119.2 3.8 19.0 0.0 119.2
UGCB20-191 101.4 2.4 9.6 24.8 126.2
UGCB18-86 120.7 4.6 19.9 23.5 144.2
UGCB18-89 87.2 5.3 25.6 20.4 107.6
UGCB19-157 183.8 1.9 17.2 0.0 183.8
UGCB19-160 181.1 1.0 6.8 0.0 181.1
UGCB19-159 182.9 1.1 8.2 0.0 182.9
NORTH ZONE
120.7m / 4.6 g/t Au, 19.6 g/t Ag
S
(UGCB18-86) CB20-176
87.2m / 5.2 g/t Au, 25.6 g/t Ag
(UGCB18-89)
SOUTH ZONE
153.4m /3.1 g/t Au, 7.4 g/t S’
(UGCB20-176)North Zone Drill Section TSXV:BSR OTCQB:BBSRF | 21
59.6m / 2.7 g/t Au, 26.9 g/t Ag (UGCB19-121)
207m / 1.8 g/t Au. 6.5 g/t Ag (CB357)
49.2m / 3.6 g/t Au, 41.5 g/t Ag (UGCB19-124)
121.9m / 0.6 g/t Au, 6.7 g/t Au (CB003)
83.5m / 6.9 g/t Au, 12.5 g/t Ag (UGCB19-144)
97.6m / 4.1 g/t Au, 11.2 g/t Ag (UGCB12-66)
Base of Salinas Cap
N NORTH ZONE
N’
Hole Interval Au g/t Ag g/t From To
CB003 121.9 0.6 6.7 32.0 153.9
CB357 207.0 1.8 6.5 0.0 207.0
UGCB19-121 59.6 2.7 26.9 75.4 135.0 SOUTH ZONE
UGCB19-124 49.2 3.6 41.5 76.6 125.8
UGCB19-144 83.5 6.9 12.5 88.6 172.1
UGCB12-66 97.6 4.1 11.2 21.5 119.1You can also read