CORPORATE PRESENTATION - CLEANEST & KINDEST HYDROCARBONS BEST & SMARTEST OIL & GAS FINDERS - GEOPARK
←
→
Page content transcription
If your browser does not render page correctly, please read the page content below
Cleanest & Kindest
                           Hydrocarbons
Best & Smartest                                   Safest, Lowest Cost &
Oil & Gas Finders                                 Most Efficient Operator

                      Consistent Free Cash Flow
                          & Value Delivery

                    Corporate Presentation
                    September 2021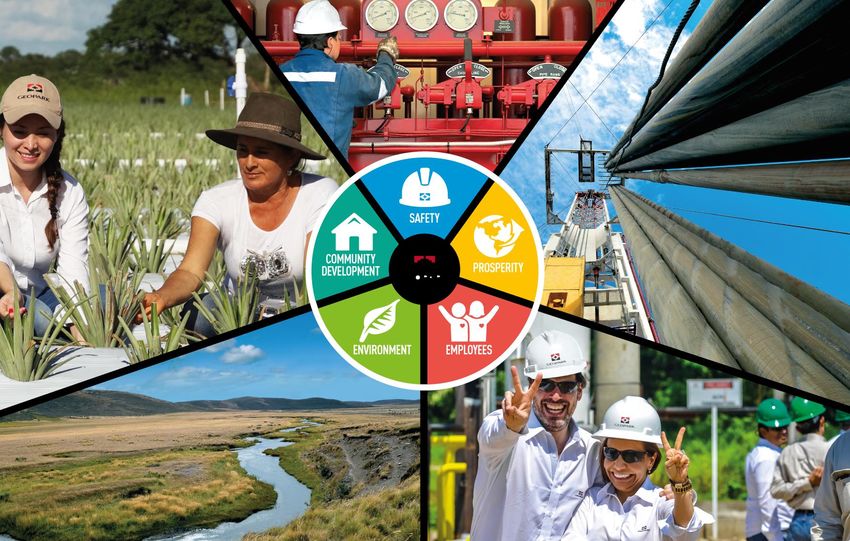
Long-Term Value Proposition
                                                                                                                                                                     42,000
            Proven Track Record 2009-2020
            Oil and Gas Production: CAGR 18%
            Oil and Gas Reserves: CAGR 14%
                                                                           COLOMBIA                                                                                  37,000

                                                                            ECUADOR
            Leading Oil and Gas Finders
            Drilling Success Rate* 75+% (2006 – 2020)
                                                                                                                                                                     32,000

                                                                                                            BRAZIL
            Low-Cost Operator
            Operating and Structure Costs
                                                                                                                                                                     27,000
            Per Barrel Below Peers

                                                                                                                                                                              Net Average Daily Production
            Focus on ESG                                                                                                                                             22,000
            Leading Low Carbon Intensity in Llanos 34
%           25-30% Below Industry Average                                                ARGENTINA

                                                                                                                                                                                        (boepd)
            Majority Independent Directors

                                                                                 CHILE                                                                               17,000

            Total Shareholder Return                                                                                      ONLY PUBLIC
                                                                                                                          ONLY PUBLIC
                                                                                                                         INDEPENDENT
            371% Over the Past 5 Years**                                                                                 INDEPENDENT
                                                                                                                      POSITIONED ACROSS
                                                                                                                      POSITIONED ACROSS
                                                                                                                        LATIN AMERICA -
                                                                                                                        LATIN AMERICA -                              12,000
                                                                                                                           THE MOST
                                                                                                                           THE MOST
                                                                                                                       ATTRACTIVE OIL &
                                                                                                                       ATTRACTIVE OIL &
                                                                                                                       GAS INVESTMENT
            Partnering with Neighbors                                                                                  GAS INVESTMENT
                                                                                                                         REGION TODAY
                                                                                                                         REGION TODAY
            Working together aligns
            interests and provides                                                                                                                                   7,000
                                                                                                                                                 .
            operational continuity

                                                                                                                                                                     2,000

                   2006       2007        2008       2009   2010   2011   2012     2013     2014     2015      2016    2017    2018       2019        2020
                                                                                                                                                     2020E   2021E

                                                                                             Historical Production                                                   -3,000
*GeoPark   operated wells. **Capital IQ as of 17-Jun-21.                                                                                                                                       2
18 Year Track Record and Value Delivery
                                                    RIGOROUS RISK MANAGEMENT = CONSISTENT VALUE CREATION

 PRODUCTION (MBOEPD)                                                                 RESERVES (2P, MMBOE)

                                                                                                                                                                   197
                                                                          40    40                           CAGR 14%
                        CAGR 18%                                                                                                                           184
                                                                   36                                                                                                      175
                                                                                                                                                   159
                                                                                                                                           143
                                                            28
                                                                                                                         122      125
                                                     22
                                      20     20

                               14                                                                                 70
                       11                                                                                  57
                                                                                             50     50
         7       8                                                                    42
  6

2009    2010   2011   2012   2013    2014    2015   2016   2017   2018   2019 2020   2009    2010   2011   2012   2013   2014     2015    2016     2017    2018    2019    2020
                                       Gas          Oil                                                                     Oil     Gas

 NET PRESENT VALUE* ($BN)                                                            FREE OPERATING CASH FLOW ($MM)

                                                                         2.8                                                                                        237
                                                                  2.7
                  CAGR 20%                                                     2.5                          CAGR 41% (2015-2020)                            206
                                                           2.3

                                                    1.9
                                     1.7                                                                                                                                    142
                                            1.6
                             1.3
        0.9           1.0                                                                                                                            70
               0.9
                                                                                                                                             39
 0.3                                                                                                                                25

2009 2010 2011 2012 2013 2014 2015 2016 2017 2018 2019 2020                           2009   2010   2011   2012   2013    2014     2015     2016    2017    2018    2019    2020
                                                                                       -23    -17                          -18
                                    2P NPV 10 ($Bn)                                                  -35
                                                                                                                   -48                    Adjusted EBITDA Minus CAPEX
                                                                                                            -77

* 2P DeGolyer & MacNaughton (D&M) December 2020.                                                                                                                                   3
Best & Smartest Oil
& Gas Finders
Asset Base                                                                                                       Proven Oil & Gas Finder

D&M CERTIFIED 2P RESERVES AND NPV10 2020                                                                     LEADING OIL AND GAS FINDING TEAM IN LATIN AMERICA

      175 MMBOE                                   $2.5 BN

             6                                       0.04                                                    •   Over 25+ year track record (800+ mmboe discovered to date)
             3                                       0.03                       Argentina
             25                                      0.3                                                     •   Growth strategy targets low cost, low risk, high potential
                                                                                Brazil                           exploration projects and producing assets with upside
                                                                                                                 potential in proven basins
                                                                                Chile                        •   Continuously investing in attracting the best people and
             141                                     2.1
                                                                                                                 acquiring the best tools and know-how
                                                                                Colombia

       2P RESERVES                                NPV10
          (MMBOE)                            (AFTER TAX). ($BN)

GEOPARK OIL AND GAS FINDING METRICS

 2P GROSS MMBOE                           ORGANIC                                    DRILLING SUCCESS RATE                2P FINDING AND                   2P RESERVE LIFE INDEX
   DISCOVERED                  2P RESERVE REPLACEMENT RATIO                                 2006-2020                  DEVELOPMENT CAPEX*                         (2020)
     (2006-2020)                         (2015-2020)                                      (280+ WELLS)                      (2015-2020)

                                                   R3                                                                              $

      >440                                       193%                                       75+%                             $4.5 /boe                         11.9     years

*Total capital expenditures divided by 2P Reserves added (based on D&M 2015-2020).                                                                                                 5
Asset Base Ongoing Portfolio Construction
COLOMBIA
• Second largest operator in 33,228 boepd*
Colombia
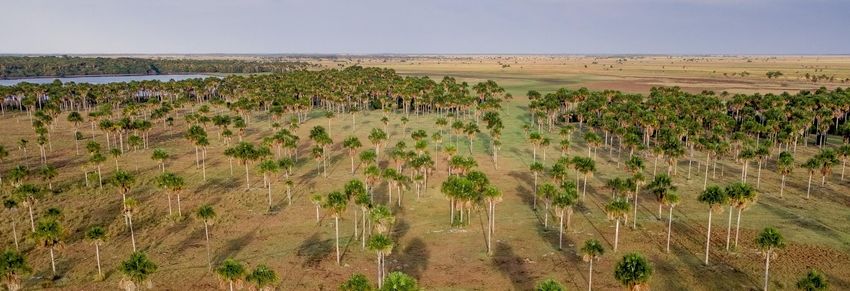
LLANOS 34
• Key Assets: Llanos 34, CPO-5 141 mmboe
(Llanos basin) 2P Net Reserves**
• 1.4+ mm strategic acreage
added in 2019 around Llanos 34 23 Blocks
LLANOS BASIN (19 Operated)
• RLI: 1P 7.8 years; 2P 11.6 3.7 mm gross acres
years; 3P 17.8 years
CPO-5
PUTUMAYO BASIN
COLOMBIA
PLATANILLO
ECUADOR CHILE + ARGENTINA + BRAZIL
• Low-risk exploration areas between • Experience in exploring and developing
Ecuador’s best producing oil fields mature areas 6,964 boepd*
Exploratory Assets
• Excellent infrastructure, spare • Core technical team with strong track
capacity 33 k gross acres record 34 mmboe
2P Net Reserves**
• Ongoing divestments underway in
Argentina and Brazil, expected to close
2 Exploratory Blocks 18 Blocks
by year-end 2021 (13 Operated)
(1 Operated)
3.0 mm gross acres
* 2020 production. ** 2020 D&M certified 2P Reserves. 6
Asset Base Llanos 34 Cash Flow Engine
Oil fields (3P D&M 2020)
Chachalaca Field Max Field
PANAMA Chiricoca Field
VENEZUELA Structural high
Tilo Field
LLA-34
COLOMBIA
LLANOS 34 BLOCK: GEOPARK
ECUADOR BRAZIL
Guaco Field OPERATED WITH 45% WI
Tigana Field
PERU Tarotaro Field • Largest discovery in 20+ years in Colombia
• Introduced new geological play-type
• Drilled more than 100 profitable wells
Tua Field
• Grew production from zero to 75,000 bopd
since 2012
• 13 new fields discovered with 3P gross
Aruco Field reserves of 300+ mmbbl
Curucucú Field
Jacana Field • Core production with $14-15 per
bbl** breakevens
Jacamar Field • 2P Reserve Life Index of 10.6 years
Tigui Field 5 km
NET RESERVES AND PRODUCTION GROWTH IN LLANOS 34
2P RESERVES* (MMBBL) PRODUCTION (BOEPD) LLANOS 34 WELL ECONOMICS
27,751
108
GeoPark GeoPark Cost per Well $3.5 mm
Acquisition Acquisition
EUR/Well ~2 mmbbl
65 14,890 IP Rate 1,000-1,700 bopd
IRR*** 500+%
Payback*** 4-6 Months
Zero Reserves Zero Production Development Drilling
50-70 Gross Wells
Locations
2012 2016 2020 2012 2016 2020
* 2P D&M 2020. ** Vasconia oil Price. *** $40-45/Brent. 7
Asset Base                                                           Llanos Basin Growth Fairway
PANAMA
           VENEZUELA
                           SYSTEMATIC CONSOLIDATION OF HIGH POTENTIAL ACREAGE AROUND CORE ASSET
     COLOMBIA

                                                                                     GeoPark producing blocks         NEAR TERM CATALYSTS
                                                                                     GeoPark producing oil fields
ECUADOR        BRAZIL                                                                Other producing oil fields
     PERU
                                         LLANOS 87
                                                                                     GeoPark exploration blocks
                  LLANOS 124
                                                                        LLANOS 32

                                                                LLANOS 34                                                            5-10
          LLANOS 123
                                                                                                                          High-impact exploration
                                                                                                                          targets to be drilled over
                                                       Tigana
                                                                                                                          the next 12 – 18 months
                                                 Jacana

                          Mariposa
                                                                                      LLANOS 104
                                Indico

                                         CPO-5
                                                                   LLANOS 86

                                                                                                                                0.6-1.3
   LLANOS 94                                                                                                                  billion bbl
                                                                                                         10 km
                                                                                                                             of gross recoverable
                                                                                                                             exploration resources
                                                                                                                            (230–480 mmboe net)*
                        2018                       2019                 2020
                                                                                     Strategic acres
                                                                                    added since 2019
                                                                                                                    * GeoPark’s aggregate Mean-P10 unrisked
                      0.2                        0.9                 +1.4                                           volumes in leads and prospects individually
                million acres              million acres        million acres                                       audited by Gaffney & Cline as of December
                                                                                                                    31, 2020.

                                                                                                                                                              8
Asset Base                                                                                                                                        CPO-5 Big Prize

                                         PRODUCTION & RESERVE GROWTH SINCE ACQUISITION UNDERSCORE PROJECT POTENTIAL

                               GROSS PRODUCTION (BOPD)                                                                                      GROSS RESERVES (MMBBL)

                                                                       13,142
                                                                                                                                                                                      167
                                                                                                                                                                      +236%

                                             +62%
                                 8,116
                                                                                                                                    +123%

                                                                                                                                                                         71
                                                                                                                                                 50
                                                                                                                                  32

                           December 2019                          December 2020                                                      July 2019                           2020 Year-end
                                                                                                                              2P Certified Gross Reserves           3P Certified Gross Reserves

              GROWTH OPPORTUNITIES                                                RECENT & UPCOMING ACTIVITY                                                INDICO-2 WELL ECONOMICS

•    Two discovered oil fields with breakevens of                     •   Indico 1 well producing 5,100 bopd, no water cut,
                                                                                                                                                        Cost per Well                     ~$8.0 mm
     ~$6-7 /bbl*                                                          +3 million bbl cumulative production in 2 years
•    Light oil, 36-41º API                                            •   Indico 2 well tested 5,500 bopd, 35° API, 161
                                                                                                                                                        EUR/Well                          5-6 mmbbl
                                                                          feet net pay in the Ubaque formation, currently
•    Mid to low-risk exploration prospects                                producing 6,200+ bopd
•    400-900 mmbbl gross recoverable exploration                      •   Completed 3D seismic acquisition to unlock                                    IP Rate                           5,500 bopd
     resources (120-270 mmbbl net)**                                      additional leads and prospects
                                                                      •   5-6 gross wells to be drilled between 2H2021                                  IRR***                            500+%
                                                                          and 1H2022

                                                                                                                                                        Payback***                        2-3 months

* Vasconia oil Price.   ** GeoPark’s aggregate Mean-P10 unrisked volumes in leads and prospects, individually audited by Gaffney & Cline as of December 31, 2020.         *** $40-45/Brent.
                                                                                                                                                                                                       9
Safest, Lowest Cost &
Most Efficient Operator
Capabilities & Efficiencies                                                                                 Low-Cost Operator

OPERATING COSTS DOWN BY 60%                                        90% OF PRODUCTION IS CASH                   STRUCTURE COSTS DOWN BY 45%
                                                                   FLOW POSITIVE AT $20-$30 BRENT
OPEX ($/boe)                                                       Breakeven ($/boe)                           G&A/G&G Costs ($/boe)

 16
                                  60%
                                Decrease                                     Oil ($40-50 /bbl)      100%                            45%
                                                                                                                                  Decrease
              11

                                           8                                                                   9
                                                8                            Oil ($20-30 /bbl)                        7
                           7     7
                                                        7                                            90%
                                                                                                                              6                      6
                                                                                                                                        5     5             5

                                                                                   Gas
                                                                             (Unaffected by          15%
                                                                                oil price)

2014         2015        2016   2017   2018    2019    2020                                                   2014   2015    2016    2017    2018   2019   2020

GEOPARK OPERATOR METRICS

          GROSS OPERATED                             OPERATED PRODUCTION                         OPEX/BOE                   DRILLING & COMPLETION
         PRODUCTION (BOEPD)                         AS PERCENTAGE OF TOTAL                         2020                      COST* PER WELL ($MM)
               2020                                   NET PRODUCTION 2020
                                                                                            GeoPark
                                                               %                          Consolidated      $7.0            GeoPark
                                                                                                                            Llanos 34
                                                                                                                                             $6.6
                                                                                                                               2012

              ~70,000                                         89%                             GeoPark
                                                                                              Colombia      $5.4
                                                                                                                            GeoPark
                                                                                                                            Llanos 34        $3.5
                                                                                                                               2020

 *For   2 casing well design.                                                                                                                                     11
Capabilities & Efficiencies High Margins Even at Low Oil Prices
COST EFFICIENCIES INCREASE ADJUSTED EBITDA MARGINS
Adjusted EBITDA ($mm) Adjusted EBITDA Margin
58%
55% 55%
53%
363
41%
331
35%
218
176
74 78
2015 2016 2017 2018 2019 2020
Brent
($/bbl) 54 45 55 72 64 45
Source: Bloomberg
LOW COST TO DEVELOP AND PRODUCE DISCOVERED RESERVES
Future Development CAPEX* ($/boe) – D&M 2020
2.1 2.2
1.9
1.7
1P Reserves 2P Reserves
GeoPark Colombia GeoPark Consolidated
*Future Capital Expenditures/1P and 2P Reserves (D&M 2020) 12Consistent Free Cash Flow & Value Delivery
Resilient Cash Flow                                                                 Superior Returns on Capital Invested

CASH GENERATION 2-3X CAPEX IN EVERY OIL PRICE ENVIRONMENT
                                                                                                                                                 3x+
Operating Netback and Capital Expenditures (CAPEX) ($mm)                                                              3x+
                                                                                                                                           447
                                                                                                                398

                                                                                    2x+                                                                                3x+
                                                                                                                                                               276
                                                                              228
                     2x+                           3x+

              118                            122                                                                             125                        126
                                                                                            106
                                                                                                                                                                             75
                            49                             39

                    2015                           2016                             2017                              2018                       2019                2020
                                                                                           Operating Netback            CAPEX

   Brent
   ($/bbl)
                      54                           45                                55                                72                         64                  45

 Source: Bloomberg

COST & CAPITAL EFFICIENCY LEAD TO SIGNIFICANT RETURNS
Recycle Ratio (Operating Netback / Finding & Development* (F&D) CAPEX)                                                 7x+                        7x+

                                                                                                               31.9                       32.5
                                                                                     5x+
                                                                             23.9                                                                                     4x+
                     3x+                            3x+                                                                                                       19.9
             16.9                           15.9

                           4.5                            4.5                              4.5                               4.5                        4.5                 4.5

                    2015                           2016                             2017                              2018                       2019                2020

                                                                   Operating Netback ($ /boe)             Average 2P F&D (2015-2020) ($ /boe)

   *F&D is calculated as CAPEX divided by reserves added in 2015-2020 and does not include acquisitions
                                                                                                                                                                                  14
Resilient Cash Flow Self-funded & Flexible Work Program
CAPITAL ALLOCATION DISCIPLINE ACCOMMODATES OIL PRICE VOLATILITY DISCIPLINED CAPITAL ALLOCATION METHODOLOGY
• Self-Funded work program
$40-45 /bbl $60-65 /bbl
• Allocating capital to most value-adding projects based on four criteria:
- OIL PRICE (BRENT) + - Technical upside - Economic return
40,000-42,000 38,000-40,000 - Strategic value - Environmental & social Impact
PRODUCTION boepd boepd
PROVEN FLEXIBILITY
CAPEX $100-120 MM $125-140 MM
• Work program designed to accommodate oil price volatility
JULY 2021
BUDGET REVISION 350 100 120
Brent
($/bbl)
300 72
64
54 55 60-65 70
250 45 45
$40-45 MM $125-140 MM 200
20
$85-95 MM 150
238
100
$60-70 MM CAPEX -30
125 126 125-140
MAINTENANCE 50
($MM) 106
49 75
39
DEVELOPMENT EXPLORATION CAPEX 2021
0 -80
2014 2015 2016 2017 2018 2019 2020 2021
2021 WORK PROGRAM HIGHLIGHTS
OPERATING CAPITAL GROSS EXPLORATION 3D SEISMIC
NETBACK* EFFICIENCY WELLS CAPEX ACQUISITION
$340-390 2x+ 37-42 30-35% 400 km 2
MILLION Operating netback to 5-6 gross wells, Production not
development CAPEX ratio included in 2021 guidance
* Assuming $60-65 Brent prices and $3-4 /bbl Vasconia differential for 2021. 15Resilient Cash Flow High Return Barrels
2021E OPERATING NETBACKS ($/BOE)
Brent $60-65/bbl - Gas $3-4/mcf*
60
55
(6) (5)
(3) (2)
(2)
(9) 37 (8)
(8) (7) (7)
(7)
(7) (5) (8)
(12)
27 25
13
Colombia Brazil-Argentina-Chile Consolidated
Vasconia Differential Transportation & Commercial Discounts
Selling/Royalties OPEX Op. Netback Realized Hedge Losses
POSITIONED TO GENERATE SIGNIFICANT FREE CASH FLOW
2021E Free Cash Flow** ($mm)
(85-95)
(40-45)
340-390 (55-60)
(60-65)
90-125
*
*$60-65/bbl Brent price and $3-4/bbl Vasconia differential for 2021. **Excluding working capital changes, debt service and other payments.
16Resilient Cash Flow Strong Balance Sheet
LOWER DEBT, LOWER COST &
IMPROVED DEBT PROFILE
Debt Amortization Profile ($mm)*
Before Current
Before and After Strategic 500
Deleveraging (April 2021)
425
350
170
2021 2022 2023 2024 2025 2026 2027
* Does not include an amortizing debt of $3.5 mm with Santander Brazil and a loan agreement of $9.4 mm with Bancolombia.
CONSERVATIVE USE OF DEBT TO GROW THE BUSINESS RESERVE LIFE EXCEEDING DEBT MATURITY
Gross & Net Leverage (Gross and Net Debt / Adjusted EBITDA) Reserve Life Index (Years) – 2020
Long-term Objective: Covenant:
Net LeverageResilient Cash Flow Downside Oil Price Protection
HEDGES IN PLACE SECURE BASE OIL PRICE* HEDGING STRATEGY
Brent • First line of defense: low-cost operator with low breakevens
3Q2021 4Q2021 1Q2022 2Q2022 3Q2022
$/BBL
• Provide oil price stability consistent with base budget assumptions
Weighted
• Secure price floor while retaining exposure to the upside
Average 61.7 62.7 74.8 77.3 80.0
Cap • No upfront or premium cost instrument
Weighted • Continuous monitoring of the market to capture best windows
Average 43.3 43.7 49.1 50.6 52.0
Floor
Total
TENOR VOLUME STRUCTURE
Hedged 20,000 19,500 14,500 8,000 1,000
(bopd)
* As of August 6, 2021.
2016 - 2019 2020-2021E 2022E - Onwards ZCC
UP TO 12 30-50% OF OIL
(BRENT &
MONTHS OUT PRODUCTION
VASCONIA)
30-50% 50-75% 30-50%
Production Hedged Production Hedged Production Hedged
18Opportunity 2021 Provides Unique Entry Point
SHAREHOLDER RETURN TRACK RECORD (2016 – 2021)
BEST PERFORMING E&P STOCK TOTAL SHARE QUARTERLY
*
(NYSE 2017-2019) SHAREHOLDER BUYBACK CASH
+415% +365% RETURN 2019-2021 DIVIDEND
June 2021
+40% 371% $78 MM $2.5 MM
+40%
June 2016
($3.1/share) COMPREHENSIVE & FLEXIBLE
VALUE RETURN STRATEGY
* Considering E&P stocks with Market Cap above $150 million.
SHARE VALUES AT 1P, 2P AND 3P NAV
BASED ON D&M 2020 $51/share
$31/share
$17/share
Current
Share Price
1P NAV/Share Probable Reserves
19Cleanest & Kindest Hydrocarbons
Sustainability                                                                 SPEED = ESG+
                             FOUNDING PRINCIPLES SINCE DAY ONE IN 2002

 STRONG                                             ZERO                                                  371%
                                       VEHICLE ACCIDENTS IN 10 MM KM*                     TOTAL SHAREHOLDER RETURNS
 COMMUNITY SUPPORT                                                                                 5 YEARS**
                             *April to Dec. 2020.                             **Capital IQ as of 17-Jun-21.

                ZERO                                                             100%
                 SANCTIONS                                              EMPLOYEES ARE SHAREHOLDERS
                                                                                                                      21
Environment Leading the Way to the Energy Transition
LEADING LOW CARBON INTENSITY IN LLANOS 34
ENVIRONMENT (kg CO2e/boe)
25
GHG Intensity (KgCO2e/boe) 20
Carbon Intensity Well Below 25-30% BELOW
15 INDUSTRY AVERAGE*
Industry
10
Another 20-30% Carbon
Reduction Plan is Being
5
Executed within next 1-2 years
0
Ecopetrol Petrobras Frontera Llanos 34 Equinor Aker BP Lundin
GeoPark
Source: Individual company reports
*Global industry average is based on the “International Association of Oil & Gas Producers: Environmental Performance Data 2019”
2015-2019 2022E
3% 20-30%
Execution on Corporate Decarbonization Strategy
Reduction in Reduction in
TARGET Colombia Llanos 34
Diesel to gas Electrification + Solar 22
22Social Neighbor of Choice
SAFETY COMMUNITY DEVELOPMENT
1.08 bbls of Oil Spilled for Every Million Barrels $3.9 million
Produced Investments in Social
Programs
First Oil & Gas Company to Receive
COVID-19 Bureau Veritas Certification for COVID
Preparedness and Response Social and Environmental Best Practices
RESPONSE
Received 2x in 2020 32,984
Neighbors Benefitted from
GeoPark Social Programs
TRIR 2.86 1.25 1.84
376
LTIR 1.14 0.42 0.61 Meetings Listening to
Community Concerns
2017 2018 2019
0.40 LTIR 1.70 TRIR Sustainable Development
Goals
Lost Time Total Recordable
TARGETS Incident Rate Incident Rate
Source: GeoPark 2017, 2018 and 2019 ESG Report 23Governance Best Governance Practices
GOVERNANCE
STRONG OVERSIGHT MAJORITY OF INDEPENDENT DIRECTORS
Majority Independent Directors in SYLVIA
2021 ESCOVAR GÓMEZ
Independent Chair JAMES F.
PARK
Co-founder CEO &
Independent and Female Chair Director
Appointment ROBERT A.
BEDINGFIELD
Independent Director
PEDRO E.
Risk Committee Chaired by AYLWIN
Independent Director Director
CONSTANTINE
PAPADIMITRIOU
100% Independent Nomination & Independent Director
Corporate Governance, Audit and CARLOS A.
GULISANO
Compensation Committees SOMIT
Director
VARMA
Strengthened Committee Charters Independent Director
2021 Strong Shareholder Engagement
AGM RESULTS 84% Voted 70-97% Support
Source: GeoPark 2019 ESG Report 24Company Directory
Executive Team James F. Park
Chief Executive Officer
Augusto Zubillaga
Chief Operating Officer
Andrés Ocampo
CONTACTS Chief Financial Officer
Shareholder Stacy Steimel
Bogotá, Colombia Value Team Shareholder Value Director
Calle 94 Nº11-30. Piso 8,
Phone: +(57 1) 734 2337 Miguel Bello
Email: ir@geo-park.com Market Access Director
Diego Gully
Investor Relations Director
Silvia Angulo
Shareholder Value
Best CEO
Best CFO
Best IR Team
Best IR Professional
Best ESG Metrics
25Disclaimer
The information contained herein has been prepared by GeoPark Limited (“GeoPark“, “we” or “us”) solely The information included in this presentation regarding GeoPark’s estimated quantities of proved,
for informational purposes. No representation or warranty, either expressed or implied, is provided in probable and possible reserves in Chile, Colombia, Brazil, Argentina and Ecuador as of December 31,
relation to the accuracy, completeness or reliability of the information contained herein and nothing shall 2020; is derived, in part, from the reports prepared by DeGolyer and MacNaughton, or D&M, independent
be relied upon as a promise or representation as to performance of any investment or otherwise. The reserves engineers. Certified reserves refers to net reserves independently evaluated by the petroleum
information in this presentation is current only as of the date on its cover. For any time after the cover consulting firm, D&M. The reserves estimates in the reports prepared by D&M were prepared in
date of this presentation, the information, including information concerning our business, financial accordance with the definitions and guidelines set forth in the 2007 Petroleum Resource Management
condition, results of operations and prospects may have changed. The delivery of this presentation shall System Methodology (the “PRMS”) approved by the Society of Petroleum Engineers, the World
not, under any circumstances, create any implication that there have been no changes in our affairs after Petroleum Council, the American Association of Petroleum Geologists and the Society of Petroleum
the date of the Preliminary Offering Memorandum (as defined below) or the date of this presentation. Evaluation Engineers. PRMS proved (1P) reserves are estimated quantities of oil, condensate and
natural gas from which there is geological and engineering data that demonstrate with reasonable
This presentation does not constitute an offer to sell or the solicitation of an offer to buy any securities certainty that they are recoverable in future years from known reservoirs under existing economic and
and may not be relied upon in evaluating the merits of any investment. The notes have not been operating conditions. PRMS probable reserves (2P) are those additional reserves which analysis of
registered under the Securities Act of 1933, as amended (the "Securities Act"), or any applicable state geoscience and engineering data indicate are less likely to be recovered than proved reserves but more
securities laws. The notes are being offered only to (a) qualified institutional buyers under Rule 144A certain to be recovered than possible reserves. PRMS possible reserves (3P) are those additional
under the Securities Act and (b) to persons outside of the United States in compliance with Regulation S reserves that analysis of geoscience and engineering data indicates are less likely to be recoverable than
under the Securities Act pursuant to GeoPark’s confidential Preliminary Offering Memorandum (the probable reserves.
“Preliminary Offering Memorandum”).
The accuracy of any resource estimate is a function of the quality of the available data and of engineering
This presentation includes forward-looking statements. Forward-looking statements can be identified by and geological interpretation. Results of drilling, testing and production that postdate the preparation of
the use of forward-looking words such as “anticipate”, “believe”, “could”, “expect”, “should”, “plan”, the estimates may justify revisions, some or all of which may be material. Accordingly, resource
“intend”, “will”, “estimate” and “potential,” among others. Forward-looking statements appear in a number estimates are often different from the quantities of oil and gas that are ultimately recovered, and the
of places in this presentation and include, but are not limited to, statements regarding our intent, belief or timing and cost of those volumes that are recovered may vary from that assumed.
current expectations. Forward-looking statements are based on our management’s beliefs and
assumptions and on information currently available to our management. Such statements are subject to Reserves estimates prepared in accordance with SEC rules and regulations may differ significantly from
risks and uncertainties, and actual results may differ materially from those expressed or implied in the reserves estimates prepared in accordance with PRMS guidelines. Therefore, the 1P reserves estimates
forward-looking statements due to various factors, including, but not limited to, those identified in the presented in this presentation may differ significantly from the 1P reserves estimates presented in our
“Forward-Looking Statements” and “Risk Factors” sections of the Preliminary Offering Memorandum for annual report for the year ended December 31, 2020.
further information. Forward-looking statements speak only as of the date they are made, and GeoPark
does not undertake any obligation to update them in light of new information or future developments or to
release publicly any revisions to these statements in order to reflect later events or circumstances or to
reflect the occurrence of unanticipated events.
Statements related to resources are deemed forward-looking statements as they involve the implied
assessment, based on certain estimates and assumptions, that the resources will be discovered and can
be profitably produced in the future. Specifically, forward-looking information contained herein regarding
"resources" may include: estimated volumes and value of the Company's oil and gas resources and the
ability to finance future development; and the conversion of a portion of resources into reserves.
26Come on Board Short, Medium & Long Term Investment Opportunity
PEOPLE
MEXICO
+
TRACK-RECORD
COLOMBIA
+
ECUADOR
UPSIDE
PERU BRAZIL
+
VALUE
+
ARGENTINA
SELF-FUNDING
+
PLATFORM
27You can also read