BMO Capital Markets Global Metals & Mining Conference 25-27 February 2013, Florida USA
←
→
Page content transcription
If your browser does not render page correctly, please read the page content below
BMO Capital Markets
Global Metals & Mining Conference
25-27 February 2013, Florida USA

Greg Robinson
Managing Director and Chief Executive Officer
Disclaimer
Forward Looking Statements
These materials include forward looking statements. Often, but not always, forward looking statements can generally be identified by the use of forward looking words such as “may”, “will”,
“expect”, “intend”, “plan”, “estimate”, “anticipate”, “continue”, and “guidance”, or other similar words and may include, without limitation, statements regarding plans, strategies and objectives of
management, anticipated production or construction commencement dates and expected costs or production outputs.
Forward looking statements inherently involve known and unknown risks, uncertainties and other factors that may cause the company’s actual results, performance and achievements to differ
materially from any future results, performance or achievements. Relevant factors may include, but are not limited to, changes in commodity prices, foreign exchange fluctuations and general
economic conditions, increased costs and demand for production inputs, the speculative nature of exploration and project development, including the risks of obtaining necessary licenses and
permits and diminishing quantities or grades of reserves, political and social risks, changes to the regulatory framework within which the company operates or may in the future operate,
environmental conditions including extreme weather conditions, recruitment and retention of personnel, industrial relations issues and litigation.
Forward looking statements are based on the company and its management’s good faith assumptions relating to the financial, market, regulatory and other relevant environments that will exist
and affect the company’s business and operations in the future. The company does not give any assurance that the assumptions on which forward looking statements are based will prove to be
correct, or that the company’s business or operations will not be affected in any material manner by these or other factors not foreseen or foreseeable by the company or management or beyond
the company’s control.
Although the company attempts and has attempted to identify factors that would cause actual actions, events or results to differ materially from those disclosed in forward looking statements,
there may be other factors that could cause actual results, performance, achievements or events not to be as anticipated, estimated or intended, and many events are beyond the reasonable
control of the company. Accordingly, readers are cautioned not to place undue reliance on forward looking statements. Forward looking statements in these materials speak only at the date of
issue. Subject to any continuing obligations under applicable law or any relevant stock exchange listing rules, in providing this information the company does not undertake any obligation to
publicly update or revise any of the forward looking statements or to advise of any change in events, conditions or circumstances on which any such statement is based.
Ore Reserves and Mineral Resources Reporting Requirements
As an Australian company with securities listed on the Australian Securities Exchange (“ASX”), Newcrest is subject to Australian disclosure requirements and standards, including the
requirements of the Corporations Act and the ASX. Investors should note that it is a requirement of the ASX listing rules that the reporting of ore reserves and mineral resources in Australia
comply with the 2004 Edition of the Australasian Code for Reporting of Exploration Results, Mineral Resources and Ore Reserves (the “JORC Code”) and that Newcrest’s ore reserve and mineral
resource estimates comply with the JORC Code. As a company listed on the Toronto Stock Exchange (“TSX”), Newcrest is subject to certain Canadian disclosure requirements and standards,
including the requirements of National Instrument 43-101 - Standards of Disclosure for Mineral Projects of the Canadian Securities Administrators (“NI 43-101”). In accordance with NI 43-101,
Newcrest reports its ore reserves and mineral resources estimates in compliance with the JORC Code, along with a reconciliation to the material differences between the JORC Code and the
applicable definitions adopted by the Canadian Institute of Mining, Metallurgy and Petroleum (CIM Definition Standards). In relation to the December 2012 Resources and Reserves Statement,
the reconciliation is set out in Newcrest’s Canadian News Release dated 8 February 2013, and is available at www.sedar.com and at Newcrest’s website www.newcrest.com.au. Except as
otherwise noted in that document, there are no material differences between the definitions of Measured, Indicated and Inferred Mineral Resources, and Proven and Probable Reserves, under the
CIM Definition Standards and the equivalent or corresponding definitions in the JORC Code.
Competent Person’s Statement
The information in this presentation that relates to Exploration Results and other scientific and technical information is based on information compiled by C. Moorhead, EGM Minerals for Newcrest
who is a Fellow of The Australasian Institute of Mining and Metallurgy, and a full-time employee of Newcrest. Mr Moorhead has sufficient experience which is relevant to the styles of
mineralisation and types of deposits under consideration and to the activity which he is undertaking to qualify as a Competent Person as defined in the JORC Code and is a Qualified Person
within the meaning of NI 43-101. Mr Moorhead consents to and has approved the inclusion in this presentation of the matters based on this information in the form and context in which it appears
including sampling, analytical and test data underlying the results. For details of exploration reports refer to the Newcrest website at www.newcrest.com.au.
Non-IFRS Financial Information
This presentation uses Non-IFRS financial information including Underlying Profit, EBITDA and EBIT. Underlying Profit is presented to assist in the assessment of the relative performance of the
Group. EBITDA and EBIT are used to measure segment performance and have been extracted from the Segment Information disclosed in the ASX Appendix 4D. Non-IFRS information has not
been subject to review by Newcrest’s external auditor.
                                                                                                                                                                                                         2
Newcrest Mining

                                                                              Newcrest in a snapshot
                                                    Bonikro                   • 4th largest global gold producer1
                                                                              • 6 production assets in 4 countries,
                                                                                primarily Australia and Asia Pacific
                                                                              • Gold production 2.3 – 2.5Moz2
                                 Gosowong
                                               Manus Is                       • Copper production 75 – 85kt2
                                                    Lihir Is
          Tandai                                                              • Reserve life of 38 years
                                  Wafi-Golpu
                                                Hidden Valley                 • Workforce 19,000+

                                                                              Newcrest strategy
                              Telfer                              Namosi JV
                                                                              • Long life, low cost, moderate growth
                                                                              • Australia, SE Asia focus
                                                   Cadia Valley
                                                                              • Unhedged, low gearing, dividend growth
      Gold Equivalent
      Resource
                                                                              • Focus on early stage resources
          +50Moz
          20-50Moz                                                            • People & technical capability focus
          0-20Moz
                                                                              • Management incentives
                                                                                ROCE, reserve growth, and cost position
                                                                                                                       3
1 By market capitalisation
2 FY13 production guidance.
Recent highlights

• A$3.5B in major brownfield projects delivered
   – Cadia East (A$2.4B) 8% above budget
   – Lihir MOPU (A$1.4B) 8% above budget
   – Wafi Golpu, the next longer term growth project

• Capital expenditure to decline
   – Projects commissioned, capital spend declining, production and cashflow growing
   – Stripping at Telfer and Bonikro winding down by June 2013

• Growth in Reserves and Resources
   – Reserves: gold 10% increase, copper 43% increase
   – Resources: gold 8% increase, copper 5% increase

• Corporate bonds issued and bank facilities renewed

• New Enterprise Agreements in place for Cadia & Telfer employees (4 years)

                                                                                       4
Half year financial results

• Profit & cash flow
         – Profit1 of A$320M
         – Cash flow from operations of A$225M
         – EBITDA margin of 41%; EBIT margin of 26%

• Significant investment in growth
         – Capital expenditure of A$1,038M
         – Exploration expenditure of A$84M

• Balance sheet remains strong
         – Capex and gearing have peaked
         – Gearing of 16.9%2 - expect reduction from this level
         – Undrawn debt facilities of US$1,405M
         – Interim dividend maintained at 12cps (unfranked)

 1 Profit after tax and non-controlling interest                  5
 2   Calculated as net debt to net debt plus equity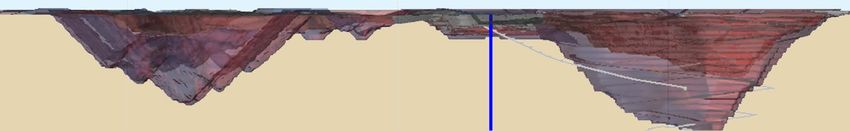
Interim dividend maintained

                                   Dividend growth                                                                Increasing payout ratio
                  60                                                     1200
                               FY13 Interim
                             dividend of 12cps                                                                                         34% including
                  50                                                     1000
                                (unfranked)                                                                                            special dividend

                                                                                Statutory Profit (A$M)
                                                                                                                                                                29%
                  40                                                     800
 Dividend (cps)

                                                                                                                                                         25%
                  30                                                     600                                                                     20%
                                                                                                                                                               interim
                  20                                                     400                                                               16%
                                                                                                                                    15%
                                                                                                          11% 12%
                                                                                                                       10% 9%
                  10                                                     200

                  0                                                      0
                       FY05 FY06 FY07 FY08 FY09 FY10 FY11 FY12 FY13                                       FY05 FY06 FY07 FY08 FY09 FY10 FY11 FY12 1H
                                                                                                                                                 FY13
                         Interim Dividend              Final Dividend
                         Special Dividend              FY Statutory Profit
                                                                                                         Calculated as DPS divided by EPS (underlying)

 Objective is to grow profit and cashflow, maintain a conservative balance sheet, spend within means,
                     and return cash to shareholders via ordinary, special dividends

                                                                                                                                                                   6
Financial flexibility with long dated debt

             Long dated debt repayment profile                                  Peak gearing
(US$M)
                                                                                             16.9%

           1,200

                                                                               12.5%

                                  750      750

                                                                     500

                   100
                          25

           2015    2017   2020   2021      2022                      2041      Jun 12        Dec 12

     Private Placement      Bilateral Facilities   Corporate Bonds

                        US$1,405 million in undrawn facilities at 31 December 2012
         Objective is to reduce level of bank debt over next 18 months as major projects ramp up
                                                                                                      7
Near term growth from past investment

                               Gold Production
                                                                                               5-year production growth of 35% to 50%
                                                                                               • CAGR = 5 to 10% per annum
                                                                         3.1Moz
                                                                            to
                                                                                               • Past investments drive future growth
                                             2.3Moz                      3.5Moz
                    2.29                        to
                                                                                                 – Cadia East = 30 to 40% of 5 year growth
                    Moz                      2.5Moz                                              – Lihir = 50 to 70% of 5 year growth
                                                                                                 – Other growth option studies continue

                            Copper Production
                                                                                               5-year production growth of 20% to 30%
                                                                                               • CAGR = 5 to 7% per annum
                                                                         100kt
                                                                          to                   • Cadia East ramp-up delivers growth
                                               75kt                      110kt
                    76kt                        to                                             • Telfer production declines to 25ktpa from FY14
                                               85kt

         Annual production range: gold bar designates up to low end of range, blue signifies
         high end of range

                                                                                                                                              8

As provided in August 2012 market guidance
Cadia East project

Cadia East Summary
• A$2.05 billion brownfield project
      –   Underground panel cave mine
      –   Plant expansion to 26Mtpa capacity
• Increases annual production to:
      –   700 to 800koz gold (from ~ 450koz)
      –   90kt copper (from ~ 75kt)
• Lowest quartile cash costs
• Province life of at least 30 years

Project Status
• First panel cave in commercial production
  on 1 January 2013, ramping up
• Cave performing well
• Project cost within 8% above budget
• Next phase crusher completes March 2013                                                 Panel cave 1 schematic at 18 February 2013
                                               Drawbell drilled and fired (x54)
• Second panel cave development on track
                                               Drawbell drilled and ready to fire (x27)                                        9
Lihir MOPU project

Lihir MOPU Summary                           Project Status
• US$1.4 billion brownfield project          • Project complete, in operation on 1 February
                                               2013, and ramping up
      –   Process plant expansion
• Increases annual production to 1Moz gold   • Project cost within 8% above budget

• Second quartile cash cost                  • Second phase plant optimisation and flotation
                                               upgrade project underway
• Province life of at least 30 years
                                             • Target FY15 production at 1.0-1.2 Moz

                                                                                               10
Wafi Golpu – the next major province
Wafi Golpu Summary
• US$4.8 billion (100%) greenfield project
• Underground panel cave mine
• Process plant
• Support infrastructure
• Annual production
• 500-600koz gold
• 300-400kt copper
• First production around 2019; >30yr mine life
• Lowest quartile cash cost
Project Status
• Technical pre-feasibility completed
• Engaging with the government, landowner communities and other stakeholders
• Resource development & exploration drilling continues
• Optimise project capital and metallurgical parameters
• Commence feasibility study once suitable stakeholder arrangements in place 11Wafi Golpu in the gold sector
• Wafi-Golpu Mineral Resource containing 29Moz gold and 9Mt copper1
• Golpu Ore Reserve containing 12.4Moz gold and 5.44Mt copper1
Selected SE Asia porphyry copper-gold deposits1
1.30
Oyu Tolgoi
1.20 248 Moz Golpu 2007
1.10 13 Moz Grasberg
1.00 Golpu 2010
35 Moz 329 Moz
0.90 Ok Tedi
0.80 Golpu 2012 20 Moz
Tampakan
Cu (wt %)
69 Moz
0.70 94 Moz Northparkes
0.60 12 Moz
Namosi
0.50 54 Moz Frieda River Ridgeway Didipio
Batu Hijau Cadia Valley
37 Moz 11 Moz 5 Moz
0.40 83 Moz Kingking 125 Moz
Dexing 24 Moz
0.30
16 Moz
0.20
0.10
0.00
0.00 0.10 0.20 0.30 0.40 0.50 0.60 0.70 0.80 0.90 1.00 1.10
In production Project Golpu as at 2007 and 2010 Golpu as at 2012 Au (g/t)
Sourced from Company Reports and Wood Mackenzie Database (accessed 28/06/2012). 12
Bubble size represents total resource gold-equivalent ounces, based on US$1250/oz gold, US$3.10/lb copper on an in-situ basis
1 100% shareOptions for medium term growth
Potential for delivery within 5 years Delivery beyond 5 years
Lihir tune-up and expansion to ~1.4Moz pa Wafi-Golpu
Cadia mine to mill to optimised to 30Mtpa Telfer underground West Dome Deeps
Further Bonikro plant expansions Lihir Argillic Ore and Stockpiles
Namosi open pit mine Gosowong exploration success
O’Callaghans tungsten mine Côte d’Ivoire exploration success
• Multiple project options at various stages of evaluation
• Conservative approach to capital decisions at this time
• Brownfield focus for Exploration
13Exploration program ~ A$150M in FY13
Bonikro and Côte d’Ivoire: A$25 to 30m
• Exploration around Bonikro Mine
Tandai, Manus Island and Mt Andewa JVs: A$10 to 15m • Accelerated regional exploration program AFRICA
• Grassroots exploration
CÔTE D’IVOIRE
PHILIPPINES MANKONO
Wafi-Golpu and Morobe: A$35 to 40m BOUAFLE Yamoussoukro
• Wafi-Golpu project
Gosowong: A$20 to 25m • Wafi Transfer Zone discovery exploration
• Step out drilling around Toguraci and Kencana • Regional exploration Abidjan
BONIKRO
• Regional grassroots exploration within the CoW
Manus Is JV 100 km
PAPUA NEW GUINEA
Tandai JV Wafi-Golpu/ Lihir: A$10 to 15m
INDONESIA Morobe • Resource and Reserve drilling
Mt Andewa JV • Offshore exploration
Hidden Valley
Telfer: A$20 to 25m
• West Dome advanced exploration
FIJI
AUSTRALIA Namosi: A$5 to 10m
• Discovery exploration in Namosi SPL
Cadia Valley
Operation
Exploration objectives: Advanced Project
1000 km • Resource additions < $20/oz Exploration Project
• Early stage province capture
• Drilling > 50% spend
14
• 13 projects, 36 drill rigs, $150M
Indicative spends shown, Newcrest sharePNG, Morobe Mining JV – firming up Wafi Golpu
SCHEMATIC SECTION Golpu Project Recent Drilling
Looking North
West East
• Increase in Lift 1 gold and copper
WR423 758m @ grades
0.67g/t Au, 1.28% Cu
WR440 286m @ • Confirms eastern boundary of Lift 2
5,000 mRL
0.53g/t Au, 1.22% Cu
Lift 1 4850 mRL
Lift 2 • Mineralisation continuity below Lift 2
• WR429W intersects:
Indicated • 658m @ 0.86g/t Au, 1.09% Cu
• Including 246m @ 1.68g/t Au,
4100 mRL
1.97% Cu
Lift 3
WR429W_3 Inferred
658m @ 0.86g/t Au, 1.09% Cu incl.
3850 mRL
246m @ 1.68g/t Au, 1.97% Cu
Exploration
250 m OPEN
20,600 mE
15Telfer - West Dome Deeps
• Drilling targets structural and stratigraphic repeat of Main Dome Telfer Deeps
• Parent holes are well advanced and expected to intersect target in the coming quarter
SCHEMATIC SECTION
WEST DOME MAIN DOME
West Dome Main Dome final
final pit design pit design
Open Pit Extensions
5,000 mRL
Exploration Decline SLC Resource(2)
(pre mining)
Drill hole
3.3Moz Au,
in progress
220Kt Cu
Lower
4,000 mRL West Dome VSC Resource(1)
Limey Unit 1.3Moz Au,
Deeps Target
160Kt Cu
500 m 59000 mE 61000 mE
16
1 Newcrest Annual Statement of Mineral Resources & Ore Reserves to December 31, 2012.
2 Newcrest Annual Statement of Mineral Resources & Ore Reserves to June 30, 2008.Côte d’Ivoire – near mine and regional
PLAN VIEW Bonikro District Drilling
Côte d’Ivoire
AFRICA
• Reserve increase at Bonikro of
0.2 million ounces of gold(1)
• Success near mine
Mankano • Hiré 80m @ 6.4g/t Au from
BFRC032 32m @ 1.0g/t Au Timbé / Bouake
99m
BFRC041 8m @ 18g/t Au • Dougbafla 32m @ 2.1g/t Au
3 Bouaflé
from 205m
Dougbafla
DEDD001 32m @ 2.1g/t Au
Yamoussoukro ORC1215B 19m @ 1.6g/t Au
Dougbafla and 12m @ 4.1g/t Au
DNDD052 17m @ 1.3g/t Au, 15m @ Oumé
Regional Exploration
2.3g/t Au and 9m @ 4.0g/t Au 1 2 Hiré
Hire
HDD2603C 80m @ 6.4g/t Au • Bouaflé diamond drilling
Bonikro
Abidjan
• 8m @ 18g/t Au from 116m
Newcrest Tenement • 32m @ 1.0g/t Au from 140m
Greenstone
100 km
17
1 Newcrest Annual Statement of Mineral Resources & Ore Reserves to December 31, 2012. Resource figures quoted on 100% basis.Long reserve life, concentrated focus
Reserve life (years) Number of Mine Provinces
31
42
28
17 17
19 19
7
Newcrest Goldcorp Newmont Barrick Barrick Newmont Goldcorp Newcrest
Source: Intierra
Source: company filings December 2012, note Newmont data from June 2012 Based on minimum 40% holding. At least one project at mine must be pre-feasibility / concept
• Long reserve life in the industry Percentage of Mine Provinces in “Top 30” Mines
43%
29%
• Concentration of high quality assets 24%
16%
• Brownfield focus continues to
deliver upside Newcrest Goldcorp Newmont Barrick
Source: Intierra; Top 30 NPV basis from BMO Equity Research at 5% discount rate and street consensus
pricing; current as of 8-Jan-2013
18Main production at the low end of the cost curve
Gold industry cash costs
USD$/oz
2,000
1st 2nd 3rd 4th
1,800 Quartile Quartile Quartile Quartile
1,600 Hidden
Valley
1,400
Major growth projects
1,200 in 1st and 2nd quartile
Bonikro
1,000
Telfer
800
Lihir
Cadia Valley
600
Gosowong
400
200
Percentile
0
0% 25% 50% 75% 100%
Industry Reported Total Cash Cost ($ oz)
Source: Thompson-Reuters GFMS ; CY2012 (Q1 to Q3) 19Productivity challenge: people, innovation & technology
Innovation turned into reality The next phase
Remote expert
Remote Operators Central control rooms Semi-continuous underground mining
monitoring
Continuous open pit mining systems
On-line gold analysers
Technical testing site
Autoclave efficiency Coarse particle flotation machines
Adopting bulk
underground at Cadia
East Capability training, speed
Hard rock mechanical tunnelling
Operator training Early waste removal
People logistics Cave flow tracking
Waste technology improvement
Rock cutting
20Conclusion
• Good major projects delivery achieved
• Production growth from Cadia and Lihir
– Production growth from lower cost operations
– Strong free cash flow capacity
– Capital spend declining
• Operational efficiency focus
• Wafi-Golpu the next major province
– Feasibility study expected to commence late 2013
• Exploration results continue to generate options
• Strong financial position
– Reward shareholders
21You can also read