Impact of the Eskom MYPD4 application - February 2019 - NERSA

Page created by Ramon Thomas
 
CONTINUE READING
Impact of the Eskom MYPD4 application - February 2019 - NERSA
Impact of the
Eskom MYPD4 application
                February 2019
Impact of the Eskom MYPD4 application - February 2019 - NERSA
Disclaimer
 NOT FOR RELEASE, PRESENTATION, PUBLICATION OR DISTRIBUTION IN WHOLE OR IN PART IN, INTO OR FROM ANY JURISDICTION WHERE TO DO SO WOULD CONSTITUTE
 A VIOLATION OF THE RELEVANT LAWS OR REGULATIONS OF SUCH JURISDICTION.
 This presentation is for informational purposes only and does not constitute or form a part of any offer or solicitation to purchase or subscribe for securities in the United States
 or any other jurisdiction nor a solicitation of any vote of approval, nor shall there be any sale of securities in any jurisdiction in which such offer, solicitation or sale would be
 unlawful prior to registration or qualification under the securities laws of any such jurisdiction.
 The shares to be issued in connection with the offer for Lonmin plc (“Lonmin” and the “New Sibanye Shares”, respectively) have not been and will not be registered under the
 US Securities Act of 1933 (the “Securities Act”) and, accordingly, may not be offered or sold or otherwise transferred in or into the United States except pursuant to an
 exemption from the registration requirements of the Securities Act. The New Sibanye Shares are expected to be issued in reliance upon the exemption from the registration
 requirements of the Securities Act provided by Section 3(a)(10) thereof.
 This presentation is not a prospectus for purposes of Directive 2003/71/EC (and amendments thereto, including Directive 2010/73/EU, to the extent implemented in any
 relevant Member State) (the “Prospectus Directive”). In any EEA Member State that has implemented the Prospectus Directive, this presentation is only addressed to and is
 only directed at qualified investors in that Member State within the meaning of the Prospectus Directive. This presentation is not directed to, or intended for distribution to or
 use by, any person or entity that is a citizen or resident or located in any locality, state, country or other jurisdiction where such distribution, publication, availability or use
 would be contrary to law or regulation or which would require any registration or licensing within such jurisdiction.
 No statement in this presentation should be construed as a profit forecast.
 Forward looking statements
 This presentation contains forward-looking statements within the meaning of the “safe harbour” provisions of the United States Private Securities Litigation Reform Act of 1995.
 These forward-looking statements, including, among others, those relating to Sibanye Gold Limited’s trading as Sibanye-Stillwater’s (“Sibanye-Stillwater”) financial positions,
 business strategies, plans and objectives of management for future operations, are necessarily estimates reflecting the best judgment of the senior management and
 directors of Sibanye-Stillwater and Lonmin.
 All statements other than statements of historical facts included in this presentation may be forward-looking statements. Forward-looking statements also often use words such
 as “will”, “forecast”, “potential”, “estimate”, “expect” and words of similar meaning. By their nature, forward-looking statements involve risk and uncertainty because they
 relate to future events and circumstances and should be considered in light of various important factors, including those set forth in this disclaimer. Readers are cautioned not
 to place undue reliance on such statements.
 The important factors that could cause Sibanye-Stillwater’s and Lonmin’s actual results, performance or achievements to differ materially from those in the forward-looking
 statements include, among others, our future business prospects; financial positions; debt position and our ability to reduce debt leverage; business, political and social
 conditions in the United Kingdom, South Africa, Zimbabwe and elsewhere; plans and objectives of management for future operations; our ability to service our bond
 Instruments (High Yield Bonds and Convertible Bonds); changes in assumptions underlying Sibanye-Stillwater’s and Lonmin’s estimation of their current mineral reserves and
 resources; the ability to achieve anticipated efficiencies and other cost savings in connection with past, ongoing and future acquisitions, as well as at existing operations; our
 ability to achieve steady state production at the Blitz project; the success of Sibanye-Stillwater’s and Lonmin’s business strategy; exploration and development activities; the
 ability of Sibanye-Stillwater and Lonmin to comply with requirements that they operate in a sustainable manner; changes in the market price of gold, PGMs and/or uranium;
 the occurrence of hazards associated with underground and surface gold, PGMs and uranium mining; the occurrence of labour disruptions and industrial action; the
 availability, terms and deployment of capital or credit; changes in relevant government regulations, particularly environmental, tax, health and safety regulations and new
 legislation affecting water, mining, mineral rights and business ownership, including any interpretations thereof which may be subject to dispute; the outcome and
 consequence of any potential or pending litigation or regulatory proceedings or other environmental, health and safety issues; power disruptions, constraints and cost
 increases; supply chain shortages and increases in the price of production inputs; fluctuations in exchange rates, currency devaluations, inflation and other macro-economic
 monetary policies; the occurrence of temporary stoppages of mines for safety incidents and unplanned maintenance; the ability to hire and retain senior management or
 sufficient technically skilled employees, as well as their ability to achieve sufficient representation of historically disadvantaged South Africans’ in management positions;
 failure of information technology and communications systems; the adequacy of insurance coverage; any social unrest, sickness or natural or man-made disaster at informal
 settlements in the vicinity of some of Sibanye-Stillwater’s operations; and the impact of HIV, tuberculosis and other contagious diseases. These forward-looking statements
 speak only as of the date of this presentation. Sibanye-Stillwater and Lonmin expressly disclaim any obligation or undertaking to update or revise any forward-looking
 statement (except to the extent legally required).

Disclaimer                                                                                                                                                                                2
www.sibanyestillwater.com
Impact of the Eskom MYPD4 application - February 2019 - NERSA
Introduction

• This presentation examines the impact of Eskom’s MYPD4 application for 3 annual
  tariff increases of 15%, above the 4.4% granted for FY2019/20. This equates to a
  compounded nominal increase of 58% over the next 3 years, excluding the MYPD3
  Year-5 RCA application.

• We believe Eskom’s application need to be considered in the context of the
  broader state of the economy and the mining industry.

• The South African gold and platinum mining industries are marginal due to a
  stronger rand and ongoing above-inflation annual cost increases, and thus cannot
  afford further electricity tariff increases above inflation without having to restructure.

• This presentation aims to highlight the impact of the MYPD4 application on the
  sustainability of our operations and on mining stakeholders. This will show that the
  approval of the requested tariffs will likely result in mine closures with significant
  associated job losses and a reduction in capital investment into growth and
  sustaining projects.

• On several occasions Sibanye-Stillwater has presented to NERSA citing that above-
  inflation electricity increases are one of the most significant cost pressures we face.
  Compounded, these cost pressures have lead to 4 Sibanye-Stillwater shafts being
  placed on Care and Maintenance and 8,702 jobs being affected in the last 6
  years.

Our intent is to preserve jobs.                                                                3
www.sibanyestillwater.com
Impact of the Eskom MYPD4 application - February 2019 - NERSA
Who we are
•   Sibanye-Stillwater is a global precious metal
    mining company, producing a unique mix of
    metals that includes gold and the platinum
    group metals (PGMs).                                                                ZIMBABWE
                                                                  Key
                                                                  Bushveld Complex                              Mimosa
•   Domiciled in South Africa, Sibanye-Stillwater
                                                                  Great Dyke
    owns or operates a portfolio of operations and
                                                                  Witwatersrand Basin
    projects in the United States, Zimbabwe and
    South Africa and is the 3rd largest PGM and 10th              Platinum operations
                                                                                                          Rustenburg ops
    largest gold producer globally.                               Gold operations
                                                                                                          Platinum Mile

•   In South Africa, Sibanye Stillwater employs over                                                      Kroondal

    60,000 people at its operations, whilst indirectly
                                                                                           JOHANNESBURG
    benefiting more than 10 times that number.                                                            South Rand project
                                                                                                          (Burnstone)

•   As a price-taker, the sustainability of our                                                           West Wits operations:
                                                                                                          • Driefontein
    business rests on our ability to sustain production                                                   • Kloof
    and contain costs as far as possible.
                                                                 SOUTH                                    • Cooke surface

•   Electricity consumption, with a 24hr average of              AFRICA
    603MW, accounts for 18% of operating costs for                                                        Free State operations
                                                                                                          • Beatrix
    our SA gold operations and 9% for the SA PGM
    operations - any cost increase granted will
    significantly impact on the profitability and
    sustainability of the operations.

                                                                                                                      4
    Sibanye-Stillwater is one of the top 5 private power consumers in South Africa
    www.sibanyestillwater.com
Impact of the Eskom MYPD4 application - February 2019 - NERSA
Our vision and values dictate our actions

  PURPOSE: Our mining improves lives

  VISION:
  SUPERIOR VALUE CREATION
  FOR ALL OUR STAKEHOLDERS
  Through the responsible mining and
  beneficiation of our mineral resources

  Underpinned by our C.A.R.E.S. VALUES

     Commitment             Accountability           Respect               Enabling            Safety

Ensuring value creation for all stakeholders is a fundamental requirement for sustainability            5
www.sibanyestillwater.com
Impact of the Eskom MYPD4 application - February 2019 - NERSA
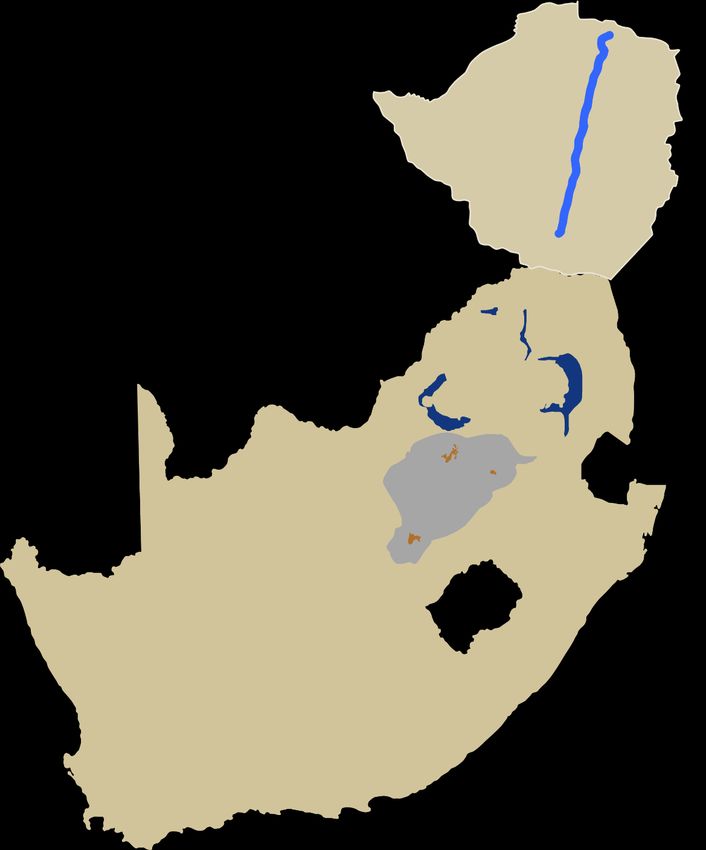
Becoming a leading precious metals company
        Sibanye-Stillwater global PGM ranking – Primary production                                                     Sibanye-Stillwater global gold ranking
               2018A platinum                                           2018A palladium                                             2018A gold and gold
              production (Moz)                                          production (Moz)                                                equivalents
                                                                                                                                      production (Moz)

                                                                                                                               Barrick 3                                  4,8
                       1

 Sibanye-Stillwater
                                                                                  3

                                              1.5                         Norilsk                          2,7
 (post-transaction)
                                                                                                                           Newmont                                        4,7
                                                                                                                                         3

                                                                                  1
                                                            Sibanye-Stillwater                                                       1, 2
                       3
                                                            (post-transaction)                1.12
              Impala                     1,3                                                                      Sibanye-Stillwater                                    4.3

                                                                                                                                                                  3,3
                                                                                                                                         3
                                                                                  3
                                                                                                                          AngloGold
                                                                        Amplats              1.04
            Amplats                     1,2                                                                                              3
                                                                                                                 Freeport-McMoRan                           2,7
                                                                          Impala             0.9
                                                                                                                               Kinross                      2,5
                                                                                                                                         3
                       3
              Norilsk             0,7
                                                                                  3

                                                               North American          0,2                                  Newcrest                     2,3
                                                                 Palladium

                                                                                                                               Polyus                  2,2
                                                                                                                                         3
            Northam           0,3
                                                                        Northam       0,1
                                                                                                                         Gold Fields 3                2,0
                       3
              RBPlats       0,2
                                                                                  3

                                                                          RBPlats     0,1                                  Goldcorp 3                 1,9
                                                                                                                              Lonmin’s contribution to Sibanye-Stillwater
                                                                                                                              Sibanye – Stillwater gold production
Source: Company filings, Wood Mackenzie                                                                                       Sibanye – Stillwater gold equivalents
Notes:
1.   Annualised (A) H1 2018 production from Sibanye – Stillwater proforma Lonmin excluding recycling volumes
2.   Sibanye –Stillwater gold equivalents included completed on a 4E PGM basis. Gold equivalent ounces calculated as PGM basket price in the period (USD1,007/oz) / average gold price
     (USD1,286/oz) in the period multiplied by PGM production (4E) and using the Sibanye – Stillwater H1 2018 prill split
3.   Peer group information using public company filings . Platinum and Palladium reflect primary production for H1 2018 annualised

Positioned globally as a leading precious metals producer                                                                                                                                6
www.sibanyestillwater.com
Cost pressures are forcing a decline in consumption

                                                                   SA Region Power Demand
                                   800                                                                                           • The SA operations demand
                                                                             Sibanye-Stillwater
                                                                             Est. Nov 2012                                         603MW over a 24hr
                                   700
                                                                                                                                   average (2017 - 667MW) or
Total demand (MW - 24hr average)

                                   600                                                                                             ~2.7% of national demand1.

                                   500                                                                                           • One of Eskom’s 5 biggest
                                                                                                                                   private customers with
                                   400
                                                                                                                                   almost R5bn spend per

                                   300                                                                                             annum.

                                   200
                                                                                                                                 • Total consumption has
                                                                                                                                   reduced by 54MW, largely
                                   100                                                                                             driven by the closure of
                                                                                                                                   Cooke shafts , lower
                                    0
                                                                                                                                   production and cost
                                           2009

                                                   2010

                                                            2011

                                                                     2012

                                                                             2013

                                                                                     2014

                                                                                             2015

                                                                                                      2016

                                                                                                              2017

                                                                                                                      2018         pressures.
                                   Kloof   Driefontein    Beatrix    Cooke     Kroondal     RPM     Acc. efficiency reductions

1. Based on Eskom’s 2018/19 forecasted Standard Tariff and NPA sales of 197,294GWh
SOURCE: Internal analysis and Integrated Annual Reports. Kroondal acquired in April 2016 and RPM acquired November 2016                                     7
                 www.sibanyestillwater.com
Electricity is a significant portion of our operating cost

                             2007 Gold Operating Costs   2018 Gold Operating Costs
                                            9%                 10%          18%
                               18%

                                                         22%

                       18%

                                                 55%
                                                                            50%

• Electricity is a significant and growing portion of our operating cost and has contributed to
  increased cost pressures over the past several years. These cost pressures have led to the care
  and maintenance of 4 mines and 8,702 direct job losses in the last 5 years.

• As a result of the inability to influence commodity prices and exchange rates, profitability is
  generally achieved through increased productivity and/or cost management. Productivity
  improvements are incremental and as a result management of costs is often achieved by
  restructuring, which includes reducing our labour complement due to the fact that wages
  account for over 50% of costs in SA mines.

• The current rate of electricity price increases requested by Eskom far exceeds the rate at which
  we can improve productivity, and as a result the sustainability of our operations is likely to be
  affected and operational closure and job losses are a likely outcome.
                                                                                               8
SOURCE: Internal analysis.
  www.sibanyestillwater.com
Tariffs increased 55% over the last 6 years

                                                                                  Eskom Tariff Increases
                                160                                                                                                                                      50%

                                                                                                                                                                         45%
                                140
                                                                                           58% nominal increase
                                                                                                    requested*                                                           40%
 Eskom Average Tariff (c/kWh)

                                120

                                                                                                                                                                               Nominal Tariff Increase (%)
                                                                                                                                                                         35%
                                100
                                                                                                                                                                         30%

                                 80                                                                                                                                      25%

                                                                                       55% historic nominal increase            19.4%                                    20%
                                 60
                                                                                                                                4,4%
                                                                           12.7%                                                                                         15%
                                 40
                                                                           4,7%             9.4%                                                                         10%
                                         16,0%                                                                                  15%               15%          15%
                                 20                                                         5,9%
                                                                                                                                                                         5%
                                                      8,0%       8,0%      8,0%
                                                                                            3,5%                  5,2%
                                  0                                                                    2,2%                                                              0%
                                          2012/13

                                                       2013/14

                                                                 2014/15

                                                                            2015/16

                                                                                             2016/17

                                                                                                        2017/18

                                                                                                                      2018/19

                                                                                                                                 2019/20

                                                                                                                                                   2020/21

                                                                                                                                                               2021/22
                                   MYPD3 Increases (RHS)                              Requested MYPD4 Increases (RHS)                      Once-off Increase (RHS)
                                   RCA Increases (RHS)                                CPI equivalent (2012/13 base)                        Actual price path
                                   MYPD4 price path

*Excludes MYPD3 year 5 RCA application                                                                                                      SOURCE: NERSA documents, StatsSA

                                A further nominal increase of 58% over 3 years is not sustainable for any business                                                       9
                                www.sibanyestillwater.com
The application risks the livelihood of 85 000* people

• The compounded tariff increases will detrimentally impact shaft margins, potentially making current loss-making
   shafts unrecoverable and forcing drastic measures, such as restructuring, Care and Maintenance or permanent
   closure.

• Subsidising loss making production threatens the sustainability of profitable shafts. Continued losses without
   intervention could result in a domino effect, toppling the entire business. Sibanye-Stillwater can not subsidise loss
   making operations.

• If granted, the compounded 58% electricity increase will directly threaten the sustainability of 4 marginal shafts.

• Potential impact to the mining value chain:

                                       At risk – 4 shafts                         Impact extent
                  Effect on Au & PGM production                                                372 901oz
                  Effect on revenue                                                        R 5 667m p.a.
                  Eskom base-load demand                                         92 MW / R 718m p.a.
                  Supply Chain spend                                                         R 739m p.a.
                  Capital spend                                                              R 902m p.a.
                  Employment (employees & contractors)                                        ~8 527 jobs

• Beyond the direct mining value chain, the broader economy will also suffer from a reduction in foreign income
   earnings and taxes and royalties paid.

* Based on the 1:10 support ratio as published by the Minerals Council
SOURCE: Internal analysis.
                                                                                                                   10
  www.sibanyestillwater.com
Above inflation increases will not result in more revenue

                                        Gold Operations’ Electricity Expenditure vs. Tariff Escalation
                                                                                                                                                   • Despite a 5.5% tariff
                               4 500
                                                                                     Estimate                         140                            increase in 2018,
                                                                                                                                                     consumption and

                                                                                                                      120                            revenue to Eskom has
                                                                                                                                                     reduced as a result of
                               4 000
                                                                                                                                                     closures, highlighting a
                                                                                                                      100
Electricity Expenditure (Rm)

                                                                                                                                                     real risk.

                                                                                                                            Eskom tariff (c/kWh)
                                                                                                                      80                           • Above-inflation tariff
                               3 500
                                                                                                                                                     increases will further
                                                                                                                      60                             reduce consumption and
                                                                                                                                                     revenue to Eskom.
                                                                                                                      40
                               3 000                                                                                                               • CPI-increases would
                                                                                                                                                     likely produce a similar
                                                                                                                      20
                                                                                                                                                     revenue stream to Eskom
                                                                                                                                                     and allow the
                               2 500                                                                                  0
                                                                                                                                                     sustainable operation of
                                         2014       2015     2016      2017   2018    2019       2020          2021
                                       Actual Expenditure                            CPI-linked Expenditure                                          our shafts.
                                       MYPD4-application expenditure                 Effective tariff (RHS)
                                       Requested MYPD4 tariff (RHS)                  CPI-linked tariff (RHS)
                                                                                                                                                                         11
                               www.sibanyestillwater.com
Conclusion
 • Sibanye-Stillwater presented to NERSA in 2013, 2015, 2016, 2017 and 2018, citing the risk of
    job losses as a result of cost pressures, including above-inflation electricity increases. Since
    2013, 4 shafts have been put on Care and Maintenance and 8,702 direct employees have
    been voluntarily or involuntary retrenched.

 • At current metal prices a number of shafts are currently marginal or loss-making. Above-
    inflation tariff increases would add further cost pressure and could directly result in 4 more
    shafts becoming loss making, risking employment of a further 8 500 people and indirectly
    the livelihood of over 85 000 people, based on the 1-to-10 support ratio.

 • The current MYPD methodology, taking into account previously granted RCAs, has
    historically not resulted in electricity price path certainty, making business planning
    difficult and deterring investment into long-term projects.

 • Sibanye-Stillwater’s long-term Life of Mine plans assume CPI-linked escalations. Above CPI
    increases will likely result in job losses and further reduced electricity sales, further
    exacerbating Eskom’s financial difficulties.

A significant tariff increase could risk the livelihood of over 85 000 people                      12
www.sibanyestillwater.com
Recommendations
•    Carefully consideration must be given to the sustainability of the mining industry and potential
     impact to its value chain - 8,500 direct jobs at risk.

•    The tariff increases should be limited to CPI, maximum. Sibanye-Stillwater supports the EIUG’s call for
     5 years of CPI-linked increases whilst the Eskom turnaround strategy is executed.

•    Eskom must improve their plant performance in order to mitigate load-shedding, the use of
     expensive generation technologies (OCGTs) and the need to apply for future RCAs.

•    Recommend Eskom to restructure their business, particularly their headcount, to be in line with the
     sales volumes and revenue generated to avoid extreme tariff increases.

• Eskom ‘s corporate governance to be strengthened

•    Other pricing mechanisms should be explored to protect base-load customers in order to stem the
     Eskom death-spiral, including:

         – a review of the current framework for short-term negotiated price agreements (NPA),

         – a new framework for long-term NPAs, and,

         – a review of current tariff subsidy arrangements.

    The outcome of the MYPD4 application will impact business sustainability                             13
    www.sibanyestillwater.com
Contacts
     Jevon.Martin@sibanyestillwater.com
                 Tel: +27 (0)10 001 1175

website: www.sibanyestillwater.com
                                           14
You can also read