TELEKOM MALAYSIA BERHAD - JP Morgan Asia Yield 1x1 Forum 17-18 September 2015 Tokyo - TM | Investor Relations
←
→
Page content transcription
If your browser does not render page correctly, please read the page content below
TELEKOM MALAYSIA BERHAD

 JP Morgan Asia Yield 1x1 Forum
      17-18 September 2015
              Tokyo
Disclaimer
This presentation is not and does not constitute an offer, invitation, solicitation or recommendation to subscribe for, or purchase, any
securities and neither this presentation nor anything contained in it shall form the basis of, or be relied on in connection with any
contract or commitment or investment decision.
This presentation has been prepared solely for use at this presentation. By your continued attendance at this presentation, you are
deemed to have agreed and confirmed to Telekom Malaysia Berhad (the “Company”) that: (a) you agree not to trade in any securities
of the Company or its respective affiliates until the public disclosure of the information contained herein; and (b) you agree to maintain
absolute confidentiality regarding the information disclosed in this presentation until the public disclosure of such information, or unless
you have been otherwise notified by the Company.
Reliance should not be placed on the information or opinions contained in this presentation or on its completeness. This presentation
does not take into consideration the investment objectives, financial situation or particular needs of any particular investor.
No representation or warranty, express or implied, is made as to the fairness, accuracy, completeness or correctness of the
information, opinions and conclusions contained in this presentation. None of the Company and its affiliates and related bodies
corporate, and their respective officers, directors, employees and agents disclaim any liability (including, without limitation, any liability
arising from fault or negligence) for any loss arising from any use of this presentation or its contents or otherwise arising in connection
with it.
This presentation contains projections and “forward-looking statements” relating to the Company’s business and the sectors in which
the Company operates. These forward-looking statements include statements relating to the Company’s performance. These
statements reflect the current views of the Company with respect to future events and are subject to certain risks, uncertainties and
assumptions. It is important to note that actual results could differ materially from those anticipated in these forward looking
statements. The Company does not undertake to inform you of any matters or information which may come to light or be brought to
the Company’s attention after the date hereof.
The forecasts and other forward-looking statements set out in this presentation are based on a number of estimates and assumptions
that are subject to business, economic and competitive uncertainties and contingencies, with respect to future business decisions,
which are subject to change and in many cases outside the control of the Company. The directors and officers of the Company believe
that they have prepared the forecasts with due care and attention and consider all best estimates and assumptions when taken as a
whole to be reasonable at the time of preparing the presentation. However, the Company’s forecasts presented in this presentation
may vary from actual financial results, and these variations may be material and, accordingly, neither the Company nor its directors or
officers can give any assurance that the forecast performance in the forecasts or any forward-looking statement contained in this
presentation will be achieved. Details of the forecasts and the assumptions on which they are based are set out in the presentation.
This presentation may not be copied or otherwise reproduced without the written consent of the Company.
                                                                                                                                            2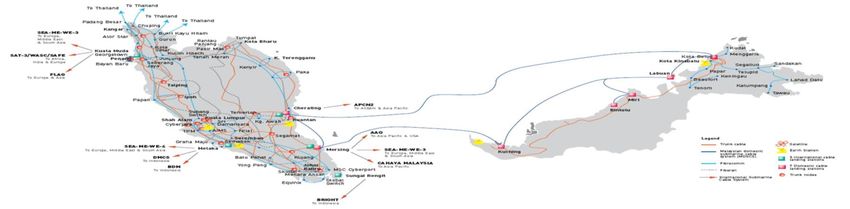
Country & Industry Overview

About TM

Group Results: 3-Year Performance

High Speed Broadband Update

Convergence

2015 Outlook and Business Priorities

Country & Industry Overview as at 1Q20151

                                                                                                         Malaysia

                                                                                                                                            rate in Malaysia
                                                                                                       Broadband
                                                                                                penetration rate in

                                                                                                                                        Cellular penetration
           Total Households in
                     Malaysia

                                                  Age Demographic
                                                                    60 years old = 9%
                                                                                                                      70.4%                                    146.2%

                                        Market Share as at 1Q20151

    Voice Revenue                       Broadband Revenue                          Data Revenue2                           Fixed Line                            Fixed Broadband

        21%                                    29%                                     71%                                  97%                                        92%
               market share                           market share                          market share                physical market share                      physical market share
Market share: RM3.98bn                   Market size: RM2.82bn                   Market size: RM1.06bn                 Market size: 3.54mn                        Market size: 2.4mn

1   Official 2Q2015 data unavailable at the time of publication
2   Data as at 2H2013

Source: MCMC, DOS, Company Financial Results;
Group Regulatory & BMI Team Analysis
                                                                                                                                                                                           4
•   Authorised Capital: RM3,528,003,015.00
                                                                           •   Issued and Paid-up Capital: RM2,603,561,225.30
                   CREDIT RATING                                           •   Date of Incorporation: 12 October 1984
                                                                           •   Date of Listing: 7 November 1990
       Moody’s                     • A3
                                                                                                                         TM Shareholders*
          S&P                       • A-

         RAM                      • AAA

                                                       Capital Structure
                                                                                         Free Float                     Khazanah
                                                                                            30%                           29%

      TOTAL RETURN TO SHAREHOLDERS

   FBMKLCI1                            60.52%
       TM1                            373.61%                                                Foreign                       EPF
                                                                                              15%                          15%
                                                                                                           Amanah
    AXIATA2                            30.55%                                                               Raya
                                                                                                            11%                          Khazanah
    MAXIS3                             87.45%
                                                                                                                                         EPF
      DIGI1                           237.33%
                                                                               * As at 31st July 2015                                    Amanah Raya
Source: Bloomberg                                                              Note: EPF stands for Employees Provident Fund Board
1 For the period 22 April 2008 – 8 September 2015                              Source: TM Website (www.tm.com.my)                        Foreign
2 For the period 25 April 2008 – 8 September 2015
                                                                                                                                         Free Float
3 For the period 18 November 2009 – 8 September 2015

                                                                                                                                     5                 5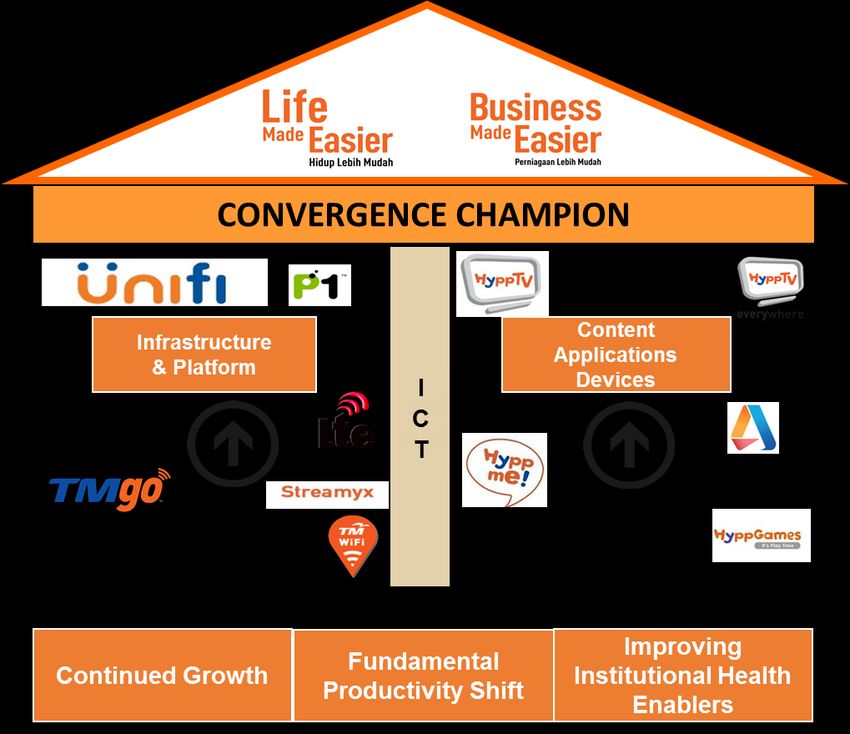
TM TODAY…

                                                                             >60%
                   No.1                        2.29                      Market
                                                million                  share

             broadband provider                broadband           Malaysia’s largest
                 in Malaysia                   customers              fixed data
                                                                       provider
                                                                                             >1TB
                                                                                            Global
                                                                                           Capacity
                                                                    RM

 More than  1.7 million 373%                                     10.99
   ports for high speed                                            billion               Enhanced global
                                  total shareholder return
  broadband deployment            since demerger
                                                                                          network with
                                                                                        design capacity of
                                                               total payout to                33TB
                                                                shareholders
                                                               since demerger

                  >27,000
                     employees
                                                            TRI*M score >
                                                            global average
                                                           for 4th consecutive year

    Note: Information as at 8 September 2015                                                                 6
We offer a full suite of products and services to enable a digital lifestyle
            MASS MARKET                           MANAGED ACCOUNTS

  CONSUMER                               SME

                                                                                   CLOUD
                                                                   DATA CENTRES
                                                                                  SERVICES

                                       Shop In A Box™

                               GLOBAL & WHOLESALE

                      Access            Infra           Backhaul                             7
Group Results: 3-Year Performance

                                   Revenue                                                                                     EBIT
RM mn                                                                                     RM mn
                        +6.4%                                 +5.7%
                                                                                                  +15.6% (Normalised +18.2%)              -5.7% (Normalised +2.0%)

                                                                      11,235                                            1,372       1,359                          1,387
                                                                                           1,187      1,150                                              1,294
                                         10,629
        9,994

    FY2012                               FY2013                       FY2014                  FY2012                           FY2013                        FY2014

                                         Revenue                                                                      EBIT      Normalised EBIT

                                    EBITDA                                                                                   PATAMI

RM mn                                        32.9%                                        RM mn
                                                                              31.9%
          31.8%                                                                                -19.9% (Normalised +17.9%)                   -17.8% (Normalised -9.4%)
                                                                              32.8%
                                             32.7%
          31.6%

         +9.2% (Normalised +10.1%)                    +2.9% (Normalised +5.9%)

                                                                                           1,264
                                                                                                                         1,012        1,039
                                                                                                        881                                                           941
                                                                                  3,725                                                                    832
                                    3,532                             3,636
  3,233         3,196                              3,159

        FY2012                             FY2013                         FY2014                  FY2012                       FY2013                         FY2014

                                EBITDA      Normalised EBITDA                                                      PATAMI        Normalised PATAMI

                        EBITDA Margin              Normalised EBITDA Margin               Note: Unless stated otherwise, all figures shall be inclusive of P1               8
Total Revenue by Product: 3-Year Performance
                                            Non-voice Revenue now >69% of Group Revenue

              FY2012                                               FY2013                                                           FY2014

              Others                                              Others                                                          Others
               17%                        Voice                    17%                              Voice                          19%        Voice             Voice
                             Voice                                                Voice
                                                                                  34%                                                         31%               Data
                             37%          Data                                                      Data
          Internet                                            Internet                                                                                          Internet
                                          Internet                                                  Internet                   Internet
            24%                                                 25%                                                              27%       Data                 Others
                     Data                 Others                           Data                     Others
                                                                           24%                                                             23%
                     22%

               Internet                                  Data                                       Voice                                          Others*
RM mn                                     RM mn                                       RM mn                                        RM mn
    +12.8%                                                                                                                                 +6.5%            +18.8%
                            +11.9%                                                          -2.4%              -4.1%
                                           +13.9%                +3.7%

                                 2,995                   2,512            2,606           3,706       3,618                                                     2,165
  2,372          2,676                    2,205                                                                        3,469          1,711         1,823

 FY2012         FY2013         FY2014    FY2012        FY2013            FY2014       FY2012        FY2013        FY2014             FY2012        FY2013     FY2014

   *”Others” comprise other telco and non-telco services i.e ICT-BPO, MMU tuition fees, customer projects, Yellow Pages
    Note: Unless stated otherwise, all figures shall be inclusive of P1                                                                                                    9
Capex & Opex: 3-Year Performance

                                      Total Capex                                                     Cost % of Revenue1
       RM mn                                                                        RM mn
                2,546                     1,863                    1,836                    8,972.0       9,378.3        10,095.1
               25.5%                      17.5%                    16.3%                    88.3%          87.2%           88.6%

                                                                                              0.6            0.8             2.0
                                                                                              4.2            3.7             3.2
                 504                                                                          6.3            6.4             6.9

                                                                                              8.5            7.1             7.4

                                                                                                                                            Bad Debt
                                                                                              11.6           10.9           11.0
                                                                                                                                            Marketing Expenses
                                          470                       480
                 923                                                                                                                        Supplies & Materials
                                                                                                                                            Maintenance Cost
                                                                                              19.9           21.0           21.0
                                                                                                                                            Other Operating Cost
                                                                                                                                            Manpower Cost
                                          645
                                                                    662
                                                                                                                                            Direct Cost

                                                                                              17.0           17.2           16.5            Dep & Amortisation

                1,119

                                          748                       694
                                                                                              20.1           20.1           20.5

               FY2012                    FY2013                   FY2014                    FY2012         FY2013          FY2014
                        Access     Core Network       Support System*                              Total Cost / Revenue ( %)
                                                                                            1 Revenue = Operating Revenue + Other Operating Income
                                  Capex / Revenue (%)
                                                                                            Note: The classification of cost is as per financial reporting         10
*Include Application, Support System & Others (building, land improvement, moveable plants, application & other assets)
Group Physical Highlights : 3-Year Performance
Broadband
In thousand
+7.2% +0.7%
2,215 2,231
2,066
483 635 729
UniFi
In thousand
1,583 1,580 1,502 +31.6% +14.8%
729
635
125
FY2012 FY2013 FY2014 105
483
Streamyx UniFi
77
DEL 530
604
406
In thousand +0.3% -2.7%
4,359 4,373 4,256
483 FY2012 FY2013 FY2014
635 729
UniFi Residential UniFi Business
3,876 3,738 3,527
FY2012 FY2013 FY2014
11
DEL UniFiHigh Speed Broadband Updates
Delivered 1.71mn ports covering 106 exchanges
Activated close to 782,000 Unifi customers or 46%
take-up
Awarded HSBB Phase 2 & Sub Urban Broadband (SUBB) projects
122 IPTV Channels – with new exciting local
content
More choices available, introduced UniFi 30Mbps & 50Mbps
Introduced two new affordable priced broadband packages
– Streamyx 1Mbps RM38/month & UniFi 10Mbps RM179/month
Collaboration between HyppTV and a local mobile operator
for HyppTV Everywhere
12Customer Behaviour Trends: Access Broadband via Multiple Devices
At home, users need broadband mainly for video streaming, whilst SMEs carry out business
functions i.e sending emails and browsing
Devices Internet Usage
tablets / Total average weekly time spent
TV with each media (hours)
smartphone
16 1.Video streaming
14 2.Social networking
12 15 3.Emails
4.Games
10
HOME
5.Messaging
8
6
4 6
2
0
notebook / Using Internet Watching TV
desktop
Reason for using Internet
tablets / Services (e.g. email,
smartphone 73% browsing)
31% File transfer
SME desktop 21% Voice call (VoIP)
ecommerce
20%
notebook 17% Cloud software
Source: Content Eco system in Digital age – Result Malaysia, Google; 13
Source: MCMC Internet User Survey 2012; comScore Inc., Nielsen)Going from “BROADBAND CHAMPION” to “CONVERGENCE CHAMPION” ...
On the On the offerings On our On the branding
messaging #1 Fixed WiFi # 1 Fixed customer service
Line Broadband
Mobile Data IPTV
It’s all about CUSTOMER EXPERIENCE
142015 Outlook and Business Priorities
CONVERGENCE CHAMPION delivering LIFE and BUSINESS MADE EASIER
• Rollout of HSBB 2, Sub-Urban Broadband
• Investments for future growth 15THANK YOU Investor Relations Level 11 (South Wing), Menara TM Jalan Pantai Baharu 50672 Kuala Lumpur Malaysia Tel: (603) 2240 4848/ 7366 / 7388 investor@tm.com.my
Appendix

           17

                17
Headline KPI
2015 2017
Revenue Growth 4-4.5% 5-5.5%
EBIT Growth 4-4.5 % 5-5.5%
Customer Satisfaction
72 72
Measure1
*Note: Headline KPI for TM excluding P1, HSBB 2, SUBB & other mega projects
1 Using TRiM index measuring end to end customer experience at all touch points. TRiM (Measuring, Managing and Monitoring)
is a standardized indicator system. It analyzes, measures and portrays stakeholder relationships on the basis of standardized
indicators. The TRI*M Index is an indicator of the status quo of a particular relationship. The index is made up of four points of
view on the stakeholder relationship, e.g. for customer loyalty: overall rating, recommendation, repeat purchasing of
product/services, and a company's competitive advantage. The information is based on surveys/interviews on a sample
customer base.”
18Reiteration of Dividend Policy
Telekom Malaysia Berhad ("the Company" or "TM") issues a statement to reiterate its stand on the Company's dividend policy. The
Company’s dividend policy as announced at the time of the demerger between TM and TM International Berhad (TMI) remains
valid. The policy states as follows:
“In determining the dividend payout ratio in respect of any financial year after the Proposed Demerger, our Company intends to
adopt a progressive dividend policy which enables us to provide stable and sustainable dividends to our shareholders while
maintaining an efficient capital structure and ensuring sufficiency of funding for future growth.
Upon completion of the Proposed Demerger, our Company intends to distribute yearly dividends of RM700 million or up to 90% of
our normalised PATAMI, whichever is higher.
Dividends will be paid only if approved by our Board out of funds available for such distribution. The actual amount and timing of
dividend payments will depend upon our level of cash and retained earnings, results of operations, business prospects,
monetization of non-core assets, projected levels of capital expenditure and other investment plans, current and expected
obligations and such other matters as our Board may deem relevant.”
This policy remains unchanged for 2009 and beyond. The Company is currently able to meet this dividend policy, because:
• The Company has sufficient consolidated cash and bank balances of RM1.144 billion as at 30 September 2008, and it is
confident that TMI is able to meet its obligation due to TM of RM4.025 billion by April 2009.
• In the event of a downturn in performance due to unforeseen circumstances, the Company wishes to state that its recurring cash
generation ability is sufficient to meet its current dividend policy.
• TM’s retained earnings is also sufficient to support this current dividend policy in the event of unforeseen shortfalls in normalised
PATAMI.
Given the unprecedented volatility in global markets, the Company will continue to examine the likely impact on its business,
cashflow generation, capital structure and methods in which excess cash beyond the dividend policy and prudent level of cash
required for operations, can be efficiently distributed to our shareholders.
Moving forward, TM is focused on building a strong foundation for its future growth and operational excellence.
TELEKOM MALAYSIA BERHAD (Bursa Malaysia Announcement Reference No TM-081113-37325)
Date Announced :13/11/2008 19Shareholder Return (2009-2014)
Dividend Payout Policy of RM700 mn or up to 90.0% of
Normalised PATAMI whichever is higher
150.9%
124.2%
110.5%
89.3% 89.9% 90.0%
6.5%
5.6%
4.7%
RM million 4.0% 3.6% 3.3%
1,500.0
1,037.4 1,073.2 1,038.50
993.7
1,000.0 941.2 1
881.0 846.8
787.0
706.5 700.3 701.2
634.8
563.7
468.3
500.0
0.0
2009 2010 2011 2012 2013 2014
Normalised PATAMI Ordinary Dividend Capital Repayment Capital Distribution Payout3 Net Dividend Yield2
1 2014 Interim Dividend of 9.5sen & Final Dividend of 13.4sen
2 Net Dividend Yield based o closing price at year end
3 Excludes Capital Distributions/Repayments
20Key 1H 2015 Highlights
Revenue
RM mn +3.2%
+0.7%
+2.4%
Revenue grew 2.4% vs 1Q
5,615 5,442 2015
2,822 2,774 2,841 Driven by Voice and Others
which grew 2.8% and 12.1%
2Q14 1Q15 2Q15 Revenue 1H14 1H15 respectively.
Normalised EBIT
RM mn
-15.2%
-13.6%
+22.1%
Normalised EBIT was higher
639 542 against 1Q15, in line with
345
244 298 higher revenue and better
cost management.
2Q14 1Q15 2Q15 1H14 1H15
Normalised EBIT
PATAMI
RM mn -1.0% (Normalised +2.6%) -19.7% (Normalised -2.1%)
+64.5% (Normalised +28.2%) 425 341 Normalised PATAMI was
higher QoQ by 64.5% to
214 129 212 RM212.1mn.
399 391
214 171 220
2Q14 1Q15 2Q15 1H14 1H15
Reported PATAMI Normalised PATAMI
21
Note : Unless stated otherwise all figures shall be inclusive of P1Group Total Revenue by Product
Voice Internet
1H 2015
RM mn RM mn
-1.8% -2.1% +14.3% +14.3%
RM5,615mn
+2.8% +0.2%
1,661
1,768 1,732
1,453 Others
17% Voice
31%
830 831 Internet
894 854 878 727 22%
Data
30%
2Q14 1Q15 2Q15 1H14 1H15 2Q14 1Q15 2Q15 1H14 1H15
Data Others*
1H 2014
RM mn RM mn -6.9%
-4.9% -0.8% +1.1% RM5,442mn
-2.4% +12.1%
1,250 1,240 971 982 Others
18% Voice
32%
644 557 519
627 613 463 Internet
23%
Data
27%
2Q14 1Q15 2Q15 1H14 1H15 2Q14 1Q15 2Q15 1H14 1H15
*Others comprise other telco and non-telco services (i.e ICT-BPO, MMU tuition fees, customer projects)
Note : Unless stated otherwise all figures shall be inclusive of P1 22Group Total Revenue by Line of Business
Mass Market Managed Accounts
RM mn RM mn 1H 2015
+3.6% +3.4% -4.3% -0.6%
+1.0% +4.2% RM5,615mn
Others
2,280 2,357 7%
2,100 2,087
Global &
Wholesale Mass
14% Market
42%
1,143 1,172 1,184 1,113 1,022 1,065
Managed
Accounts
37%
2Q14 1Q15 2Q15 1H14 1H15 2Q14 1Q15 2Q15 1H14 1H15
Global & Wholesale Others*
RM mn RM mn
+55.5%
1H 2014
-8.7% +63.9%
-4.1%
RM5,442mn
+4.4% -3.0%
837 368 Others
803 4%
Global &
Wholesale
225 15%
Mass
449 410 187 181 Market
393
42%
117
Managed
2Q14 1Q15 2Q15 1H14 1H15 2Q14 1Q15 2Q15 1H14 1H15 Accounts
39%
* Others comprise revenue from Property Development, TM R&D, UTSB, MKL & P1
Note : Unless stated otherwise all figures shall be inclusive of P1 231H 2015 Highlights: CAPEX & OPEX
Total Capex Total Cost
RM mn RM mn
9.3% 15.1% 10.0% 12.2% 91.3% 89.4% 88.1% 90.3%
2,563.1 2,564.5 4,866.8 5,127.6
258 428 545 686
2.0 1.8 1.9
3.2 3.1 1.7 3.1
108 3.2
6.0 5.8 5.9
6.1
7.2 6.4 6.8
6.9
10.9 11.0 11.0
10.9
119 196
22.6 21.8 22.2
69 22.3
158
115
17.9 17.7 16.4 17.8
38
81 382
21.5 21.7 20.6 21.6
244 268
139
1Q15 2Q15 1H14 1H15
Dep & Amortisation Direct cost Manpower cost
1Q15 2Q15 1H14 1H15
Other operating cost Maintenance cost Supplies & material
Access Core Network Support System Marketing expenses Bad debt
Capex / Revenue ( %) Total Cost / Revenue ( %)
1 Revenue = Operating Revenue + Other Operating Income
Note: The classification of cost is as per financial reporting 24Group Cash Flow
RM mn 1H15 1H14
Cash & cash equivalent at start 2,975.0 2,514.5
Cashflows from operating activities 833.4 822.6
Cashflows used-in investing activities (1,016.8) (808.4)
Capex 685.7 545.0
Cashflows from financing activities 56.3 490.3
Effect of exchange rate changes 0.1 (0.3)
Cash & cash equivalent at end 2,848.0 3,018.7
Free cash-flow (EBITDA – Capex) 1,091.3 1,250.8
25
Note : Unless stated otherwise all figures shall be inclusive of P1Group Balance Sheet
As at 30 June 2015 As at 31 Dec 2014
RM Million
Shareholders’ Funds 7,695.5 7,571.1
Non-Controlling Interests 324.2 388.8
Deferred & Long Term Liabilities 10,233.7 9,806.1
Long Term Borrowings 6,644.8 6,251.4
Deferred Tax 1,326.0 1,258.0
Deferred Income 1,839.1 1,823.1
Derivative financial instruments 331.5 337.8
Trade and other payables 92.3 135.8
18,253.4 17,766.0
Current Assets 6,923.4 6,481.2
Trade Receivables 2,668.9 2,237.2
Other Receivables 659.7 588.1
Cash & Bank Balances 2,858.8 2,985.8
Others 736.0 670.1
Current Liabilities 4,697.1 4,857.2
Trade and Other Payables 3,395.1 3,605.2
Short Term Borrowings 238.6 197.0
Others 1,063.4 1,055.0
Net Current Assets/(Liabilities) 2,226.3 1,624.0
Property Plant & Equipment 14,344.5 14,785.1
Other Non-Current Assets 1,682.6 1,356.9
18,253.4 17,766.0
Note : Unless stated otherwise all figures shall be inclusive of P1 26Debt Profile
TM Debt Maturity Profile as at 30 June 2015
RM denominated
USD denominated
JPY denominated
1,200 9 1,1311
Others Currency Mix Fixed vs Floating
3 0.05% Floating
925 2
4
7.84%
800 850
650 6
USD
7 11.82%
376
240 5 200 8 10
3
2017 2018 2020 2020 2021 2022 2023 2024 2025 2034
Note: 1 USD 299.5m; Fx Rate 3.4965, Coupon: 7.875% 2 MTN2 Coupon: 4.50%; MTN4&6
Coupon: 4.20% 3 TMISIS Coupon: 4.87%
4 MTN8 Coupon: 4.00%; MTN14 Coupon:3.95%; MTN006: 4.23% MYR
Fixed
5 Sakura – JPY Loan: 0.91375% 6 MTN17 Coupon: 3.95%; MTN18 Coupon: 3.93% 88.14%
92.16%
7 Sakura2 –USD Loan: 3mthL+0.91% 8 MTN001 Coupon: 4.30%
9
MTN002 Coupon: 4.82%, MTN003 Coupon: 4.738% , MTN004 &5Coupon: 4.55% USD MYR Others Fixed Floating
10 CIDA Loan: 0.00%
Key Financial Ratios
30 Jun 15 31 Dec 14 30 Jun 15 31 Dec 14
Return on Invested Capital1 5.77% 7.72% Gross Debt to EBITDA 1.88 1.77
Net Debt/EBITDA 1.05 1.02
Return on Equity2 10.24% 12.80%
Return on Assets1 4.76% 6.34% Gross Debt/Equity 0.89 0.85
Current Ratio3 1.47 1.33 Net Debt/Equity 0.52 0.46
WACC 7.41% 7.54% Net Assets/Share (sen) 204.8 203.6
1 Based on Normalised EBIT 27
Note : Unless stated otherwise all figures shall be inclusive of P1
2 Based on Normalised PATAMIPhysical Highlights
Broadband
192 190 190
ARPU (RM)
188 189
187 Customer base higher by
86 85 81
90 89 86 1.6% driven by Unifi
+1.6%
+1.0%
Unifi grew by 16% vs YTD
2014, at 782,000 customers
Customers (In thousand)
2,230 2,251 2,213 2,231 2,266 2,288
activated
653 673 700 729 757 782
1,577 1,578 1,513 1,502 1,509 1,506 Unifi ARPU stable at RM190;
Streamyx ARPU at RM86
1Q14 2Q14 3Q14 4Q14 1Q15 2Q15
Streamyx UniFi
UniFi ARPU (Blended) Streamyx Net ARPU
Fixed Line
ARPU (RM)
31 31 31 30
30 30
-1.8%
Customers (In thousand)
-0.3%
4,318 4,321 4,267 4,256 4,254 4,243
653 673 700 729 757 782 ARPU stable at RM30
3,685 3,648 3,567 3,527 3,497 3,461
1Q14 2Q14 3Q14 4Q14 1Q15 2Q15
Fixed Line UniFi
Fixed Line (DEL) ARPU 28Product Updates
Unifi: we now offer more choices to our customers depending on their needs..
CHOOSE
Want faster internet speed?
UniFi 50Mbps
Aneka / Varnam Pack Ruby Pack Jumbo Pack • Speed upgrade to 50Mbps
RM50/mth
Want more data on the go?
GET
• Speed 1Mbps
• Quota 5GB
• FREE Registration & Activation RM150
RM29/mth
YOU PAY
RM
199 /mth
RM
209 /mth
RM
229 /mth
Want to talk more?
Voice Pack
• FREE 600 Minutes
• Beyond 600 Minutes
• HyppTV Everywhere on 2 devices • TM WiFi ID -FREE TM Fixed to TM Fixed calls nationwide
FREE
-Flat rate from TM Fixed to Mobile is 11sen/min
YOU’LL
ENJOY
• Installation & activation • HyppTV Set-Up Box (STB)
RM20/mth
• DECT phone • Residential Gateway
VOICE CALLS • Fixed to fixed and fixed to mobile at 20sen/min
• All price are exclusive of GST
• Only applicable through selected channels 29HSBB deployment areas
106 service areas have been covered under HSBB Phase 1
KANGAR
◘
© ALOR STAR
◘
◘©
◘
◘ ◘ KOTA KINABALU ©
KUALA TERENGGANU
◘ ©
◘ ◘
◘ IPOH
◘
◘ © ◘
Northern
◘
Corridor ◘ Zone 3
Economic
Region ◘
◘
◘ ◘
© KUANTAN
◘ ◘
SHAH ALAM
©
◘
KUALA LUMPUR ◘
◘ ◘ ◘
Klang
Valley SEREMBAN
© Zone 3
◘ LEGEND
©◘ ◘
MELAKA Zone 1 – HSBB
KUCHING
◘ ◘
◘ ◘ ◘ High economic impact areas
◘ ©◘
◘ ©
◘
JOHOR BAHRU
◘ Industrial parks/FTZs
covered
Iskandar
Zone 2 – BBGP
Malaysia
Urban/Semi-urban and rural
Zone 3 – USP
Less populated areas
30
Areas are indicative and not to scaleAny queries please email to :
Rohaila Mohamed Basir
Investor Relations
Telekom Malaysia Berhad
investor@tm.com.my
•Investor Relations• Level 11 (South Wing)• Menara TM•Jln Pantai Baharu •50672 Kuala Lumpur, Malaysia • Tel (603) 2240 4848/ 7366 / 7388You can also read