CORPORATE PRESENTATION - CLEANEST & KINDEST HYDROCARBONS BEST & SMARTEST OIL & GAS FINDERS - GEOPARK

Page created by Herman Norman
 
CONTINUE READING
CORPORATE PRESENTATION - CLEANEST & KINDEST HYDROCARBONS BEST & SMARTEST OIL & GAS FINDERS - GEOPARK
Cleanest & Kindest
                           Hydrocarbons
Best & Smartest                               Safest, Lowest Cost
Oil & Gas Finders                               & Most Efficient
                                                   Operator

                      Consistent Free Cash
                      Flow & Value Delivery

                    Corporate Presentation
                    May 2021
CORPORATE PRESENTATION - CLEANEST & KINDEST HYDROCARBONS BEST & SMARTEST OIL & GAS FINDERS - GEOPARK
Investment Highlights
                                                                                                                                                                            42,000
   Proven Team and Plan
   • Long-term value proposition and approach                      COLOMBIA
   • Right geography with immense opportunity
   • Best people and skillsets across full E&P value
     chain                                                                                                                                                                  37,000
                                                              ECUADOR
   • Motivated and owner-committed culture

   Low Risk High Value Asset Portfolio
   • Big profitable low-cost production and reserve base
   • High-impact exploration potential                                                                   BRAZIL                                                             32,000
   • Short, medium and long term growth fairway
   • Diversified risk-balanced inventory in proven basins

                                                                                                                                                                                     Net Average Daily Production (boepd)
   Track Record / Operational Excellence
   • 18 years of consistent performance growth and                                                                                                                          27,000
     delivery
   • Technical expertise and muscle to get the job done
   • Volatility and risk management champions
   • Continuous cost and technical innovations
                                                                                                                                                                            22,000
   Resilient Financial Performance
   • Superior and reliable cash generation
   • Low-breakeven production
   • Rigorous cost and capital allocation management                           ARGENTINA
   • Well-engineered and strong balance sheet
                                                                                                                                                                            17,000
   Foundational ESG+ Proficiency
   • In-house permanent SPEED value system
   • Defines success by integrated stakeholder results
     and impacts
   • Balanced across all business needs and benefits                                                                            ONLY PUBLIC                                 12,000
                                                                                                                                ONLY PUBLIC
   • Good governance = shareholder / bondholder                                                                                INDEPENDENT
                                                                                                                               INDEPENDENT
                                                                                                                            POSITIONED ACROSS
     prosperity                                                                                                             POSITIONED ACROSS
                                                                                                                            LATIN AMERICA - THE
                                                                                                                            LATIN AMERICA - THE
                                                                                                                            MOST ATTRACTIVE  OIL
                                                                                                                            MOST ATTRACTIVE
                                                                                                                             & GAS INVESTMENTOIL
                                                                                                                             & GAS INVESTMENT
                                                                                                                               REGION TODAY                                 7,000
                                                                                                                               REGION TODAY

                                                                                                                                                                            2,000

                 2006        2007        2008        2009   2010   2011       2012    2013       2014       2015     2016      2017     2018       2019   2020
                                                                                                                                                           2020E   2021E*

                                                                                             Historical Production                                                          -3,000
* Reflects middle-point of 41,000-43,000 boepd guidance.                                                                                                                                                      2
CORPORATE PRESENTATION - CLEANEST & KINDEST HYDROCARBONS BEST & SMARTEST OIL & GAS FINDERS - GEOPARK
Track Record                                                                                                                   18 Years of Value Delivery
                                                                RIGOROUS RISK MANAGEMENT = CONSISTENT VALUE CREATION

   PRODUCTION (MBOEPD)                                                                                                 RESERVES (2P, MMBOE)

                                                                                                  40     40
                                                                                                                                                                                                  197
                            CAGR 18%                                                       36                                                   CAGR 14%                                   184
                                                                                                                                                                                                                175
                                                                                                                                                                                                         165
                                                                                                                                                                                     159
                                                                                28                                                                                          143
                                                                                                                                                             122     125
                                                          22         22
                                              21

                                    14                                                                                                                70
                            11                                                                                                             57
                                                                                                                             50     50
             7       8                                                                                                42
      6

    2009 2010 2011 2012 2013 2014 2015 2016 2017 2018 2019 2019*
                                                           2020                                                     2009 2010 2011 2012 2013 2014 2015 2016 2017 2018 2019 2019* 2020

                                              Gas              Oil                                                                                                 Gas       Oil

   NET PRESENT VALUE** ($BN)                                                                                           FREE OPERATING CASH FLOW ($MM)

                                                                                                                                                                                                         237
                                                                                            2.8
                                                                                     2.7
                     CAGR 20%                                                                            2.5                                                                                      206
                                                                                                   2.5                                      CAGR 41% (2015-2020)
                                                                          2.3

                                                               1.9                                                                                                                                               142
                                            1.7     1.6
                                  1.3
                          1.0                                                                                                                                                               70
            0.9    0.9
                                                                                                                                                                                     39
                                                                                                                                                                            25
     0.3

                                                                                                                     2009    2010   2011    2012       2013        2014    2015     2016   2017   2018   2019   2020
    2009 2010 2011 2012 2013 2014 2015 2016 2017 2018 2019 2019* 2020                                                         -17                                   -18
                                                                                                                      -23                                                         Adjusted EBITDA Minus CAPEX
                                                                                                                                     -35
                                             2P NPV 10 ($Bn)                                                                                               -48
                                                                                                                                                -77
* Excluding Peru and the REC-T-128 block.
                                                                                                               ** 2P D&M 2020.                                                                                         3
CORPORATE PRESENTATION - CLEANEST & KINDEST HYDROCARBONS BEST & SMARTEST OIL & GAS FINDERS - GEOPARK
Model & Criteria for Success         Energy Transitioning World

           ✓ Best & Smartest Oil
             & Gas Finders

           ✓ Safest, Lowest Cost &
             Most Efficient Operator

           ✓ Consistent Free Cash
             Flow & Value Delivery

           ✓ Cleanest & Kindest
             Hydrocarbons

                                                                  4
CORPORATE PRESENTATION - CLEANEST & KINDEST HYDROCARBONS BEST & SMARTEST OIL & GAS FINDERS - GEOPARK
Best & Smartest Oil & Gas Finders

                                    5
CORPORATE PRESENTATION - CLEANEST & KINDEST HYDROCARBONS BEST & SMARTEST OIL & GAS FINDERS - GEOPARK
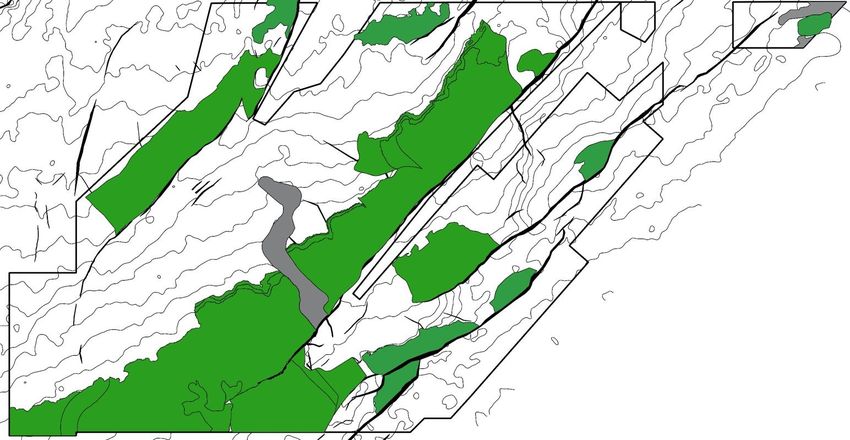
Asset Base & Excellence
              Capabilities                                                                                        Proven Oil & Gas Finder
     LOOKING FOR OIL WHERE OIL HAS ALREADY BEEN FOUND                                             LEADING OIL AND GAS FINDING TEAM IN LATIN AMERICA

                                                                                                  •   Over 25+ year track record (800+ mmboe discovered to date)
                                                                                                  •   0 to 175 mmboe 2P net reserve growth consistently increased since 2006
                                                                                                  •   Growth strategy targets low cost, low risk, high potential exploration projects
                                                                                                      and producing assets with upside potential in proven basins
                                                                                                  •   Continuously investing in attracting the best people and acquiring the best
                                                                                                      tools and know-how

                     SOUTH AMERICAN SEDIMENTARY
                     BASIN GEOPARK TARGET AREAS

                BRAZIL EQUATORIAL MARGIN BASINS
                NORTHWEST MATURE BASINS
                BRAZIL SOUTHEAST BASINS
                SOUTHERN MATURE BASINS
                BASINS ON NEW COUNTRIES OF INTEREST

                                                                               GEOPARK OIL AND GAS FINDING METRICS

        2P GROSS MMBOE                                     ORGANIC                    DRILLING SUCCESS RATE                2P FINDING AND                      2P RESERVE LIFE
          DISCOVERED                                     2P RESERVE                          2006-2020                  DEVELOPMENT CAPEX*                          INDEX
           (2006-2020)                                REPLACEMENT RATIO                    (280+ WELLS)                      (2015-2020)                            (2020)
                                                          (2015-2020)

              >440                                       193%                               75+%                               $4.5                                 11.9
                                                                                                                                 /boe                                 years

* Total capital expenditures divided by 2P Reserves added (based on D&M 2015-2020).                                                                                                     6
CORPORATE PRESENTATION - CLEANEST & KINDEST HYDROCARBONS BEST & SMARTEST OIL & GAS FINDERS - GEOPARK
AssetBase
         Asset  Base                                                       Deep Portfolio in the Right Geography
                                                                      Diversified
                                                                                      LLANOS 34
                                                                                                                COLOMBIA

                                                                                                        • Second largest operator in Colombia                       33,228 boepd*
                     LLANOS BASIN
                                                                                                        • Key Assets: Llanos 34, CPO-5 (Llanos
                                                                              CPO-5
  PUTUMAYO
                                                                                                          basin)​                                                   141 mmboe
    BASIN
                                                                                                        • 1.4+ mm strategic acreage added in 2019                   2P Net Reserves**
                                                                                                          around Llanos 34
                    C O L O M B I A
                                                                                                                                                                    23 Blocks
                                                                                PLATANILLO              • RLI: 1P 7.8 years; 2P 11.6 years; 3P 17.8                 (19 Operated)
                                                                                                          years                                                     3.7 mm gross acres

      PERICO                                                                                                    ECUADOR

                                                            200km
E C U A D O R
                                                                                                         • Low-risk exploration areas between                       Exploratory Assets
                       ESPEJO
                                                                                                           Ecuador’s best producing oil fields
                                                                                          ESPEJO
                                                            PERICO                                                                                                  33 k gross acres
                                                                                                         • Excellent infrastructure, spare
    ORIENTE BASIN
                                                                                                           capacity
                                                                                                                                                                    2 Exploratory Blocks
                                                                                                                                                                    (1 Operated)

                                                                                                                         CHILE + ARGENTINA + BRAZIL
                                      A R G E N T I N A

                FELL                         NEUQUEN
                                              BASIN
                                                                      POTIGUAR BASIN
                                                                                                        • Experience in exploring and developing
                                                                                                                                                                    6,964 boepd*
                                                                                                          mature areas
                 South                                               PARNAIBA BASIN
                Atlantic                                                                                • Upside potential in proven exploration area               34 mmboe
                Ocean
 C H I L E                                                            RECONCAVO              MANATI       + large unconventional resources                          2P Net Reserves**
                                                                        BASIN
                                                                                                        • Vaca Muerta potential
                                                  South                                                                                                             18 Blocks
MAGALLANES                                                            CAMAMU -
   BASIN
                                                 Atlantic
                                                 Ocean
                                                                      ALMADA BASIN
                                                                                              South
                                                                                             Atlantic
                                                                                                        • Core technical team with strong track                     (13 Operated)
                                                                                             Ocean        record                                                    3.0 mm gross acres
                                                                          B R A Z I L

                                                                                                         * 2020 production.    ** 2020 D&M certified 2P Reserves.                          7
CORPORATE PRESENTATION - CLEANEST & KINDEST HYDROCARBONS BEST & SMARTEST OIL & GAS FINDERS - GEOPARK
AssetBase
             Asset  Base                                                                                                      Llanos Llanos
                                                                                                                                     34 Cash34Flow
                                                                                                                                                CoreEngine
                                                                                                                                                     Value

                                                                                                                                                                                     Oil fields (3P D&M 2020)

                                    Chachalaca Field
                                                                                                        Tilo Field                                                Max Field
                                                               Chiricoca Field

                                                                            Tigana Field

                                                                                                                                                                   LLANOS 34 BLOCK: GEOPARK
                                                                                                                                                                   OPERATED WITH 45% WI
                                                                                                                               Tarotaro Field
                      Guaco Field                                                                                                                                  •   Largest discovery in 20+ years in
                                                                                                                                                                       Colombia
                                                                                                                                                                   •   Introduced new geological play-type
                                                                                                      Tua Field
                                                                                                                                                                   •   Drilled more than 100 profitable wells

                                    Jacana Field
                                                                                                                                                                   •   Grew production from zero to 75,000
                                                                                                                                                                       bopd since 2012

                                                                                                        Aruco Field                                                •   13 new fields discovered with 3P gross
                                                                           Curucucú Field
                                                                                                                                                                       reserves of 300+ mmbbl
                                                                                                                                                                   •   Core production with $14-15 per
                                                                                                                                                                       bbl breakevens
                                                             Tigui Field          Jacamar Field
                                                                                                                     1 KM                                          •   2P Reserve Life Index of 10.6 years

                                           NET RESERVES AND PRODUCTION GROWTH IN LLANOS 34

        2P RESERVES* (MMBBL)                                                       PRODUCTION (BOEPD)                                           31,540
                                                                                                                                                                  LLANOS 34 WELL ECONOMICS
                                                              122
                                                       111                                                                             27,219            27,751
                                                                      108                                                                                         Costs per well                   $3.5 mm
                                             87                                                                               20,676                              EUR/well                         ~2 mmbbl
                                      65
                                                                                                                     14,890                                       IP Rate                          1,000-1,700 bopd
                                                                                                            11,990
                            44
                      33                                                                            8,306                                                         IRR**                            500+%

                 12                                                                         3,469                                                                 Payback**                        4-6 Months
        0                                                                           0
                                                                                                                                                                  Drilling Locations               50-70 Gross Wells
      Acq    2013 2014 2015 2016 2017 2018 2019 2020                               Acq      2013 2014 2015 2016 2017 2018 2019 2020

* 2P D&M 2020.                                                                                                                                                    ** $40-45/Brent.                                     8
CORPORATE PRESENTATION - CLEANEST & KINDEST HYDROCARBONS BEST & SMARTEST OIL & GAS FINDERS - GEOPARK
Asset
                AssetBase
                      Base                                                                                          Llanos BasinBasin
                                                                                                                         Llanos  Growth Fairway
                                                                                                                                      Champion

    SYSTEMATIC CONSOLIDATION OF HIGH POTENTIAL ACREAGE AROUND CORE ASSET

                                         LLANOS 87                                                                                                      •   1.4+ MILLION STRATEGIC
                                                                                                            LLANOS 32                                       ACRES ADDED SINCE 2019
                                                                                                                                                        •   0.6-1.3 BILLION BBL OF
                         LLANOS 124                                                                                                                         GROSS RECOVERABLE
                                                                                                                                                            EXPLORATION RESOURCES
                                                                                                                                                            (230–480 MMBOE NET)*
          LLANOS 123

                                                                                                   LLANOS 34

                                                                                                                                                        STRATEGIC PARTNERS
                                                                                       Tigana
                                                                             Jacana                                                LLANOS 104

                                                 Mariposa                   CPO-5
           LLANOS 94
                                                Indico
                                                                                                           LLANOS 86

                                                                                                                                                10 Km

         GeoPark producing blocks
         GeoPark producing oil fields
         Other producing oil fields
         GeoPark exploration blocks

* GeoPark’s aggregate Mean-P10 unrisked volumes in leads and prospects individually audited by Gaffney & Cline as of December 31, 2020.                                              9
CORPORATE PRESENTATION - CLEANEST & KINDEST HYDROCARBONS BEST & SMARTEST OIL & GAS FINDERS - GEOPARK
AssetBase
              Asset  Base                                                                                                               CPO-5 CPO-5
                                                                                                                                              GrowthBig
                                                                                                                                                     Fairway
                                                                                                                                                        Prize

      PRODUCTION & RESERVE GROWTH SINCE ACQUISITION                                                 LARGE GROWTH POTENTIAL ADJACENT TO AND ON TREND WITH LLANOS 34
             UNDERSCORE PROJECT POTENTIAL
                                                                                                    •   Most prospective block in GeoPark’s porfolio
                                                                                                    •   Mid to low-risk exploration prospects
                           GROSS PRODUCTION (BOPD)                                                  •   Two discovered oil fields with breakevens of ~$6-7 /bbl*
                                                           13,142                                   •   Light oil, 36-41º API

                                      +62%                                                          •   400-900 mmbbl gross recoverable exploration resources (120-270 mmbbl net)**

                           8,116
                                                                                                    RECENT & UPCOMING ACTIVITY
                                                                                                    •   Drilled Indico 2 well in November 2020, currently producing 6,200+ bopd
                                                                                                    •   Accelerating activity in 2021 with 5-6 gross wells (including 3-4 exploration wells) and
                                                                                                        3D seismic acquisition to unlock additional leads and prospects

                   December 2019                      December 2020                                                                                                            MULTI-PLAY POTENTIAL

                                                                                                                                                            LLANOS 34          Four Mapped Geological
                                                                                                    CPO-5                                                                            Play Types
                            GROSS RESERVES (MMBBL)                                                                                                                                           Stratigraphic
                                                                                                                                                                                             Column Overview
                                                                       167

                                                                                                          Mariposa                                                                Mirador
                                                                                                                                                           270 Km2
                                   +123/236%                                                              Índico                                          3D seismic            Guadalupe      Structural &
                                                                                                                                                           in 2021-                            Stratigraphic
                                                                                                                                                                                 Gacheta       Potential
                                                                                                                                                             2022
                                                                                                                                                                                  Ubaque
                                                          71
                                                                                                                   Acquiring 300
                                     50                                                                                km2
                    32                                                                                             3D seismic in
                                                                                                                       2021
                                                                                                                                                                           Prospects expected to be drilled 2021
                                                                                                                                                                           Leads and prospects expected to be
                                                                                                                                                                           drilled after 2021
                         July 2019                        2020 Year-end                                                                                                    Discovered oil fields
                                                                                                                                                              10 Km
                                                                                                                                                                           3D seismic acquisition
                2P Certified Gross Reserves          3P Certified Gross Reserves

* Vasconia oil price.          ** GeoPark’s aggregate Mean-P10 unrisked volumes in leads and prospects, individually audited by Gaffney & Cline as of December 31, 2020.
                                                                                                                                                                                                                   10
Safest, Lowest Cost & Most Efficient Operator

                                                11
Capabilities
  Capabilities&&
               Efficiencies
                 Excellence                                                                Low-Cost
                                                                                           Low Cost Operator
                                              DRIVING DOWN EACH AND EVERY COST

               OPERATING COSTS DOWN BY 56%                                          STRUCTURE COSTS DOWN BY 43%

                          OPEX ($/boe)                                                     G&A/G&G Costs ($/boe)

                          56%                                                                   43%
                        Decrease                                                              Decrease

  16

         11
                                         8    8
                  7          7                          7               7           7
                                                                                             6         6           5        6
                                                                                                                                        4

 2014   2015     2016       2017     2018    2019     2020            2014      2015        2016     2017      2018        2019       2020

                                                    GEOPARK OPERATOR METRICS

GROSS OPERATED                      OPERATED PRODUCTION                      OPEX/BOE                         DRILLING & COMPLETION
  PRODUCTION                       AS PERCENTAGE OF TOTAL                      2020                            COST PER WELL ($MM)
    (BOEPD)                            NET PRODUCTION                                                            2012        2020
      2020                                   2020
                                                                      GeoPark           GeoPark                GeoPark            GeoPark
                                                                     Consolidated       Colombia               Llanos 34          Llanos 34

 ~70,000                                     89%                        $7              $5.4                   $6.6               $3.5
                                                                        /boe             /boe

                                                                                                                                              12
Capabilities
           Capabilities&&
                        Efficiencies
                          Excellence Big Margins at Almost Any Operator
                                                     Low Cost  Oil Price
      COST EFFICIENCIES INCREASE EBITDA AND MARGINS

      Adjusted EBITDA ($mm)
            Adjusted EBITDA Margin                                        58%
                                                         55%
                                                                          363
                                                            331

                                                                                 55%
                                          53%
                                                                                 218
                                          176
          35%            41%

           74             78

          2015           2016             2017              2018          2019   2020
Brent
($/bbl)
           54             45               55               72            64     43

                         90% OF PRODUCTION IS CASH                                      LOW COST TO DEVELOP AND PRODUCE DISCOVERED RESERVES
                       FLOW POSITIVE AT $20-$30 BRENT
                                                                                        Future Development CAPEX ($/boe) – D&M 2020
                                                                   100%

                                     Oil ($40-50 /bbl)             90%

                                                                                                        2.1                                2.2
                                                                                                1.9
                                                                                                                                  1.7
                                     Oil ($20-30 /bbl)

                                                                   15%

                                          Gas                                                   1P Reserves                       2P Reserves
                                (Unaffected by oil price)
                                                                                                        GeoPark Colombia   Total GeoPark

                                                                                                                                                 13
Consistent Free Cash Flow & Value Delivery

                                             14
Resilient
      Capabilities
               Cash&Flow
                     Excellence Superior Value
                                         Returns
                                               Generation
                                                 on Capital
                                                          & Invested
                                                             Delivery
                                           CASH GENERATION 2-3X CAPEX IN EVERY OIL PRICE ENVIRONMENT
                                                  Operating Netback and Capital Expenditures (CAPEX) ($mm)
                                                                                                                           3x+
                                                                                                3x+
                                                                                                                     447
                                                                                         398
                                                                                                                                               3x+
                                                                    2x+
                                                                                                                                        276
                                                             228
                 2x+                 3x+
          118                 122                                                                      125                        126
                                                                           106
                                                                                                                                                      75
                        49                  39

                 2015                2016                           2017                        2018                       2019                2020
                                                                    Operating Netback       CAPEX

Brent
                  54                  45                             55                         72                          64                 43
($/bbl)

                                       COST & CAPITAL EFFICIENCY LEAD TO SIGNIFICANT RETURNS
                                     Recycle Ratio (Operating Netback / Finding & Development (F&D) CAPEX)

                                                                                                7x+                       7x+

                                                                                         31.9                       32.5
                                                                    5x+
                                                                                                                                               4x+
                                                             23.9
                 3x+                 3x+
                                                                                                                                        19.9
          16.9                15.9

                        4.5                 4.5                            4.5                         4.5                        4.5                 4.5

                 2015                2016                           2017                        2018                       2019                2020

                                                    Operating Netback ($ /boe)      Average 2P F&D (2015-2020) ($ /boe)
                                                                                                                                                            15
Resilient
                  Capabilities
                          Cash &Flow
                                  Excellence
                                      Self-Funded & Flexible2021
                                                             2021Work
                                                                 WorkProgram
                                                                      Program
                                                             CAPITAL ALLOCATION DISCIPLINE ACCOMMODATES OIL PRICE VOLATILITY

                                                                                                                  DISCIPLINED CAPITAL ALLOCATION METHODOLOGY
                                        $40-45 /bbl                            $50-55 /bbl
                                                                                                                  •     Self-Funded work program
                                 -                     OIL PRICE (BRENT)*                       +                 •     Allocating capital to most value-adding projects based on four criteria:

                                      40,000-42,000                        41,000-43,000                                -   Technical upside, strategic value, economic return and
     PRODUCTION                           boepd                               boepd                                         environmental & social Impact

         CAPEX                         $100-120 MM                             $130-150 MM                        PROVEN FLEXIBILITY
                                                                        MARCH 2021                                • Work program designed to accommodate oil price volatility
                                                                                  $330-370
                                                                      BUDGET INCREASE                                 350
                                                                                                                      Brent     100                                                                 120
                                                                                             $280-330                 ($/bbl)
                                                                                                                      300                                        72
                                                                                                                                                                           64
                                                                                             $210-280                                  54               55                                 50-55    70
                                                                                                                      250                       45                                  43
                                                          $55-60 MM               $130-150 MM                         200
                                                                                                                                                                                                    20
                                $75-90 MM                                                                             150
                                                                                                                                238
                                                                                                                   100
                                                                                                                 CAPEX                                                                              -30
                                                                                                                                                                125       126             130-150
                                                                                                                    50
                                                                                                                 ($MM)                                  106
                                                                                                                                       49                                           75
                                                                                                                                                39
                                                                                                                     0                                                                              -80
                                                                                                         1                      2014   2015    2016    2017     2018      2019     2020    2021

                                                                                        2021 WORK PROGRAM HIGHLIGHTS

         MAINTENANCE                                    OPERATING                                    CAPITAL                                  GROSS                              EXPLORATION
            CAPEX                                       NETBACK*                                    EFFICIENCY                                WELLS                                 CAPEX

            $60-70                                     $330-370                                         +3x                                   37-42                               35-40%
              MILLION                                      MILLION                              Operating netback to                                                     7-8 gross wells, 400 km2 3D
                                                                                              development CAPEX ratio.                                                 seismic Production not included
                                                                                                                                                                              in 2021 guidance.

* Assuming $50-55 Brent prices and $3-4 /bbl Vasconia differential for 2021.                                                                                                                              16
Resilient Cash Flow                                                                                                        High Return Barrels
                         2021E OPERATING NETBACKS ($/BOE)
                                   Low Breakevens
                                 Brent $50-55/bbl - Gas $2-3/mcf 1

                   50
                                                                               45
                  (3)                                                          (2)

                  (10)                             27                          (8)
                   (5)                             (3)                         (5)
                   (6)                                                         (7)
                                                  (11)

                   27                                                          24
                                                   10

                Colombia               Brazil-Argentina-Chile              Consolidated

                Vasconia Differential
                          Op. Netback          Transportation
                                                 OPEX         & Commercial Discounts
                                                            Selling/Royalties  Discounts
                Selling/Royalties              OPEX          Op. Netback

                                                                        POSITIONED TO GENERATE SIGNIFICANT FREE CASH FLOW
                                                                                          2021E Free Cash Flow * ($MM)
                                                                         *Excluding working capital changes, debt service and other payments

                                                   (75-90)

                                                                                     (55-60)
             330-370                                                                                               (55-60)

                                                                                                                                               (55-65)

                                                                                                                                                         90-110
                             1
      Operating Netback 1

150-55/bbl   Brent price and $3-4/bbl Vasconia differential for 2021.
                                                                                                                                                                  17
                                                                                                                                                                   17
Resilient Cash Flow                                                                                                  Strong Balance Sheet

   LOWER DEBT, LOWER COST & IMPROVED DEBT PROFILE
   Debt Amortization Profile ($mm)*
   Before and After Strategic Deleveraging (April 2021)

                                            Before           Current
                                                                                                   500
                                                 425
                                                                                             350

                                                       170

       2021           2022          2023          2024           2025           2026          2027

* Does not include an amortizing debt of $3.5 mm with Santander Brazil.

    CONSERVATIVE USE OF DEBT TO GROW THE BUSINESS                                                                  RESERVE LIFE EXCEEDING DEBT MATURITY
     Gross & Net Leverage (Gross and Net Debt / Adjusted EBITDA)                                                   Reserve Life Index (Years) – 2020

                                           Long-term Objective:                           Covenant:
            5.1                                                                         Net Leverage                                                                               16.1
                                            Net Leverage
Resilient
                Capabilities
                         Cash& Flow
                               Excellence Maximizing
                                                Downside
                                                     the Value
                                                           Oil Price
                                                                of Every
                                                                     Protection
                                                                         Barrel

       HEDGES IN PLACE SECURE BASE OIL PRICE*                          HEDGING STRATEGY
                                                                       •   Provide oil price stability consistent with base budget assumptions
        Brent $/BBL      1Q2021   2Q2021   3Q2021   4Q2021   1Q2022
                                                                       •   Secure price floor while retaining exposure to the upside
                                                                       •   No upfront or premium cost instrument
        Weighted
                          52.2     53.6     61.7     64.0     66.9
        Average Cap                                                    •   Continuous monitoring of the market to capture best windows

        Weighted
                          38.8     40.6     43.3     43.8     47.2
        Average Floor
                                                                              TENOR                        VOLUME               STRUCTURE
        Total Hedged
                         25,500   25,500   20,000   19,500    6,500
        (bopd)

                                                                                                                                    ZCC
        Crude Oil                                                           UP TO 12                     30-70% OF OIL
                                                                                                                                  (BRENT &
        Production       70-75%   70-75%   50-55%   50-55%   15-20%        MONTHS OUT                    PRODUCTION
                                                                                                                                 VASCONIA)
        Hedged

       DIVERSIFIED HEDGING COUNTERPARTS                               TOP TIER COMMERCIAL OFFTAKERS

                                                                                                           2%     1% (Baa3/BB+/A–)**
                                                                           (Ba2/BB–/BB–)**
                                                                                            3%                   4%

                                                                      (Ba1/BB/BB)**      4%

                                                                                                                                       (Colombia National
                                                                                                                         56%             Oil Company)
                                                                                 6%                                                    (Baa3/BBB–/BBB–)**
                                                                                                         21%
                                                                       (Aa2/NA/A+)**

                                                                                       (Top Tier Crude
                                                                                          Offtaker)

* As of April 5, 2021.                                                                                                       ** Moody’s/Fitch/S&P’s.   19
Opportunity
  Opportunity                                                                                 2021 Provides
                                                                                                2021 ProvidesUnique
                                                                                                              UniqueEntry
                                                                                                                     Entry Point
                                                                                                                           Point
                                                                 SHARE PRICE PERFORMANCE AND VOLUME (2017-20211)

                              GRPK +130%                                                                                                                 GRPK       -40%

                             S&P 500    +22%                                                                                                           S&P 500      15%      $16.35
                                Brent   +18%                                                                                                             Brent      -21%

                          S&P Oil&Gas   -10%                                                                                                       S&P Oil&Gas      -39%

                                                                     GRPK +40%                                GRPK +60%

                                                                                -4%                         S&P 500     +32%
                                                                    S&P 500
                                                                                                              Brent     +23%
                                                                S&P Oil&Gas     -10%
                                                                                                         S&P Oil&Gas    -11%
                                                                      Brent     -20%

                             2017                                      2018                                      2019                                  2020                2021
                                                                               Share Price Performance         Volume

                                                                           SHAREHOLDER VALUE RETURN (2017-2021)

                                            BUYBACKS ($MM)                                                                        DIVIDENDS ($MM)

                                                                                                                                                              6.1
                                                                    78
                                                                                                                        0.0
                               0.0

                                                                            NEW SHAREHOLDER VALUE STRATEGY

                                 Buyback up to 10% of shares outstanding                                        Quarterly Dividend of $1.25 mm (Totaling $5 mm per year)

1As   of 22 April 2021.                                                                                                                                                           20
Cleanest & Kindest Hydrocarbons

                                  21
Sustainability                                               SPEED == ESG+
                                                             SPEED    ESG+
                 FOUNDING PRINCIPLES SINCE DAY ONE IN 2002

                                                                             22
Sustainability                                                                                                                                          Environment

           ENVIRONMENT                                                                                                                                                              TARGET

                        LEADING LOW CARBON INTENSITY IN LLANOS 34                                                                                    MULTI-YEAR CARBON TARGET
30
                                     (kg CO2e/boe)

                                                                                                                                                                           20-30%
25                                                                                                                                                                        Reduction

                                                                                                                  GHG Intensity (KgCO2e/boe)
                                                                                                                                                                           (2019-2022E)
                                                           Global Industry Average:
                                                               18 Kg CO2e/boe
20
                                                                                                                                                      13 kg
                                                                                   25-30% BELOW                                                      CO2e/boe
15                                                                               INDUSTRY AVERAGE
                                                                                                                                                                           10-11 kg
                                                                                                                                                                           CO2e/boe
10

5

0                                                                                                                                              GeoPark Llanos 34 2019   GeoPark Llanos 34
     Ecopetrol     BP       Shell    Frontera      Total   PetrobrasLlanos 34 Equinor Aker BP            Lundin                                                             2022E

                                                      Global industry average is based on the “International
                                                      Association of Oil & Gas Producers: Environmental
     Source: NAU Securities Report (March 2021).      Performance Data 2018”.

           ACTION PLAN TO REDUCE CARBON INTENSITY IN LLANOS 34

                   2015-2019                       2021                      2022E

                      3%                                                   20-30%
                  Reduction in                Short-Term                 Reduction in
                   Colombia                      Goal                     Llanos 34

                      Diesel                   Corporate                  Electrification
                      to gas                 Decarbonization                 + Solar
                                                Strategy

                                                                                                                                                                                             23
Sustainability                                                                                       Social & Governance
                                                                                                                    Social

                         SAFETY                               PROSPERITY                              EMPLOYEES                        COMMUNITY
                                                                                                                                      DEVELOPMENT

                          COVID-19                              440+ mmboe                         Gender Equality                       $3.9 million
                         RESPONSE:                        Gross 2P reserves discovered
                                                                                               GeoPark         Industry Average
                                                                                                                                       In Social Investments
                                                                  (2006-2020)                                                          3.3% of 2019 CAPEX
              - Protocols in place for workers
                and contractors                                                                32%            vs.     30%
                                                       17% CAGR           18% CAGR                                   Workforce              Social and
              - Closed-loop transport system                                                   Workforce
                                                       Net asset value Oil & gas production
              - Support to local communities                                                                                                Environmental best
                                                         per share         (2009-2020)
                                                                                               38%            vs.     20%
                                                                                                                                            practices
                ZERO             1.08 bbls                                                    Management            Management
                                                                          Ethics
                Serious       of oil spilt for every                                                                                         32,984
               accidents         million barrels                          Hotline
                                                                          Independent                      90%                      Social program beneficiaries
                                    produced
                                                                                                     Employees trained

              0.61 LTIR           1.84 TRIR             1 Share             100%                                                               376
                Lost Time       Total Recordable                       Independent Audit                   1.3%                     Social engagement meetings
              Incident Rate       Incident Rate          Class         and Compensation           Voluntary turnover rate                with communities
                                                                          Committees

                      26.5 mmbbl                                                                           100%                              ZERO
                                                                        No Casting                                                   blockades in Llanos Basin
                Produced and transported                                                             Of employees are
                without third party incidents             Since 2014      Votes                        shareholders                         since 2014

                                                                                                                                       Sustainable
TARGETS

              0.40 LTIR          1.70 TRIR                    Majority of
Sustainability                                                        Third Party Review and Ratings

    ENGAGEMENT WITH ESG RATING PROVIDERS                                              CONSISTENT IMPROVEMENT IN MSCI ESG RATING
                                                                  6
                                                                AAA

•   Significant improvement in rating since 2018                AA5

•   Improved MSCI rating from B to BBB
                                                                A4
•   Working on expanding our third-party rating coverage base
•   Bloomberg Gender Equality Index:
                                                                BBB
                                                                  3                                                                                       BBB

         -   Awarded a 55.32% Index Score – higher than 50%
             required to enter                                  BB2                                                    BB

         -   Excluded because of market cap size at the time
             (was not over $1.0 Bn)                             B 1                   B

                                                                CCC
                                                                  0
                                                                                   Dec-18                            Dec-19                               mar-21
                                                                                                                                                          Mar-21

                                                                                             MSCI ESG RATING DISTRIBUTION

                                                                                                 31%                             31%

                                                                                                                                                 13%               13%

                                                                                 6%                               6%

                                                                 0%

                                                                CCC               B               BB             BBB               A                 AA            AAA

                                                                 Universe: MSCI ACWI Index constituents, Oil & Gas Exploration & Production, n=16.

                                                                                                                                                                         25
Thank You

                          Cleanest & Kindest
                             Hydrocarbons
     Best & Smartest                             Safest, Lowest Cost
     Oil & Gas Finders                             & Most Efficient
                                                      Operator

                         Consistent Free Cash
                         Flow & Value Delivery

                                                                       26
Disclaimer

The information contained herein has been prepared by GeoPark Limited (“GeoPark“, “we”              implied assessment, based on certain estimates and assumptions, that the resources will
or “us”) solely for informational purposes. No representation or warranty, either expressed         be discovered and can be profitably produced in the future. Specifically, forward-looking
or implied, is provided in relation to the accuracy, completeness or reliability of the             information contained herein regarding "resources" may include: estimated volumes and
information contained herein and nothing shall be relied upon as a promise or                       value of the Company's oil and gas resources and the ability to finance future development;
representation as to performance of any investment or otherwise. The information in this            and, the conversion of a portion of resources into reserves.
presentation is current only as of the date on its cover. For any time after the cover date of
this presentation, the information, including information concerning our business, financial        The information included in this presentation regarding GeoPark’s estimated quantities of
condition, results of operations and prospects may have changed. The delivery of this               proved, probable and possible reserves in Chile, Colombia, Brazil, Argentina and Ecuador
presentation shall not, under any circumstances, create any implication that there have             as of December 31, 2020; is derived, in part, from the reports prepared by DeGolyer and
been no changes in our affairs after the date of the Preliminary Offering Memorandum (as            MacNaughton, or D&M, independent reserves engineers. Certified reserves refers to net
defined below) or the date of this presentation.                                                    reserves independently evaluated by the petroleum consulting firm, D&M. The reserves
                                                                                                    estimates in the reports prepared by D&M were prepared in accordance with the definitions
This presentation does not constitute an offer to sell or the solicitation of an offer to buy any   and guidelines set forth in the 2007 Petroleum Resource Management System
securities and may not be relied upon in evaluating the merits of any investment. The notes         Methodology (the “PRMS”) approved by the Society of Petroleum Engineers, the World
have not been registered under the Securities Act of 1933, as amended (the "Securities              Petroleum Council, the American Association of Petroleum Geologists and the Society of
Act"), or any applicable state securities laws. The notes are being offered only to (a)             Petroleum Evaluation Engineers. PRMS proved (1P) reserves are estimated quantities of
qualified institutional buyers under Rule 144A under the Securities Act and (b) to persons          oil, condensate and natural gas from which there is geological and engineering data that
outside of the United States in compliance with Regulation S under the Securities Act               demonstrate with reasonable certainty that they are recoverable in future years from known
pursuant to GeoPark’s confidential Preliminary Offering Memorandum (the “Preliminary                reservoirs under existing economic and operating conditions. PRMS probable reserves (2P)
Offering Memorandum”).                                                                              are those additional reserves which analysis of geoscience and engineering data indicate
                                                                                                    are less likely to be recovered than proved reserves but more certain to be recovered than
This presentation includes forward-looking statements. Forward-looking statements can be            possible reserves. PRMS possible reserves (3P) are those additional reserves that analysis
identified by the use of forward-looking words such as “anticipate”, “believe”, “could”,            of geoscience and engineering data indicates are less likely to be recoverable than
“expect”, “should”, “plan”, “intend”, “will”, “estimate” and “potential,” among others. Forward-    probable reserves.
looking statements appear in a number of places in this presentation and include, but are
not limited to, statements regarding our intent, belief or current expectations. Forward-           The accuracy of any resource estimate is a function of the quality of the available data and
looking statements are based on our management’s beliefs and assumptions and on                     of engineering and geological interpretation. Results of drilling, testing and production that
information currently available to our management. Such statements are subject to risks             postdate the preparation of the estimates may justify revisions, some or all of which may be
and uncertainties, and actual results may differ materially from those expressed or implied         material. Accordingly, resource estimates are often different from the quantities of oil and
in the forward-looking statements due to various factors, including, but not limited to, those      gas that are ultimately recovered, and the timing and cost of those volumes that are
identified in the “Forward-Looking Statements” and “Risk Factors” sections of the                   recovered may vary from that assumed.
Preliminary Offering Memorandum for further information. Forward-looking statements
speak only as of the date they are made, and GeoPark does not undertake any obligation              Reserves estimates prepared in accordance with SEC rules and regulations may differ
to update them in light of new information or future developments or to release publicly any        significantly from reserves estimates prepared in accordance with PRMS guidelines.
revisions to these statements in order to reflect later events or circumstances or to reflect       Therefore, the 1P reserves estimates presented in this presentation may differ significantly
the occurrence of unanticipated events.                                                             from the 1P reserves estimates presented in our annual report for the year ended
                                                                                                    December 31, 2020.
Statements related to resources are deemed forward-looking statements as they involve the
                                                                                                                                                                                                     27
You can also read