INVESTOR PRESENTATION - July 2018 - KAZ Minerals
←
→
Page content transcription
If your browser does not render page correctly, please read the page content below
INVESTOR PRESENTATION
               July 2018
IMPORTANT NOTICE

DISCLAIMER
Certain statements included in this presentation contain forward-looking information concerning the strategy of KAZ Minerals PLC (‘KAZ Minerals’) and its
business, operations, financial performance or condition, outlook, growth opportunities and circumstances in the countries, sectors or markets in which it
operates. Although KAZ Minerals believes that the expectations reflected in such forward-looking statements are reasonable and are made in good faith, no
assurance can be given that such expectations will prove to be correct. By their nature, forward-looking statements involve known and unknown risks,
assumptions and uncertainties and other factors which are unpredictable as they relate to events and depend on circumstances that will occur in the future
which may cause actual results, performance or achievements of KAZ Minerals to be materially different from those expressed or implied in these forward-
looking statements.
Principal risk factors that could cause KAZ Minerals’ actual results, performance or achievements to differ materially from those in the forward-looking
statements include (without limitation) health and safety, community and labour relations, employees, environmental compliance, business interruption, new
projects and commissioning, reserves and resources, political risk, legal and regulatory compliance, commodity prices, foreign exchange and inflation,
exposure to China, acquisitions and divestment, liquidity and such other risk factors disclosed in KAZ Minerals’ most recent Annual Report and Accounts.
Forward-looking statements should therefore be construed in light of such risk factors. These forward-looking statements should not be construed as a profit
forecast.
No part of this presentation constitutes, or shall be taken to constitute, an invitation or inducement to invest in KAZ Minerals, or any other entity, and
shareholders are cautioned not to place undue reliance on the forward-looking statements. Except as required by the Rules of the UK Listing Authority and
applicable law, KAZ Minerals undertakes no obligation to update or revise any forward-looking statements whether as a result of new information, future
events or otherwise.
Neither this presentation, which includes the question and answer session, nor any part thereof may be recorded, transcribed, distributed, published or
reproduced in any form, except as permitted by KAZ Minerals. By attending this presentation, whether in person or by webcast or call, you confirm your
agreement to the foregoing and that, upon request, you will promptly return any records or transcript of the presentation without retaining any copies.
All financial definitions can be found in the glossary to the Full-Yearly Results 2017 press release.

                                                                                                                                                               1
1. Introduction to
   KAZ Minerals

DELIVERING ON OUR STRATEGY

                                                                           4
                                                      3
                              2
                                               COMPLETED GROWTH      NEXT STEPS…
                                               PROJECTS               Ramp up Bozshakol
                        RESTRUCTURING
       1                                        Bozshakol sulphide    and Aktogay to design
                         Retained low cost,                           capacity
                                                commissioning
                         cash generative
                                                December 2015         Reduce gearing
                         assets and projects
 DISPOSAL OF NON-                               Aktogay sulphide      Health and safety
 CORE ASSETS             Company renamed
                                                commissioning         priority
                         ‘KAZ Minerals’
  $2.2bn proceeds                               December 2016
  Majority free float
  Focused on copper

                                                                                              3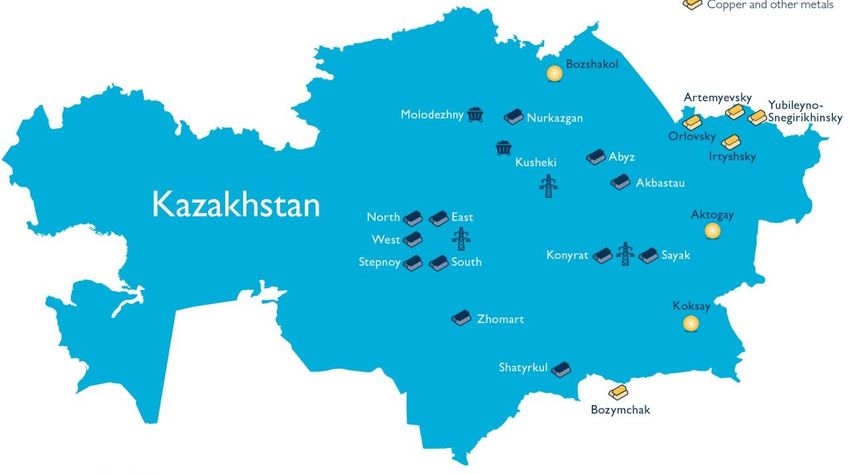
ASSET OVERVIEW

                Producing asset       Potential future project

       RUSSIA                                                        ✓   Transport
                                      Bozshakol
                                                                     ✓   Power

                                                                     ✓
                                                      East Region
                                                                         Water
                         KAZAKHSTAN
                                                                     ✓   Permitting
                                                  Aktogay
                                                                     ✓   Skilled labour
                                            Koksay           CHINA
                                                                     ✓   Located next to world’s
                                                                         largest copper consumer
                                      Bozymchak
                                         KYRGYZSTAN

                                                                                                   4
HIGH GROWTH PRODUCTION PROFILE1

                                                        2022 Aktogay II          Combined annual sulphide copper production from
                                                           ramp up               Aktogay I and Aktogay II of c.170 kt from 2022-27
                                                                                 Aktogay oxide production c.20 kt to 2025
       c.50% production                First production from
        CAGR2 2015-18                Aktogay II by end of 2021

                                                                            Aktogay II

                                                                            Aktogay I
                                                                            (sulphide and oxide)

                                                                            Bozshakol

                                                                            East Region and Bozymchak

 2016                         2018                   2020                 2022                   2024                       2026

Notes:
1. Indicative and not to scale.                                                                                                      5
2. Compound annual growth rate.
FIRST QUARTILE PRODUCER

Net cash cost curve1

                                                                         2017              USc/lb
                                                                           East Region        42
                                                                           and Bozymchak
                    66 USc/lb
                                                                           Bozshakol          54
                                                                           Aktogay            98

                                        105 USc/lb
                                         $2,315/t

                   1st quartile2                              2nd quartile                   3rd quartile   4th quartile

Notes:
1. Conceptual representation as at 31 December 2017, not to scale.                                                         6
2. Wood Mackenzie first quartile cut off 105 USc/lb, 31 December 2017.
2017 HIGHLIGHTS

 Copper production                                                                                 Gold production
 (kt)1                                                                                             (koz)1

                                                              259                                                                       +40%                    179
                                      +80%
                                                                                                                       128
                     144

                     2016                                    2017                                                      2016                                     2017

 Gross EBITDA                                                                                      Free Cash Flow
 ($m)2                                                                                             ($m)3

                                                            1,235                                                                                               452
                                     +151%

                                                                                                                       (60)
                     492

                     2016                                    2017                                                      2016                                     2017

Notes:
1. Payable metal in concentrate and copper cathode from Aktogay oxide ore.                                                                                                      7
2. Gross EBITDA (excluding MET, royalties and special items) includes the periods prior to commercial production.
3. Net cash flow from operating activities before capital expenditure and non-current VAT associated with expansionary and new projects, less sustaining capital expenditure.
2017 HIGHLIGHTS
Gross cash cost Net debt
(USc/lb)1 ($m)
-12% -23%
156 2,669
138
2,056
2016 2017 2016 2017
Notes:
1. Includes the periods prior to commercial production. 8DELIVERING AGAINST OUR 2017 TARGETS
Production
250 259 270
Copper1,2 kt
58 60 65
Zinc kt
160 179 180
Gold1,2 koz
3,450 3,506 3,700
Silver1,2 koz
Gross Cash Cost2 USc/lb
115 121 135
Bozshakol sulphide
100 110 130
Aktogay
205 208 225
East Region and Bozymchak
Notes:
1. Payable metal in concentrate and copper cathode from Aktogay oxide ore. 9
2. Includes the periods prior to commercial production.2018 GROUP PRODUCTION GUIDANCE
East Region & Bozshakol Aktogay Group
Bozymchak
Copper1 FY 2018E c.65 95 – 105 1102 – 1302 270 – 300
kt Q1/Q2 actual
Zinc in
FY 2018E c.60 c.60
concentrate Q1/Q2 actual
kt
Gold3 FY 2018E 45 – 50 115 – 125 160 – 175
koz Q1/Q2 actual
Silver3 FY 2018E c.2,000 c.500 c.500 c.3,000
koz Q1/Q2 actual
Notes:
1. Payable metal in concentrate and copper cathode from Aktogay oxide ore. 10
2. Includes 20-25 kt of cathode production from oxide ore.
3. Payable metal in concentrate.2. Bozshakol
CONCENTRATOR RAMP UP PROGRESS

Ore throughput                                                                                         First extended
(% of design capacity)                                                                                 maintenance
                             Sulphide concentrator    Clay plant                                          shutdown

                                                                                       Mill relining                    Mill relining

                                                                   93%         93%                         95%                 95%
                                                                                                                        89%
                                                                                     81%     80% 82%
                                        76%          74%
                                                                         69%
                                                                                                                 65%
                            61%

                                                           40%
                  32%

    5%                                        15%

       Q1             Q2      Q3           Q4          Q1            Q2          Q3              Q4           Q1            Q2
      2016           2016    2016         2016        2017          2017        2017            2017         2018          2018

                                                                                                                                        12
BOZSHAKOL PRODUCTION OUTLOOK AND 2018 GUIDANCE
FY 2017 production: Copper (kt)1 Full year guidance
– Achieved guidance across all metals
50 95 - 105
– 101 kt copper, 119 koz gold, 687 koz of silver
27 23
Q2 2018 production: Q1 Q2 H2
– 6.8 Mt processed, grade 0.46% (Q1 2018: 6.7 Mt at
Gold (koz)1 Full year guidance
0.52%)
– Copper production 22.9 kt (Q1 2018: 26.9 kt) 62 115 - 125
– Gold output 26.3 koz (Q1 2018: 36.0 koz) 36 26
Q1 Q2 H2
Reduced throughput in Q2 due to planned
maintenance at the sulphide plant
Silver (koz)1 Full year guidance
340 c.500
Small quantity of Molybdenum concentrate produced
during Q2 and samples sent to potential customers 183 157
for evaluation Q1 Q2 H2
On track to achieve 2018 guidance for all metals
Notes:
1. Payable metal in concentrate. 133. Aktogay
AKTOGAY SULPHIDE RAMP UP

    FY 2017 production:                                Ore throughput and copper grade
    – Achieved commercial production on 1 October                       90%                                             89%     0.9%
      2017                                                                     0.80%
                                                                        80%                                                     0.8%
    – 65 kt copper1, in line with guidance                                              0.72%
    – Benefited from elevated grades of 0.66% due to                    70%                      66%    68%     66%             0.7%
      mining of a layer of supergene enriched ore                       60%                                                     0.6%
                                                                                                0.65%

                                                       Throughput (%)
                                                                                                                0.62%   0.62%

                                                                                                                                       Grade (%)
                                                                                                        0.58%
                                                                        50%                                                     0.5%
    Q2 2018 production:                                                       reserve
                                                                        40%    grade 47%                                        0.4%
    – Sulphide concentrator achieved design                                    0.33%
      capacity, ramping up to 100% for a sustained                      30%                                                     0.3%
      period during Q2
                                                                        20%   27%                                               0.2%
    – Copper production1 increased by 32% to 27.9 kt
      (Q1 2018: 21.1 kt), benefitting from strong                       10%                                                     0.1%
      volume ramp up and sustained high copper
                                                                        0%                                                      0.0%
      grade                                                                    Q1       Q2       Q3      Q4      Q1      Q2
                                                                              2017     2017     2017    2017    2018    2018

Notes:
1. Payable metal in concentrate.                                                                                                             15
OXIDE PRODUCTION AND 2018 OUTLOOK
FY 2017 production: Copper (kt)1
Full year guidance
– SX/EW facilities successfully operated at design
11 20 - 25
capacity in 2017
– 25 kt copper cathode, guidance achieved 5 6
Q1 Q2 H2
Q2 2018 production:
– 4.5 Mt oxide ore to leach pads at grade 0.31% Copper production (kt)1
(Q1 2018: 4.4 Mt at grade 0.30%) Cold weather
Cold weather
– Copper cathode production increased to 6.2 kt 8.0
6.7
6.2
5.7
5.3
On track to achieve 2018 target of 20-25 kt 4.7
Q1 Q2 Q3 Q4 Q1 Q2
2017 2017 2017 2017 2018 2018
Notes:
1. Copper cathode production. 16AKTOGAY SULPHIDE 2018 TARGETS
Higher average throughput levels in the remainder Copper (kt)1 Full year guidance
of the year are expected to offset a reduction in 49 90 - 105
average copper grades 21 28
Full year guidance is held at 90-105 kt Q1 Q2 H2
Silver (koz)1 Full year guidance
215 c.500
95 120
Q1 Q2 H2
✓ Commercial production
from October 2017
✓
Achieved 100% of design
capacity
2019
full production
2017 2018 2019
Notes:
1. Payable metal in concentrate. 17AKTOGAY II EXPANSION PROJECT
In December 2017 the Board approved a project to Revised copper production profile1
double sulphide processing capacity at Aktogay,
from 25 Mt to 50 Mt per annum 250 Aktogay I + oxide Aktogay II
First production expected in H2 2021, ramp up in
2022 200
Copper output (kt)
Adds c.80 kt of annual copper production from
2022-27 and c.60 kt from 2028 onwards 150
Capital budget $1.2 billion
100
Low risk brownfield expansion of an existing asset,
duplicate of existing sulphide plants at Bozshakol
and Aktogay 50
To be implemented by the KAZ Minerals projects
division which delivered Bozshakol and Aktogay I 0
2016 2018 2020 2022 2024 2026 2028 2030
Notes:
1. Indicative. 184. East Region and Bozymchak
EAST REGION AND BOZYMCHAK PRODUCTION

   FY 2017 production:                                    Q2 production vs 2018 guidance
   – Copper output 67 kt (2016: 77 kt)
                                                           Copper (kt)1           29                        c.65
   – Gold production of 59kt, at top end of guidance
                                                               14          15
                                                               Q1          Q2                   H2
   Q2 2018 production:
   – Copper production 15.3 kt (Q1 2018: 14.0 kt),         Zinc (kt)2           25                          c.60

     reflecting higher copper grade processed at               14          11
     Nikolayevsky                                               Q1         Q2                  H2
   – Zinc output reduced to 10.7 kt (Q1 2018: 14.2 kt),
     due to lower grades and reduced recovery              Gold (koz)1                  28                45 - 50

   – Zinc production expected to increase in H2 2018            14              14
                                                                Q1              Q2                   H2
   – On track to achieve full year guidance across all
     metals
                                                           Silver (koz)1               1,081              c.2,000

                                                                574             507
                                                                 Q1             Q2                   H2

Notes:
1. Payable metal in concentrate.                                                                                   20
2. Zinc in concentrate.
5. 2017 full year results
HEALTH AND SAFETY

Review of 2017
   Four fatalities occurred in 2017 (2016: 6)
   – No fatality is acceptable, target is zero
   – Fatality rate has significantly reduced since 2010
   – Open pit assets have operated with zero fatalities
      since commencement of production
   Total Recordable Injury Frequency Rate1 increased
   to 1.6 (2016: 1.2), serious injuries reduced
Improving our performance
   Site collaboration on safety programmes
   Focus on leadership, culture and behaviour change
   Underground mine supervisor target for 30% of time
   spent in field on health and safety

Notes:
1. Total Recordable Injury Frequency Rate or TRIFR is the number of Recordable Injuries occurring per million man-hours worked during the year.   22
FINANCIAL UPDATE
$m (unless otherwise stated) 2017 2016 Continued ramp up of new operations combined
Gross Revenues1 1,938 969 with improved commodity prices has transformed
earnings and cash flow
Gross EBITDA2 1,235 492
Gross EBITDA $1,235 million
Margin 64% 51%
– Includes pre-commercial EBITDA from Aktogay
Revenues 1,663 766 sulphide ($185 million) and Bozshakol clay
EBITDA3 1,038 351 plant ($12 million)
Net cash cost (USc/lb)4 66 59
Competitive net cash cost of 66 USc/lb, all
operations in the first quartile of cost curve
Free Cash Flow5 452 (60)
Free Cash Flow of $452 million
EPS – based on Underlying Profit ($)6 1.07 0.40
Net debt $2,206 million at 31 March 2018
Net Debt (2,056) (2,669)
Notes:
1. Includes all operations for the full year including periods prior to commercial production. 23
2. Gross EBITDA (excluding MET, royalties and special items) includes all operations for the full year including the periods prior to commercial production.
3. EBITDA (excluding MET, royalties and special items).
4. Cash operating costs, including pre-commercial production costs, plus TC/RC on concentrate sales, less by-product gross revenues, divided by copper sales volumes.
5. Net cash flow from operating activities before capital expenditure and non-current VAT associated with expansionary and new projects, less sustaining capital expenditure.
6. EPS based on Underlying Profit excluding special items.GROSS EBITDA RECONCILIATION
Production output increase from lower cost operations resulted in 151% higher Gross EBITDA
($m) Copper volume
ramp up of
Volume3 Commodity prices Bozshakol and
Aktogay adds
63 1,235 $479 million to
183
Gross EBITDA
1,038
43 1
258
(197) Favourable
(26)
commodity prices
221
Aktogay 64 contribute a
Bozshakol
East Region & Bozymchak
(37) further $246
492 (25)
Corporate Services (1) million
Total 1
Copper
Gross Bozshakol Aktogay East Region By-product Cost Copper By-products Gross Capitalised EBITDA
EBITDA and volume impact⁴ price price EBITDA EBITDA² 2017
2016¹ Bozymchak 2017¹
Notes:
1. Includes operations for the full year, including the periods prior to commercial production. 24
2. 2017 EBITDA capitalised during pre-commercial production at Bozshakol ($12 million) and Aktogay ($185 million).
3. 2017 sales volume movement at 2016 cash costs.
4. Net change in cash costs per tonne.HIGH GROWTH, LOW COST
Copper sales volumes (kt) Gross cash cost (USc/lb) By-product credit (USc/lb) Net cash cost (USc/lb)
Bozshakol
Gross cash cost Gross cash costs increased as expected due to
2017 guidance
115-135 USc/lb lower grades, ramp up of higher cost clay operations
and normalisation of maintenance costs
99
121 (67) Strong gold output resulted in low net cash cost of
106
45 54 USc/lb (2016: 27 USc/lb)
54
2016 2017 2016 2017 2017
Aktogay Gross cash cost reduced in 2017, mainly due to
Gross cash cost
Cash 2017
costsguidance
(USc/lb) volume growth from lower cost sulphide operations
110-130 USc/lb
87 Costs benefited from temporary elevated copper
grade, low maintenance costs and muted
114 100 (2) 98
inflationary pressures
14 Low strip ratio supports competitive gross cash cost
2016 2017 2016 2017 2017
positioning
25HIGH GROWTH, LOW COST
Copper sales volumes (kt) Gross cash cost (USc/lb) By-product credit (USc/lb) Net cash cost (USc/lb)
East Region and Bozymchak
Gross cash cost 2017 costs were at lower end of market guidance,
2017 guidance
205-225 USc/lb but above prior year due to 15% reduction in copper
sales volumes
82
70 191 208 (166)
By-product credits result in competitive first quartile
net cash cost of 42 USc/lb (2016: 68 USc/lb)
42
2016 2017 2016 2017 2017
Group Group gross cash cost improved due to higher
volumes from Aktogay
256 Net cash cost amongst the lowest of pure-play
156 copper producers globally
138 (72)
141
Increase in net cash cost from prior year reflects
66
growth of Aktogay, which has lower by-product
2016 2017 2016 2017 2017
credits
26MOVEMENT IN GROUP NET DEBT
($m)
1,235 Net debt ($m)
2,669
(95) (166) 2,056
Sustaining capex Guidance Actual
Bozshakol & Aktogay 25 14
East Region & Bozymchak 60 52 31 Dec 2016 31 Dec 2017
(110) Other - 2
Total 85 68
(276)
232 3 613
(222)
(68)
Expansionary capex Guidance Actual
Bozshakol3 100 57
(196)
Aktogay4 150 103
East Region & Bozymchak 30 22
Other 20 14
Total 300 196
Gross Working MET and CIT Interest Sustaining Expansionary Net non-current VAT Other⁵ Decrease in
EBITDA¹ capital paid paid capex capex associated net debt
increase² with growth projects
Notes:
1. Gross EBITDA (excluding MET, royalties and special items) includes all operations, including the periods prior to commercial production. 27
2. Includes working capital arising from pre-commercial operations at Bozshakol and Aktogay, including MET movements.
3. Includes $35 million related to clay ore mined to 1 July 2017.
4. Includes $29 million of inventory investment relating mainly for first fills consumables.
5. Includes foreign exchange, interest received and other movements.FINANCIAL POSITION STRENGTHENED
Volume growth and low costs result in higher Net debt / Gross EBITDA
EBITDA and Free Cash Flow
3,000 12
Amended and extended PXF facility signed on 8
2,500 10
June 2017, increased facility of $600 million is fully
drawn 2,000 8
Net debt $2,206 million at 31 March 2018, (31
1,500 6
December 2017: $2,056 million)
1,000 4
– $250 million deferred from 2016-17 paid to
Aktogay construction contractor in Q1 2018 500 2
Capital allocation priorities:
0 0
i. Focus on deleveraging 2014 2015 2016 2017
ii. Invest in high return growth projects Net debt Net debt / Gross EBITDA
iii. Shareholder returns
28INVESTING IN GROWTH
Major growth projects expansionary capex ($m)
Bozshakol Aktogay I Aktogay II
590 Final outstanding
40 payments carried
Includes $300
over from 2017
million deferred
constructor 200 420
400
payment and
$50 million
expansion of
heap leach cells
400 200
160 350 400
57
200
103
20
2017A 2018 2019 2020 2021
$250 million deferred from 2016 paid to Aktogay construction contractor in the Q1 2018
292018 FINANCIAL GUIDANCE
Gross cash cost Sustaining capex Expansionary capex
0
Bozshakol Bozshakol Bozshakol
130-150 USc/lb $35 million $40 million
Aktogay Aktogay Aktogay I & II
110-130 USc/lb $30 million $550 million
East Region & Bozymchak East Region & Bozymchak Other (incl. Artemyevsky II)
230-250 USc/lb $50 million $40 million
Group Group
$115 million $630 million
306. Delivering the future
DELIVERING THE FUTURE

 80% increase in copper production in 2017

 All operations in commercial production

 Net cash cost of 66 USc/lb, amongst the lowest
 globally

 All operations in the first quartile of the cost curve

 Aktogay expansion project approved to deliver low
 risk growth

 Copper outlook materially improved

                                                          32
APPENDIX
SUMMARY INCOME STATEMENT

Key line items                                                                                  Reconciliation of Underlying Profit
$m (unless otherwise stated)                                           2017         2016        $m                                                                         2017       2016
Revenues1                                                              1,663          766       Net profit attributable to equity shareholders of the Company                   447    177
Cost of sales                                                          (755)        (413)       Impairment charges                                                               19      3
Gross profit                                                              908         353       PXF fees                                                                         10      -
Operating profit                                                          715         218       Total Underlying Profit                                                         476    180
Net finance (costs)/income                                             (135)            2
Profit before taxation                                                    580         220
Income tax expense                                                     (133)         (43)
Profit for the year                                                       447         177
EPS based on Underlying Profit ($)                                        1.07       0.40

2017 revenues split by product1
                         4%                                        Copper
                13%
                                                                   Zinc
             7%                                                    Gold

                                                                   Silver

                                       76%

Notes:         .
1. Excludes pre-commercial production revenues: 2017 $275 million (Bozshakol $21 million, Aktogay $254 million), 2016 $203 million (Bozshakol $187 million, Aktogay oxide $16           34
    million).
REVENUES AND SALES VOLUMES
(COMMERCIAL PRODUCTION ONLY)
Revenues1 Sales volumes1
$m 2017 2016 kt (unless otherwise stated) 2017 2016
Copper cathode 629 441 Copper cathode 101 90
Copper in concentrate 629 85 Copper in concentrate2 108 16
Zinc in concentrate 115 95 Zinc in concentrate 57 75
Gold bar 78 69 Gold bar (koz) 62 55
Gold in concentrate 138 23 Gold in concentrate (koz)2 107 22
Silver bar 50 46 Silver bar (koz) 2,940 2,679
Silver in concentrate 13 1 Silver in concentrate (koz)2 745 158
Other 11 6
Total revenues 1,663 766
Average realised prices LME and LBMA Prices
2017 2016 2017 2016
Copper cathode ($/t) 6,252 4,904 Copper ($/t) 6,163 4,860
Copper in concentrate ($/t)3 5,837 5,210 Zinc ($/t) 2,896 2,095
Zinc in concentrate ($/t) 2,038 1,271 Gold ($/oz) 1,257 1,251
Gold bar ($/oz) 1,262 1,249 Silver ($/oz) 17.0 17.1
Gold in concentrate ($/oz)3 1,280 1,068
Silver bar ($/oz) 17.1 17.2
Silver in concentrate ($/oz)3 16.5 14.3
Notes:
1. Excludes pre-commercial activities, therefore excludes Bozshakol sulphide prior to 27 October 2016, clay prior to 1 July 2017, Aktogay oxide prior to 1 July 2016 and sulphide prior to 1 35
October 2017.
2. Payable metal in concentrate sold during the periods of commercial production.
3. After the deduction of processing charges.GROSS REVENUES AND SALES VOLUMES
Gross Revenues1 Sales volumes1
$m 2017 2016 kt (unless otherwise stated) 2017 2016
Copper cathode 698 457 Copper cathode 112 93
Copper in concentrate 834 212 Copper in concentrate2 144 48
Zinc in concentrate 115 95 Zinc in concentrate 57 75
Gold bar 78 69 Gold bar (koz) 62 55
Gold in concentrate 138 79 Gold in concentrate (koz)2 107 65
Silver bar 50 46 Silver bar (koz) 2,940 2,679
Silver in concentrate 14 5 Silver in concentrate (koz)2 819 347
Other3 11 6
Total revenues 1,938 969
Average realised prices LME and LBMA Prices
2017 2016 2017 2016
Copper cathode ($/t) 6,233 4,898 Copper ($/t) 6,163 4,860
Copper in concentrate ($/t)3 5,804 4,483 Zinc ($/t) 2,896 2,095
Zinc in concentrate ($/t) 2,038 1,271 Gold ($/oz) 1,257 1,251
Gold bar ($/oz) 1,262 1,249 Silver ($/oz) 17.0 17.1
Gold in concentrate ($/oz)3 1,280 1,222
Silver bar ($/oz) 17.1 17.2
Silver in concentrate ($/oz)3 16.5 17.2
Notes:
1. Includes pre-commercial activities, therefore includes Aktogay and Bozshakol for the full year. 36
2. Payable metal in concentrate.
3. After the deduction of processing charges.REVENUE RECONCILIATION
($m)
Volume growth complemented by increase in commodity prices ($m) Average LME
FY 2017 vs FY 2016
Volume Commodity prices
63 1,938
183 38%
443 43 27%
1,663
(75) (275)
312 Copper Zinc
969 By-products Average LBMA
volume ($m) FY 2017 vs FY 2016
Gold 63
Silver 12
Zinc (37)
Other 5 1%
(1)%
Gross Bozshakol Aktogay East Region By-product Copper By-product Gross Capitalised Revenues
revenues and volume price price revenues revenues² 2016 Silver Gold
2016¹ Bozymchak 2017¹
Notes:
1. Includes pre-commercial production revenues: 2017 $275 million (Bozshakol clay $21 million, Aktogay sulphide $254 million), 2016 $203 million (Bozshakol $187 million, Aktogay oxide 37
$16 million).
2. Revenues relating to pre-commercial production activities at Bozshakol clay ($21 million) and Aktogay sulphide ($254 million) are capitalised and therefore excluded from revenues.EBITDA1 RECONCILIATION EBITDA by operating segment $m 2017 2016 Bozshakol2 515 204 Aktogay2 374 33 East Region and Bozymchak 371 279 Corporate services (25) (24) Gross EBITDA2 1,235 492 Less: Capitalised pre-commercial production EBITDA (197) (141) Bozshakol (12) (137) Aktogay (185) (4) EBITDA 1,038 351 Notes: 1. EBITDA (excluding MET, royalties and special items). 38 2. Gross EBITDA (excluding MET, royalties and special items) includes the periods prior to commercial production.
CASH FLOW

($m)                                                                                                                                                           2017     2016
EBITDA1                                                                                                                                                        1,038      351
Working capital movements2                                                                                                                                       (40)    (73)
Interest paid                                                                                                                                                  (222)    (179)
MET and royalties paid2                                                                                                                                        (151)     (73)
Income tax paid                                                                                                                                                (110)     (39)
Foreign exchange and other movements                                                                                                                                5        4
Net cash flows from operating activities before capital expenditure and non-current VAT associated with major growth projects                                    520       (9)
Sustaining capital expenditure                                                                                                                                   (68)    (51)
Free Cash Flow                                                                                                                                                   452     (60)
Expansionary and new project capital expenditure3                                                                                                                (69)   (273)
Non-current VAT associated with major growth projects                                                                                                            232     (89)
Proceeds from disposal of property, plant and equipment                                                                                                             1        1
Interest received                                                                                                                                                  16        9
Other                                                                                                                                                             (1)      (3)
Cash flow movement in net debt                                                                                                                                   631    (415)

Notes:
1. EBITDA (excluding MET, royalties and special items).                                                                                                                    39
2. Excludes working capital and MET movements arising from pre-commercial production activities at the Bozshakol and Aktogay operations in 2017 and in 2016.
3. Capital expenditure includes the capitalisation or revenues, costs and working capital outflows during the periods of pre-commercial production.
SUMMARY BALANCE SHEET

Assets                                  Non-current assets
$m                       2017    2016   $m                           2017      2016
Non-current assets      3,215   3,536   Intangible assets               7         8
Gross liquid funds      1,821   1,108   Tangible assets             2,973     3,092
Other current assets      586     413   Other non-current assets      170       364
Total                   5,622   5,057   Deferred tax asset             65        72
                                        Total                       3,215     3,536

Equity & liabilities                    Net debt
$m                       2017    2016   $m                            2017      2016
Equity                    998     536   Gross liquid funds           1,821     1,108
Borrowings              3,877   3,777   Borrowings                 (3,877)   (3,777)
Other liabilities         747     744      Short-term                (418)     (331)
Total                   5,622   5,057      Long-term               (3,459)   (3,446)
                                        Total                      (2,056)   (2,669)

                                                                                 40
DEBT FACILITIES
Facility Maturity and interest rate Balance as at 31 December 20171
CDB Bozshakol/ Final maturity 2025 Fully drawn – $1,539 million
Bozymchak $ LIBOR + 4.5% Balance sheet covenant
Semi-annual principal and interest payments
CDB Aktogay Final maturity 2029 Fully drawn – $1,469 million
$ LIBOR + 4.2% (USD facility) Balance sheet covenant
PBoC 5 year (RMB facility)
USD facility - semi-annual principal payments from March 2018;
semi-annual interest payments
RMB facility - semi-annual principal payments; quarterly interest
payments
DBK Aktogay Final maturity 2025 Fully drawn – $300 million
$ LIBOR + 4.5% Balance sheet covenant
Semi-annual principal payments from June 2018
Semi-annual interest payments (USD)
PXF Final maturity 2021 Fully drawn – $600 million
Margin based on net debt/EBITDA ratio New $600m PXF signed in June 2017
- between $ LIBOR +3.0% to 4.5% - Extended final maturity by 2.5 years to June 2021
Monthly interest payments - Monthly principal repayments from July 2018
Monthly principal repayments from July 2018 to June 2021
Notes:
1. Drawn amount excludes amortised net fees. 41DEBT REPAYMENTS
Repayment Profile1 ($m)
PXF DBK CDB Aktogay CDB Bozshakol/Bozymchak
545 545
445
424
359
128
2018 2019 2020 2021 2022-25 2 2026-29 2
Notes:
1. Based on drawn debt facilities at 31 December 2017. 42
2. Average debt repayments per annum.GROUP CASH COST RECONCILIATION1 $m (unless otherwise stated) 2017 2016 2015 H2 2017 H1 2017 H2 2016 H1 2016 H2 2015 H1 2015 Copper sales volumes (kt)2 256 141 79 141 115 87 54 43 36 Revenues 1,663 766 665 942 721 464 302 324 341 EBITDA3 (1,063) (375) (240) (624) (439) (248) (127) (131) (109) Pre-commercial production4 78 62 6 38 40 33 29 - 6 Cost of purchased copper cathode - - (28) - - - - (6) (22) TC/RCs and other adjustments 98 31 - 53 45 29 2 2 (2) Gross cash cost 776 484 403 409 367 278 206 189 214 Gross cash cost (USc/lb) 138 156 230 132 144 146 173 197 270 By-product credits (406) (300) (212) (201) (205) (187) (113) (94) (118) Net cash costs 370 184 191 208 162 91 93 95 96 Net cash cost (USc/lb) 66 59 109 67 64 48 78 99 121 Notes: 1. 2015 includes East Region and Bozymchak only. 43 2. Includes sales for the full year, including the periods prior to commercial production. 2015 excludes sales of 5 kt of externally purchased material. 3. EBITDA (excluding MET, royalties and special items), excludes corporate services. 4. Cash operating costs capitalised during the periods prior to commercial production.
AKTOGAY OPERATING COSTS AND SUSTAINING CAPEX

  Net cash costs to 2027 expected to be maintained       Copper processing grade profile2
  at 100-120 USc/lb1
                                                          12 months to 31 December 2017,
                                                          supergene enriched                 0.66%
  Operating cost efficiencies from larger scale mining
  operations offset the effect of accelerated grade
  decline, as processing volumes are brought forward
                                                          2017 – 2021
                                                          Aktogay I                         c.0.50%
  Sustaining capital expenditure estimated to increase
  from $30-$40 million to $50-$60 million per annum
  from 2022                                               2022 – 2027
                                                          Aktogay I and Aktogay II          c.0.40%

                                                          Life of mine sulphide
                                                          resource grade                     0.33%
Notes:
1. 2017 US dollar terms.                                                                              44
2. Sulphide ore.
AKTOGAY KEY PROJECT STATISTICS
Aktogay sulphide I
25 Mt annual sulphide ore processing capacity
Mine life of over 50 years
Average annual copper production of 90 kt, 2018-27
Project development cost $2.0 billion1
Aktogay sulphide II
Additional 25 Mt sulphide ore processing capacity
Reduces mine life to 28 years
Increases sulphide copper production to c.170 kt,
2022-27 and c.130 kt annual thereafter
Project development cost $1.2 billion, 2018-21 Aktogay sulphide concentrator no. 1
Aktogay oxide
Cathode production c.20 kt, 8 year resource life to 2025
Notes:
1. Aktogay capital expenditure including sulphide and oxide. 45SENIOR MANAGEMENT
Oleg Novachuk, Chair Eldar Mamedov, General Director, KMM LLP
Joined the Company in 2001, former Chief Executive and was Joined the Company in 1996, former Head of Legal and
appointed Chair on 1 January 2018, with responsibility for was appointed as General Director of the KMM LLP in
strategy, government relations and business development. 2014, with responsibility for government relations,
legal, procurement and administration.
Andrew Southam, Chief Executive Officer Madina Kaparova, Group Procurement Director
Joined the Company in 2006, former Chief Financial Officer Joined the Company in 1998 and was appointed Group
and was appointed Chief Executive Officer on 1 January 2018, Procurement Director in 2016, with responsibility for
with responsibility of executive management of the Group and development and implementation of procurement strategy.
leading the senior management team in the day to day running
of the business.
John Hadfield, Chief Financial Officer Sergey Leu, General Director, Bozshakol
Joined KAZ Minerals in November 2017 as Deputy Chief Joined KAZ Minerals in August 2016 as General Director
Financial Officer and was appointed Chief Financial Officer on of Bozshakol with responsibility for management of
1 January 2018. Bozshakol operations.
Mian Khalil, General Director, Projects Ilsur Dautov, General Director, East Region
Joined the Company in 2010, with responsibility for Appointed General Director of the East Region in March
construction of major growth projects, Aktogay and Bozshakol 2014. Responsible for the management of East Region
and is currently focused on the expansion project at Aktogay. operations.
Mark Anderson, Chief Operating Officer Ilyas Tulekeev, General Director, Bozymchak
Joined KAZ Minerals in 2017, with responsibility for overseeing Joined KAZ Minerals in 2006 and was appointed General
the performance of the Group’s mining assets. Director of Bozymchak in 2011, with responsibility for
management of Bozymchak operations.
46
46INCREASING EFFICIENCY REDUCES ENVIRONMENTAL IMPACTS
ENERGY USE WATER
TJ/kt sulphide ore processed (energy consumption) Water withdrawal per unit of copper (megalitres/kt)
2017 0.24 2017 190.4
2016 0.46 2016 212.4
2015 0.86 2015 180.7
CO2
CO2 emissions per unit of copper (kt)
2017 8.3
2016 10.3
2015 10.8
CO2 emissions per unit of ore processed (kt) CO2 emissions per $ million revenue (t)
2017 0.05 2017 1,289
2016 0.09 2016 1,923
2015 0.20 2015 1,376
47RESTRUCTURING OCTOBER 2014
Disposal Assets
Copper and other metals
Coal mines
Captive Power
KAZ Minerals
Growth projects
Copper and other metals
48MINERAL RESOURCES SUMMARY - 31 DEC 2017
Artemyevsky Irtyshsky Orlovsky Bozymchak Aktogay Aktogay Bozshakol Bozshakol
sulphide oxide sulphide clay
Resources1 (kt) 24,1962 4,645 13,461 15,729 1,583,454 90,257 872,164 26,619
Copper grade (%) 2.06 2.26 3.09 0.84 0.33 0.36 0.35 0.65
Zinc (%) 4.43 5.36 3.99 - - - - -
Gold grade (g/t) 0.9 0.4 0.9 1.4 - - 0.1 0.7
Silver grade (g/t) 88 88 38 8.6 - - 1.3 1.3
Molybdenum grade (%) - - - - 0.008 - 0.005 -
Type of mine Underground Underground Underground Open pit / Open pit Open pit
underground
Concentrator Nikolayevsky Belousovsky On-site On-site On-site On-site
Description Mine with Irtyshsky has Orlovsky is the Bozymchak is Large scale mine, located in East Large scale mine, located in
polymetallic ore, been largest mine in located in Region of Kazakhstan. Commenced Pavlodar Region of Kazakhstan.
operating since operating East Region by Kyrgyzstan production of copper cathode from Commenced production of copper
2005 since 2001 copper metal in oxide ore in December 2015 and in concentrate from sulphide ore in
ore extracted copper in concentrate from sulphide February 2016
ore in February 2017
Notes:
1. Measured and indicated as at 31 December 2017. 49
2. Includes Artemyevsky II expansion.KAZ Minerals PLC 6th Floor, Cardinal Place 100 Victoria Street London SW1E 5JL UK www.kazminerals.com
You can also read